The Crime and Disorder Audit Process:
A Post-Mortem of the First Round.
Kate Bowers, Jennifer Jennings and Alex Hirschfield1,
Abstract
This paper reviews Crime and Disorder Audits published following the 1998 Crime and Disorder Act. It specifically examines the audits produced in the north west and north east of England by means of a survey of the partnerships as well as an analysis of the content and design of the audit documents themselves. The primary aim of this exercise was to establish what was best practice and what elements were involved obtaining this. In general it has been found that last time round the whole process was an important learning experience, which is likely to require a number of changes not only in organisational matters but also in relation to data issues.
Keywords: Crime and Disorder Audits; Partnerships; Audit process; Design and Content; Public Consultation; Crime and Disorder Strategies.
Introduction
targets for crime reduction. The first round of audits and strategies was published in April 1999 and a second round is due in April 2002. The challenge created by the first round has meant that local authorities and other members of the Crime and Disorder Partnerships have had to reconsider some elements of their approach to the production of the audits. This paper looks at the north west and north east regions of England and examines some of the methods used and problems encountered by crime and disorder audit teams during the production of their audits. It also reviews some examples of best practice in relation to the design and content of the audit documents themselves.
Background research
than outlining requirements also lead to a good degree of variation within the audit documents (this was also found by the Pathfinder Sites Report9); an issue that is dealt with later in this paper. The recent Home Office toolkit deals with levels of sophistication ranging from simple cross-tabulation of data to multivariate and time series analyses; but usefully makes distinctions between the most basic audits and more ambitious ventures (referred to as ‘Gold level’ audits).
To date, there have been a small number of reviews of the audits and strategies produced by various crime and disorder partnerships in 1999, including a national review conducted by the Home Office10 and a review of these in the north east region conducted by the Government Office for the North-East11. The Home Office review, undertaken by Phillips et al., examined the audit documents themselves, rather than consulting with the partnerships over their experiences with the auditing process. Results from the study found that:
• the audits tended to use more data than purely that relating to crime and disorder (with 91% of the sample examined using six or more data sets);
• the majority used over one year's worth of data;
• most had produced incident rates as well as raw counts;
• less than half the audits undertook crime mapping of some description; and
• the majority of audits benchmarked their crime and disorder problems against county and national trends12.
on an examination of the documentation and the author's meetings with crime and disorder partnerships. This review reports:
• A lack of information setting baselines against which progress can be measured; • A reluctance to name areas of high fear of crime due to possible stigmatisation; • A lack of benchmarking to county and national figures; and
• A lack of suggested actions by which to address the priority issues raised13.
These reviews give some indication of the types of information and analysis undertaken in the production of audits; they also raise the issue of how the audits vary by region. However, in order to find out more about some of the issues involved in crime and disorder auditing it is important to learn more about the actual process of producing an audit. To identify the importance of the way the partnerships work, the way they are staffed and funded and the levels of skills of the staff involved, it is essential to liase with the partnerships directly. There have been some reviews of the auditing process but these have focused on a small number of auditing teams; Tierney's review14 focused on eight partnerships in one county in the North of England and the Pathfinder Sites Report concentrated on 13 partnerships. There is a need to collect information from a wider sample in order to produce results that are more typical of the average partnership. Therefore, the research reported in this paper uses information from a postal survey of 66 crime and disorder partnerships.
the type of mapping, analysis, consultation and data structure used for a number of example audits that are available for viewing on the internet. However, the review does not search systematically through a number of audit documents to distil particular examples of best practice with respect to audit design and content. This paper aims to identify such examples.
Research aim and methodology
During the summer of 2000, the University of Liverpool initiated a research project in order to take stock of how the audit exercise was handled in the north west and north east regions of England. The primary aim of the study was to establish what was best practice, paying particular attention to management arrangements, methods for engaging the public and the handling of data issues, as well as the design of the audits.
The second element of the research involved collecting Crime and Disorder Audits from all partnerships in the two regions and undertaking an analysis of their design and content. This analysis highlighted best practice on different aspects of the documents including accessibility to the public and sophistication of analysis.
The next section will go on to report the findings of the in-depth survey. The paper will then describe the elements of best practice that were gleaned from the audit document analysis.
Results from the survey
The survey of the partnerships focused on three main aspects of the Audit production process. The first aspect was in relation to the types of problems encountered in producing the audit and it looked at whether problems were experienced regarding organisational factors, data sources and data analysis. The second aspect, which was examined, was in relation to the level of skills amongst staff involved. The third aspect of the survey queried the types of public involvement used to inform the audits and the way in which the documents were disseminated.
Producing the Audit
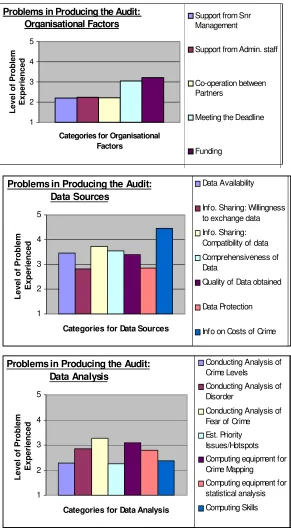
which problems were experienced in relation to each of the factors during the production of the audits. On a scale of 1 to 5, ‘1’ indicates that on average no problem was experienced, whilst ‘5’ implies that this factor was a serious problem.
FIGURE 1 ABOUT HERE
The greatest problems experienced associated with data sources were information on costs of crime and compatibility of data obtained, as in many cases data came from a variety of different sources. Other problems were in relation to comprehensiveness, availability and quality of data obtained.
Data analysis problems were mostly associated with conducting analysis of fear of crime and accessing suitable computer software or equipment for crime mapping. A large majority of local authorities felt that no problems were experienced in relation to conducting analysis of local crime levels, establishing priority issues and hotspots, and computing skills. Problems with meeting the audit deadline, set by the Home Office, were split amongst the respondents, with half stating it was not a problem and the other half claiming that it was a significant problem.
Under a third of local authorities had a separate community safety budget. This may help explain why funding ranked seventh out of a list of nineteen most problematic aspects in producing the audits. For the remaining two thirds, the most popular method of funding was by absorbing the costs within existing budgets. The least popular method was by top slicing budgets from other programmes. Over half of local authorities do not intend to alter the funding arrangements from those adopted in the last round of audits. Within this group, half intend to retain their community safety budget whilst the other half intend to keep absorbing the costs through existing budgets. In contrast, those local authorities planning to make changes to the way the audits are funded, intend to move from absorbing costs from existing budgets to setting up a separate community safety budget. No local authorities with separate budgets intend to change funding arrangements next time round, except to get contributions from other partners.
Staff and Skills
In general most local authorities were inclined to have at least one full time or part time permanent member of staff involved in the process. In relation to skill levels during the production of the last round of audits, Figure 2 illustrates the areas in which skills were felt to be most lacking. From this figure, it can be seen that mapping, monitoring and evaluation, and survey design were the three areas where skills levels were weakest. In contrast, skill levels were felt to be adequate regarding report writing and management of the audit process.
FIGURE 2 ABOUT HERE
On all but one of the various skills, local authorities with a large number of staff available for crime and disorder auditing (i.e. 2 or more) felt on average that their staff were more skilled than authorities with fewer staff. In particular, they were significantly more skilled in project management and partnership development/ management (t=1.703; p<0.05; t=1.822; p<0.04 respectively). Additional staffing also appeared to reduce the number of problems associated with the production of the audit. All organisational and data issues in audit production were perceived to be less of a problem for local authorities with two or more dedicated staff for auditing.
A further analysis looked at whether local authorities with separate budgets considered their staff to be more skilled at various tasks than those without. Skill levels appeared to be very similar for those with and without budgets, with the exception of skills in mapping and the use of GIS in which staff in authorities with separate budgets were significantly more skilled (t=1.754; p<0.044).
In terms of current skill levels, it was felt that these were adequate in relation to partnership development and management, as well as community consultation. Skill levels were currently felt to be weakest regarding mapping and the use of GIS, design and execution of surveys, and monitoring and evaluation techniques. It is interesting to note that those skills mentioned previously, which were felt to be lacking during the audit process, are still very much lacking today.
For over 70 per cent of local authorities, the greatest priorities in terms of the skills needed for producing audits are statistical analysis of data, community consultation and liaison, and partnership development and management.
Public Involvement
The results demonstrated differences in relation to the types of public involvement used to inform the content of the audit and those used in obtaining feedback from the audit. To inform the audit, over 60 per cent of local authorities engaged in residents’ surveys, public perception surveys and public meetings. Least popular for informing the audits were victimisation and focus group surveys.
Public consultation after the audit in order to obtain feedback on its findings (and hence inform the crime and disorder strategy) was practised more widely. About 80 per cent of local authorities undertook a survey of voluntary organisations. A similar proportion held public meetings. Approximately 60 per cent used police community liaison panels to consult, whilst a further 60 per cent carried out residents’ surveys.
Respondents were then asked to state which form of public involvement and consultation worked best for them. This question produced quite an array of answers but some methods were favoured more than others. In general, it was found that to inform the content of the audit, residents’ surveys, in the form of questionnaires and public perception surveys were perceived to be best, followed by holding meetings with community organisations. To obtain feedback from the audit, the most successful method was regarded as public meetings, which was followed by residents’ surveys through responding to newspaper advertising or even a hotline number in one case.
was 75,000. This illustrates the great variation in the effort that local authorities went to in order to disseminate their findings. The same can be said about leaflets, where some authorities sent none at all and others dispatched up to 125,000. The most popular destination for the publications was public services and voluntary organisations, to whom over 80 per cent of local authorities distributed their audits. This is followed by resident groups and private businesses. Least popular was sending the documents or summaries to universities/colleges. A significant number of local authorities tried to disperse the audit findings to the general public through the media, especially via free local newspapers and through leaving leaflets in public places, such as bus stations and libraries.
The Usefulness of the Audits
Crime and Disorder auditing teams were asked questions concerning the use of the audit documents in relation to ten anticipated roles or functions that the audits may perform.
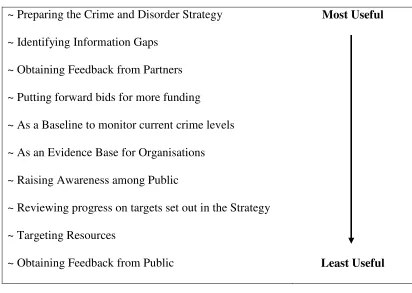
Figure 3 shows the different functions of the audits ranked according to how much they were facilitated by the audit documents. Identifying information gaps and preparing the Crime and Disorder Strategy were tasks that were primarily aided by the document. A particularly pertinent finding was that the audit document was seen to be least useful in obtaining feedback from the public. This is interesting considering that a large majority of local authorities felt that community consultation and liaison skills were adequate, as has already been stated above.
FIGURE 3 ABOUT HERE
of the audits. Local authorities used up to nine different forms of consultation in order to inform the audits and obtain feedback on them. The local authorities were split into two groups; those that used five or less forms and those that used more than five forms to inform the content of the audit. Interestingly, although those that had used five or more types of consultation for the audits found them slightly more useful in many aspects (e.g. obtaining feedback; preparing and reviewing strategies and targeting resources) none of the differences in perceived usefulness reached significance.
A similar exercise was undertaken for those that had used four or less and five or more types of consultation to obtain feedback from the audit. In this case, it was found that if more forms of consultation had been used, the audits were found more useful in all aspects. In addition, several of the differences reached significance; those undertaking more types of consultation found audits more useful in preparing the Crime and Disorder strategy (t=3.163; p<0.03); in reviewing progress on targets set out in the strategy (t=2.382; p<0.023) and in putting forward bids for further funding (t=2.039; p<0.049). These results seem to suggest, therefore, that extensive consultation is most useful at the post-audit stage, when the audit document is being used to inform the strategy. It is less important to undertake consultation at the pre-audit stage.
those that had sent out more than this. They were also classified according to the number of summary documents that were sent out. This separated authorities that had sent out 2000 or more summary documents from those that had sent out less than this. The analysis found that authorities that sent out more audit documents found them more useful in obtaining feedback from the public; raising awareness among the public and for targeting crime prevention resources, although it was only the last of these in which the differences reached significance (t=2.585; p<0.014). A similar analysis with authorities sending out summary documents found that those sending out more summary documents found the audits slightly more useful in all aspects, except none of the differences reached statistical significance.
Future Concerns with Crime Auditing
Many teams hope that next time improved engagement with the public will take place, especially with hard to reach groups, such as victims and offenders. It was suggested that planning earlier may make this much more feasible for the next round of audits.
More funding and sharing of costs was felt to be an important aspect in carrying out the audits next time. There was also mention of the need for better training and guidance, especially with regards to ‘Best Value’ and the implications of Section 17 of the Crime and Disorder Act.
Design of Crime and Disorder Audit documents
Audit documents acquired for the 66 local authorities in the north west and north east of England were systematically assessed on a number of criteria concerned with the design and the content of the audits. The following criteria were included in this analysis:
1. The degree to which the contents of the documents were accessible to the public and the way in which public consultation was handled;
2. The extent to which and the way in which the approach taken by the audit was systematic in terms of reporting figures for different types of crime or different areas and/or units of analysis;
The following paragraphs describe elements of best practice identified in the audit documents using the above-mentioned criteria on audit content and design.
Public accessibility/consultation
The audits that were best from the point of view of being accessible to the public were those that provided clear information on the areas and localities for which statistics on crime and disorder were being presented.For example, Copeland's audit used a context setting map that clearly indicated the towns that fell into the different areas analysed. This is important because residents are often unaware of the administrative areas that they reside within. It then went on to display three graphs that split crime down by category across the whole of the region, by total crime count for individual wards, and by area and crime type for three broad sub-regions.
An effective tactic adopted by South Ribble in their audit was to limit the amount of information placed on each page, use bold colours to keep the document interesting and summarise the most important information in eye-catching boxes in the right hand margin (these acted as ‘headlines’). Other more accessible audits involved the public by thanking them for previous involvements (“ What you’ve already told us”) and encouraging them to keep feeding back by producing a simple form with a minimal number of questions and even offering to enter respondents into a free competition (Stockton).
Systematic Approaches
most commonly used units of analysis were local authority wards and police beats. The more comprehensive audits gave general district level tables but also gave systematic statistics on sub-areas of the district or on sub-categories of crime. Some examples of these included:
• Tables that gave crime counts and rates separated out by crime category for all the
wards. For instance, Fylde had separate pages summarising burglary in a dwelling for all wards and burglary other than a dwelling for all wards.
• Separate sections for each crime type that identified the ‘hotspot’ beats for that
crime type and then produced social and economic profiles for those beats (Manchester).
• Separate pages for each beat or sub-area which gives a complete crime profile for
that beat and other contextual and local information (for instance South Lakeland does this for beats).
Analysis Techniques
There was some evidence of innovative types of analysis within the audit documents. These included:
• Bar charts showing the percentage change in crime by category between two
one-year periods produced for the Tameside Audit. The chart compared the change in each type of crime within the district (Tameside) to that within the rest of the county (Greater Manchester); that within England and Wales as a whole and that identified by the British Crime Survey
• Benchmarking of crime problems against the national average. For instance, St
score of 100 if they were the same as the national average, over 100 if they were above the national average and less than 100 if they were below it.
• Cross tabulations of changes in the crime rate over time by ward and by category.
Such tables allow the reader to see simultaneously whether a particular ward is generally increasing in its level of vulnerability and whether a particular crime type is becoming problematic in general across the wards (Sefton).
• Time of the day and day of the week analysis. For instance, the Carlisle audit found
that certain types of crime were particular problems on certain days of the week or at certain times of the day.
• Fear of crime analysis. The audit in Bury compared the results of a fear of
victimisation survey with actual levels of crime to identify whether particular crime and disorder incidents were disproportionately feared by the public in comparison to the actual level of risk.
Mapping
There was major variation in terms of the type and quality of mapping used in the various audits. Some good examples were:
• Maps that set the area context very well. Copeland devotes a page of its audit to
locating the borough in relation to the rest of England and Wales and to the rest of the Lake District and clearly located the major and minor towns of the borough
• Thematic maps that show high crime areas for the sub-areas used in the analysis for
thermo-mapping techniques can be used where the colour gets progressively lighter or darker as the number of incidents or the crime rate increases (e.g. Preston).
• Some areas (e.g. Bury) integrated their mapping with a systematic approach to crime
categories. A small map of the area was produced for each category of crime and disorder
• Another approach combines spatial location and crime type analysis. For each town,
a bar chart is drawn on the map that shows crime rates or counts for a number of different crime types (e.g. Allerdale)
• Using different sized symbols on a map can give an indication of the size of that
problem in a particular area. If the symbol used is a pie chart, the map can also indicate the proportion of the crime that falls into different categories as well as the overall size of the problem. For instance, Sefton used proportional pie charts to show the extent and share of the crime in the area that was property crime and that was crime against the person.
Data Sets
• The number of void properties over time in different wards. This could be linked in
to the criminogenics of the particular ward. Void properties can be linked to areas of high disorder, vandalism and criminal damage (Bury).
• Carlisle used a wide variety of data sets including information on littering by ward,
on inter-neighbour noise complaints and on costs of malicious fires in schools.
• There was very little information on the costs of crime. Audits that attempted this in
any way tended to use information from the local crime recording system. For example, Fylde produce aggregate figures for the cost of dwelling burglary from the local system for two one year periods to examine whether burglary costs were increasing or decreasing over time.
• Manchester addressed the issue of the stability of areas over time. They used
information on council tax benefit and housing turnover to categorise areas in terms of the stability of the residential population. This was then cross-referenced with information on hotspots to assess whether hotspots of certain types of crime occurred in high or low stability areas.
problem. Furthermore, the best practice subset found the audits more useful in all aspects than the general sample as a whole.
Discussion
The experience of producing the first round of audits has proven to be an important learning experience for all crime and disorder teams. The research described in this article has highlighted a number of interesting findings, which can potentially inform better practice in future auditing. Key findings include:
- Separate community safety budgets provide a number of advantages in terms of producing the audit;
- Adequate numbers of staff are equally important for the audit production process. In addition, this factor can also ensure that a better range of skills are brought to the team;
- Data sources and quality do not appear to be affected one way or the other by budgets or staff numbers, and therefore, special effort is required to improve these for future audits;
- Even though partnerships feel that they have adequate consultation skills, public consultation and involvement are not exploited to their full potential in the audit production process;
- Consultation appears to be most useful in the production of crime and disorder strategies;
The great variation that occurred within the audit documents, as well as within the actual process of their production can be largely attributed to the non-prescriptive stance of the Home Office Guidance, which was widely used by most audit teams. Such a stance has had distinct advantages and disadvantages. On the positive side, the variation in the audit process and documents means that it is possible to determine which elements have worked well and effectively and which elements have not worked so well. By means of 'trial and error' best practice can be picked out, which in turn can be used to inform other crime and disorder partnerships across the country. Another benefit that can be attributed to allowing variation in the audits is that crime and disorder partnerships have been free to include, what they might regard as relevant and important information for audits in that particular local area. This adds a local dimension, which not only demonstrates the unique context of the area, but also reflects the partnership structure that has developed in the area. The agencies involved in the partnership will say a lot about the issues that are highlighted and the initiatives that are implemented to try and deal with them. Where particularly successful or innovative, this again can be used to feed into best practice.
monitor the effectiveness of targets identified in the strategies. The review of the strategies is not likely to be made any easier as a result.
It is quite likely that the next round of audits will be influenced by elements of best practice highlighted within the various reviews published. The extent to which this will be the case remains to be seen however. It will be interesting to observe whether there will be a convergence between the audit documents and whether this will eventually lead to a widely accepted ‘standardised audit’ in the future in terms of content, analysis and design. A consequence of finding such a formula might be a decrease in the amount of innovation and creativity in the audit process.
There are advantages in having this type of standardisation however, and this has already been observed from the last round, where within counties, there was evidence that districts were using the same resources and datasets, which enabled comparisons across districts and between audits. The ability to put district level problems into a county context offers several benefits. Firstly, it might offer more persuasive evidence in attracting funding to combat local problems. Secondly, it might be used to begin to address problems that cross administrative (district) boundaries. Finally, it may assist in the formation of ‘meta-partnerships’ with practitioners from various districts who share common concerns and interests networking and meeting to discuss potential solutions.
Service (MIS) played a key role in terms of providing and cleaning much needed data for the audit documents at the county level. Results from the survey described earlier in this paper indicate that on average, the districts of Merseyside had less problems associated with data issues during the production of the audits than the general sample, which indicates the benefits obtained from having an overseeing body to deal with data issues. An example of county-wide co-ordination for the current audits is the MADE (Multi-agency data exchange) project taking place in Lancashire. A common data set, with a user-friendly front end has been developed which enables users to produce statistics for their own districts and compare them to other districts or the county as a whole. Similar arrangements are in place elsewhere (e.g. in the West Midlands).
Figure 1: Problems in producing the audits: organisational factors, data sources and data analysis (based on 41 responses).
1= No problem experienced, 5= Serious problem.
Problems in Producing the Audit: Organisational Factors 1 2 3 4 5
Categories for Organisational Factors L e v e l o f Pr o b le m Ex p e ri e n c e d
Support from Snr Management
Support from Admin. staff
Co-operation between Partners
Meeting the Deadline
Funding
Problems in Producing the Audit: Data Sources 1 2 3 4 5
Categories for Data Sources
L e v e l o f P ro b le m E x p e ri e n c e d Data Availability
Info. Sharing: Willingness to exchange data Info. Sharing: Compatibility of data
Comprehensiveness of Data
Quality of Data obtained
Data Protection
Info on Costs of Crime
Problems in Producing the Audit: Data Analysis 1 2 3 4 5
Categories for Data Analysis
L e v e l o f P ro b le m E x p e ri e n c e d
Conducting Analysis of Crime Levels
Conducting Analysis of Disorder
Figure 2:Percentage lacking skills during the production of the Audits.
P ercentage L ackin g S kills during the P ro ductio n of the Au dits
0 10 20 30 40 50 60
Ca te gorie s of S kills
%
L
a
c
k
in
g
S
k
il
ls
M anagem ent
S tatistic al A naly s is
M apping
Com m unity Consultation
S urvey s
Report W riting
Des igning A udit
Figure 3: The utility of the audit document for different purposes.
~ Preparing the Crime and Disorder Strategy Most Useful
~ Identifying Information Gaps ~ Obtaining Feedback from Partners ~ Putting forward bids for more funding
~ As a Baseline to monitor current crime levels ~ As an Evidence Base for Organisations ~ Raising Awareness among Public
~ Reviewing progress on targets set out in the Strategy ~ Targeting Resources
Notes
1
Respectively, Research Associate, Research Assistant and Reader, Department of Civic Design,
Abercromby Square, University of Liverpool, L69 3BX; email: [email protected].
We would like to express our thanks to all those who co-operated with us during the research, especially
in completing the survey and sending audit documents.
2
See Home Office, (1998), The Crime and Disorder Act: Guidance on Statutory Crime and Disorder
Partnerships. Chapter Three: Auditing Crime and Disorder, London: Home Office. This document is
also available on: http://www.homeoffice.gov.uk/cdact/ cdaguid.htm. See also M. Hough and N. Tilley
(1998), Auditing Crime and Disorder: Guidance for Local Partnerships, Police Research Group, Crime
Detection and Prevention Series, Paper 91. London: Home Office.
3
See Audit Commission (1999), Safety in Numbers: Promoting Community Safety, London: Audit
Commission.
4
National Association for the Care and Resettlement of Offenders (NACRO), (1999), Crime and
Disorder Auditing, London: NACRO.
5
Home Office, (2001), Partnerships Toolkit: Auditing Chapter, London: Home Office.
6
See F. Hayes, (1999), A Report on the First Audits and Strategies in the North East Region, Newcastle
upon Tyne: Government Office for the North East.
7
Home Office, (1999), Statutory Partnerships: Pathfinder Sites Report, London: Home Office. Also
available on http://www.homeoffice.gov.uk/cdact/pathfind.pdf.
8
See J. Tierney, (2001), 'Audits of Crime and Disorder: Some Lessons from Research' in Crime
Prevention and Community Safety: An International Journal, 3(2), pp. 7-17
9
Home Office (1999), op cit.
10
C. Phillips, M. Considine and R. Lewis (2000), A Review of Audits and Strategies produced by Crime
and Disorder Partnerships in 1999, London: Home Office. Also available on: http://www.homeoffice.
gov.uk/rds/prgpdfs/brf800.pdf.
11
13
F. Hayes, (1999), op cit.
14
J. Tierney, (2001), op cit.
15
D. Gilling, (2000), 'Surfing the Crime Net: Local Crime and Disorder Strategies in the UK' in Crime
Prevention and Community Safety: An International Journal, 2(3), pp. 61-64.
16
A statistical test with a 'p value' of less than 0.05 is said to be a significant result, as the t value shows
that difference between the mean scores on the variable for the two groups being considered is very