Optimized Structure for Facial Action Unit Relationship
Using Bayesian Network
Yee Koon Loh
*, Shahrel A. Suandi
Intelligent Biometric Group, School of Electrical and Electronic Engineering, Engineering Campus, Universiti Sains Malaysia, Pulau Pinang, Malaysia
*Corresponding Author: [email protected]
Copyright © 2014 Horizon Research Publishing All rights reserved.
Abstract
Facial expression recognition has been a very important task for human-computer interactions. Computer vision techniques have been much employed to get the automated recognition of facial expression. Facial Action Coding System has best described on facial expression, which includes 46 action units that involve facial muscle movements. In this paper, the relationships between Action Units are modeled using Bayesian Network structure. Action Units relationship and modeling are explained, and the learning algorithms for Bayesian Network structure are discussed. The aim of this work is to get the optimized structure to best explain the relationships of AUs based on two AU-coded databases. The relationships among AUs are important for further facial expression recognition. Experiments demonstrate that a prior network is essential to start up and ease the searching process. Due to the complexity of the possible structures, constraints are applied to simplify the work. Bayesian Network parameters are also learned from two databases for different structures to do Bayesian Network inference and classification based on the data set. Average recognition rate for each AU is illustrated, and the overall recognition performance is analyzed to get the optimized structure to best describe the AU relationship.Keywords
Structure learning, Bayesian Network, Facial Action Unit1. Introduction
Facial expression recognition has been a very active topic in research in recent years. It is a very challenging task due to a lot of difficulties and limitations. Face is one’s identity and unique for everyone, and it changes for different age. Computer vision techniques have been widely used to recognize facial expression from images, video but due to pose, illuminations and complicated combination of facial expression make the recognition task become very challenging. Ekman and Keltner developed Facial Action Coding System (FACS) [1] which describes facial
expressions in terms of Action Units (AUs). FACS consists of 46 AUs which are primarily related to facial muscle movements. Action Unit has been used widely in recent research especially regarding facial expression recognition. However, this system requires human to go through the learning and training processes to become expert in coding FACS. FACS is developed for coding by hand, using human experts. Trained experts, who make perceptual judgment of video sequences, often frame by frame, currently perform this process. The limitation is that the system requires approximately 100 hours to train a person to make these judgments reliably and pass a standardized test for its reliability [2].
Computer vision techniques have been utilized to automate the action unit. However, due to richness of facial expressions, it is important to learn the relationships between AUs. It is hard to have only one AU involved in a facial expression. The AUs are related to each other as it involves the muscles of human face. In this paper, the relationship of 14 main AUs that were involved in 6 basic expressions (anger, disgust, fear, happiness, sadness, surprise) as described by FACS are studied and modeled using Bayesian Network (BN).
2. Related Works
Pitas et. al [5] proposed to use shape and texture information for facial expression recognition. The method is performed by fusing the texture and the shape information extracted from a video sequence using a subspace representation method and an Euclidean embedding in combination with a SVMs system, respectively. Mahoor et. Al[6] presented sparse learning approach for AU combination classification. Gabor features were extracted at the location of facial landmark points extracted using AAM to represent facial images. Then, a dictionary was developed to recognize the combination of facial AUs using L1-norm minimization.
A system to recognize facial action unit by exploiting their semantic and dynamic relationships using Dynamic Bayesian Network (DBN) is proposed in [7]. Probabilistic relationships among various AUs are presented and temporal changes in facial action units are accounted. Computer vision techniques are employed to obtain AU measurements. Such AU measurements are then applied to the DBN for inferring various AUs. However, the temporal links between AUs are limited as not temporal links for all target AUs.
3. Action Unit Relationship
The relationships between AUs are learned from AU coded database by considering their co-absence and co-occurence in an image. Hence the probabilistic relationship among AUs are computed and an initial structure that represents the relationships between AUs are learned in BN. Best structure is then found by taking the best score that fits the database. In this section, the databases used in this work are presented. Then, the AU relationship modeling and the learning algorithm are discussed.
3.1. Database
Two databases are used to learn the relationship of AUs using Bayesian Network. The first database used in our work is the Cohn-Kanade DFAT-504 database [8], which consists of sequences of images of more than 100 subjects. Facial behavior was recorded from subjects covering different races, ages and genders. Each sequence begins with a neutral expression and proceeds to a peak expression. The peak expression for each sequence is in fully FACS coded and given an emotion label. The first image of the sequence which reflect the neutral state of the subject and the last image of the image sequence that shows the peak expression of the subject are used to train the system.
The second database is RPI ISL Facial Expression database (RIFE)[7]. This database consists of 42 image sequences from 10 subjects displaying facial expressions undergoing a neutral-apex-neutral evolution. 38 image sequences from 6 subjects have been used for training in this
work while the remaining images are used for testing purpose in our future work. The ISL database is coded into AU labels frame by frame.
3.2. AU Relationship Modeling
A BN is a directed acyclic graph (DAG) that represents a joint probability distribution among a set of variables. BN structure is used to represent knowledge about uncertain variables computational architecture for computing the impact of evidence on beliefs. Variables are depicted as nodes and arcs represent probabilistic dependence between variables. Computing posterior probabilities given evidence about selected nodes exploits probabilistic independence for efficient computation.
In this case, our variables are the AUs, which are denoted as nodes in the BN structure. The directed arcs denote the conditional dependency among AUs, which can be characterized by conditional probability table (CPT). An initial BN structure is derived by analyzing the AU relationships in AU-coded images from two facial expression databases as described earlier, similar to work done in [7].
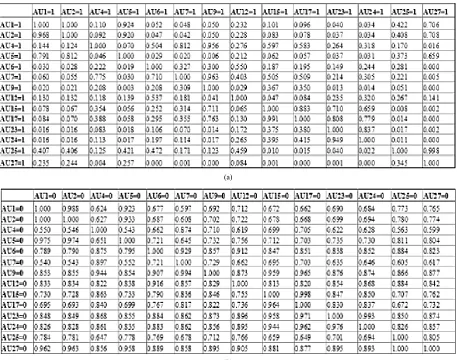
The relationships among AUs are learned from their co-occurrence table in Table 1(a) and co-absence table in Table 1(b). The co-occurrence table shows the probability of two AUs occur together in one image regardless of presence of other AUs. The co-absence table denotes both AUs in the pair of AUs are not present in the image. Each entry ai,j in Table I(a) represents the conditional probability P(𝐴𝐴𝐴𝐴𝑖𝑖= 1|𝐴𝐴𝐴𝐴𝑗𝑗= 1) whereas each entry in Table I(b) represents the conditional probability P(𝐴𝐴𝐴𝐴𝑖𝑖= 0|𝐴𝐴𝐴𝐴𝑗𝑗= 0) . The probability is a counting process for the AUs involved in the facial images from both databases[7]. After both tables are constructed, an initial BN structure is obtained.
3.3. Structure Learning Algorithm
Table 1. (a) Co-occurrence (b) Co-absence Table
(a)
(b)
The structure learning algorithm determines the score of the structure and gets the best structure based on the data training. The score we use is Bayesian score. The score-based method is as follow: a) Define a quality metric to maximize the score, b) Use greedy search to determine the next best arc to add, and c) Stop when the metric does not increase by adding an arc. The Bayesian score that has been used in our model selection is defined in Eq.(1)
𝑆𝑆𝑆𝑆𝑆𝑆𝑆𝑆𝑆𝑆(𝐵𝐵) = log𝑝𝑝(𝐷𝐷,𝐵𝐵) = log𝑝𝑝(𝐷𝐷|𝐵𝐵) + log𝑝𝑝(𝐵𝐵) (1) where, B denotes network structure and D denotes a database of sampling data. The first term is the log likelihood and the second term is the log prior probability of the structure B. The log likelihood gives information about the database, which commonly adds a penalty term on the number of arcs. For a large database, the Bayesian information criterion (BIC)[10] has been used to compute the log likelihood.
Next, a network structure with highest score needs to be identified by a searching algorithm. Greedy hill climbing [11] search algorithm is used in our work. The algorithm starts with a given network, and at each iteration, makes evaluation on all possible changes. After that, it continues to move to the neighbor that has the highest score and reiterate; if no neighbors have higher score than the current point, the
algorithm stops. A pseudo-code for algorithm is shown in Fig. 1
4. Experimental Results
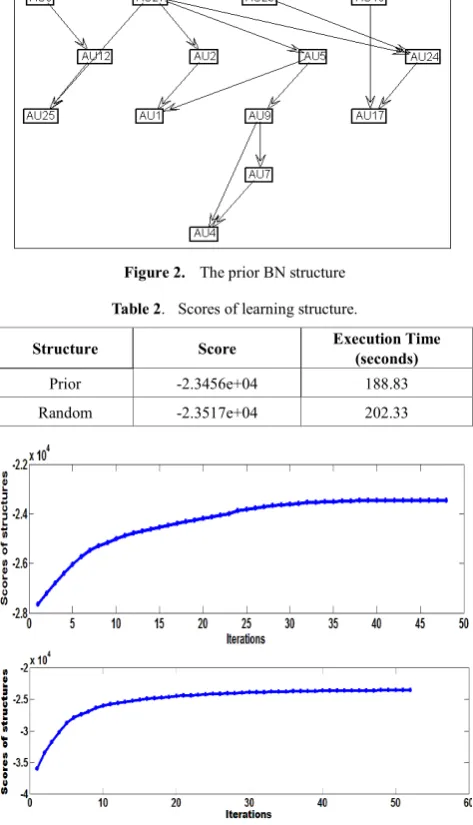
4.1. Learned Structures [image:4.595.64.289.311.449.2]Our focus in this paper is to learn a BN structure to best modeling the relationships among AUs. An initial BN structure is obtained after analyzing the relationships of AUs as shown in Fig. 2. Besides that, we also learn from a random constructed structure. Table 2 shows the scores of both learning structures using greedy hill-climbing algorithm. The final score from predefined prior structure is slightly higher than randomly constructed structure. The execution time for prior structure is also shorter compared to randomly constructed structure. Besides that, the scores of structures after each iteration are demonstrated in Fig. 3. It can be seen that the starting scores for prior structure is much higher than the randomly constructed structure. Hence, it is clearly shown that the manually constructed structure is a very good starting point to find an appropriate structure that fits the training data as well.
[image:4.595.60.297.320.733.2]Figure 2. The prior BN structure
Table 2. Scores of learning structure.
Structure Score Execution Time (seconds)
Prior -2.3456e+04 188.83
Random -2.3517e+04 202.33
Figure 3. Scores of learning after iterations starting from (a)prior
(b)randomly constructed structure.
Table 3. Scores of learning structure with constraints on maximum of
number of parents nodes.
Max no. of parents
for each node Score Execution Time (seconds)
2 -2.5013e+04 81.38
3 -2.4412+04 101.55
4 -2.3800+04 187.69
5 -2.3597e+04 198.14
6 -2.3558e+04 201.30
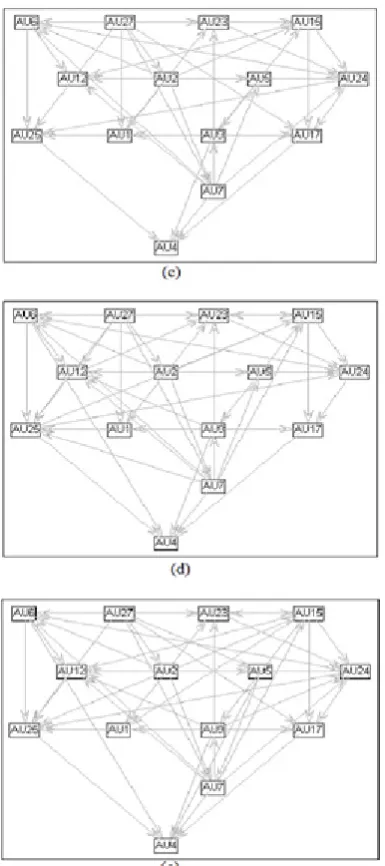
[image:4.595.334.528.428.710.2]Figure 4. Learned structure with constraints. (a)-(e) Allowing maximum 2 to 6 best parents for each node, respectively.
4.2. Bayesian Network Inference and Classification Performance
To further analyze the 5 structures in previous experiment, we also learn the parameters of the five structures in Fig. 4 based on two AU-coded databases. The two databases have been divided into three sets, the training data, the testing data and observed data. The ratio is 2:1:1. The observed data is used as evidence to do BN inference on the testing data. Thus, the posterior probability of each AU is inferred from the structures. The probability of the inferred AU decides the presence or absence of AU in the image and thus classification of AU is performed. Average recognition rate for each AU is shown in Fig. 5(a). The average recognition rate is defined as the percent of examples recognized correctly. Overlapping of the marker in the figure shows that the average recognition rate for some AUs have not much
changes for different structures. It shows that the complexity of structures has no significant effect on the AU recognition. Fig.5(b) shows the overall recognition rate for all AU for learned structures. It shows that with increasing complexity of structure, the recognition rate is slightly better. In assessing the classification result, ROC analysis is done and the overall of averaged area under curve (AUC) is presented in Fig. 6.
(a)
[image:5.595.321.553.174.522.2](b)
Figure 5. (a) Average recognition rate for each AUs and (b) Overall
recognition rate
[image:5.595.313.550.560.702.2]5. Conclusions
The AUs relationships are studied and learned using BN in this work to get an optimized structure to describe the relationship among AU. A prior structure constructed from two databases showed better result than a randomly constructed structure. It gives us rough picture of how AUs are related to each other and it is further confirmed by learning the structure. Considering the complexity and execution time for the learned structure, constraints on number of parents for each node are applied. Bayesian Network inference and classification for datasets are done for comparison of 5 structures with increasing complexity network. Scores of structures and classification results show that recognition rate is slightly increasing with increasing complexity of the 5 structures. However, the difference is not much, but the execution time for structure can be doubled by comparing structure 1 and 3. Therefore, the structure 1 which allows maximum best 2 parents for each node is favored. An optimized AU structure that represents the relationship among 14 AUs are important for further facial expression application.
Acknowledgements
This research was funded by Universiti Sains Malaysia Research University Grant (RUI), No.1001/PELECT/81420 8.
REFERENCES
[1] P. Ekman and W. Friesen, “Facial Action Coding System: A Technique for the Measurement of Facial Movement. Consulting Psychologists Press, Palo Alto, CA, 1978. [2] Bartlett, Marian Stewart, et al. "Automatic recognition of
facial actions in spontaneous expressions." Journal of Multimedia 1.6 (2006): 22-35.
[3] Lonare, Ashish, and Shweta V. Jain. “A Survey on Facial Expression Analysis for Emotion Recognition.” International Journal of Advanced Research in Computer and
Communication Engineering,Vol. 2, Issue 12, 2013.
[4] Khatri, Nidhi N., Zankhana H. Shah, and Samip A. Patel. “Facial Expression Recognition: A Survey.” International Journal of Computer Science and Information Technologies, Vol. 5 (1) , pp.149-152, 2014.
[5] Kotsia, Irene, Stefanos Zafeiriou, and Ioannis Pitas. "Texture and shape information fusion for facial expression and facial action unit recognition."Pattern Recognition 41.3 (2008): 833-851.
[6] Mahoor, Mohammad H., et al. "Facial action unit recognition with sparse representation." Automatic Face & Gesture Recognition and Workshops (FG 2011), 2011 IEEE International Conference on. IEEE, 2011.
[7] Yan Tong, Wenhui Liao and Qiang Ji, “Facial Action Unit Recognition by Exploiting Their Dynamic and Semantic Relationships”, IEEE Trans. Pattern Analysis and Machine Intelligence, vol. 29, no. 10, October 2007.
[8] Kanade, T., Cohn, J. F., & Tian, Y. (2000). Comprehensive database for facial expression analysis. Proceedings of the Fourth IEEE International Conference on Automatic Face and Gesture Recognition (FG'00), Grenoble, France, 46-53. [9] Koller, Daphne, and Nir Friedman. Probabilistic graphical
models: principles and techniques. MIT press, 2009. [10] Schwarz, Gideon. "Estimating the dimension of a model."
The annals of statistics 6.2 (1978): 461-464.
[11] Cruz-Ramírez, Nicandro, et al. "How good are the Bayesian information criterion and the minimum description length principle for model selection? A Bayesian network analysis." MICAI 2006: Advances in Artificial Intelligence. Springer Berlin Heidelberg, 2006. 494-504.
[12] P. Ekman and E.L. Rosenberg, “What the Face Reveals:Basic and Applied Studies of Spontaneous Expression using the Facial Action Coding System (FACS). 2nd Edition. Oxford University Press, New York, 2005.
[13] Sebe, Nicu, et al. "Authentic facial expression analysis." Image and Vision Computing 25.12 (2007): 1856-1863. [14] Kotsia, Irene, and Ioannis Pitas. "Facial expression
recognition in image sequences using geometric deformation features and support vector machines."Image Processing, IEEE Transactions on 16.1 (2007): 172-187.