How Does Asset Structure Correlate with Capital
Structure? – Cross-Industry and Cross-Size Analysis of
the EU Countries
Julia Koralun-Bereźnicka
Faculty of Management, University of Gdańsk, Poland *Corresponding Author: [email protected]
Copyright © 2013 Horizon Research Publishing All rights reserved.
Abstract
Assets structure has been widely reported bycorporate finance literature to significantly affect financial structure of firms. However, according to the capital structure theories and empirical research in the field, the direction of the relationship between assets tangibility and capital structure is not obvious. This study aims at verifying the significance and the direction of the way assets structure correlates with capital structure on a large sample of private firms across 9 EU countries. The correlation between several assets structure ratios and capital structure ratios is examined across countries, industries and size groups of firms in order to find out how the country-specific factors, the industry-specific factors and the factors related to firm size influence this relationship in the period 2000-2010. The data is provided by the BACH-ESD database published by the European Commission. Findings provide evidence that the firm size has relatively the weakest impact on the way assets structure correlate with capital structure. However, both the direction and the significance of the relationship are considerably influenced by country and industry specificity.
Keywords
Capital Structure, Assets Structure, Tangibility, European Union, Country Factor, Industry Factor, Size Effect1. Introduction
Corporate finance literature abounds in both theoretical and empirical research on capital structure determinants. Most of the hitherto analyses aim at examining the significance of factors believed to have impact on corporate financial decisions and thus at verifying certain capital structure theories. The approach adopted in this study is different in several ways. First, it only focuses on a single capital structure determinant, i.e. the asset structure, instead of examining a series of factors. Second, the significance of this factor is verified on a sample of private firms, unlike the majority of studies which use mainly public company data. Finally, the correlation between asset and capital structure is compared across countries, industries and size groups, which
to the author’s knowledge, is the first attempt of this kind of in-depth analysis.
The aim of the study is to verify the significance and identify the direction of the way assets structure correlate with capital structure depending on the country, industry and the firm size. In order to achieve this goal, the correlation between several assets structure ratios and capital structure ratios is examined for the whole data set, as well as in the three cross-sections: across individual countries, industries and size groups. It is supposed to reveal how the country-specific factors, the industry-specific factors and the factors related to firm size influence the relationship in question. Presumably, the asset-capital structure relationship may be susceptible to country specificity, industrial specificity, as well as firm specificity related to its size, which constitutes the hypothesis of the study. The main research questions therefore may be formulated as follows: How does asset structure correlate with capital structure? Does this relationship vary depending on the country, industry and firm size?
The analysis covers a sample of private firms across 9 EU countries, 13 industries and 3 size groups in the period 2000-2010.
2. Review of Literature
Corporate financial choices are affected by a number of factors. One of the more general classifications of these variables is based on the criterion of the economic character of factors, and therefore distinguishes the micro- and macro-economic determinants [1]. The asset structure (tangibility), which has been widely evidenced to significantly affect capital structure, belongs to the first group, and is one of the most frequently cited factors [2-5].
According to the financial literature, the asset structure plays an important role in determining the capital structure [6], although there is no consensus among authors on the direction of the relationship.
case of bankruptcy [8-10].
The liquidation value may also be increased by higher assets liquidity, which is why liquidity is traditionally believed to increase debt capacity [11]. However Weiss and Wruck [12] argue that asset liquidity is a factor reducing, not increasing, a firm’s ability to issue debt securities [13].
The tangibility of assets is also considered as a capital structure determinant according to the agency theory. Rajan and Zingales [14] argued that such assets, by acting as collateral for debt, reduce the risk of agency costs associated with debt incurred by the creditor, and consequently lead to an increase in leverage.
The value of tangible assets is also a factor affecting the capital structure according to the pecking order theory of debt. The empirical verification of this determinant by Frank and Goyal [15] shows that as these assets are pledged as collateral, the larger their share, the higher the leverage.
The collateral value of assets was also found to be an important determinant of the debt ratio by Akhtar [16], who analysed Australian companies. It is argued that companies with higher collateral value of assets have greater access to bank loans compared to the firms dominated by intangible assets. This is due to the reduced risk level of investments and transactions involving assets, which are easily disposable on the market. Consequently, it is also expected that companies operating in the production industry should have higher leverage than service firms [17].
Some other aspects of asset characteristics, such as their
physical features [18], or liquidity [19] have also been empirically proven to considerably affect capital structure.
However, despite the wide empirical evidence for a positive relationship between tangibility of assets and debt [20], there are also some studies, which contradict this common view. For instance, according to Grossman and Hart [21], the monitoring costs of the agency relationship are higher in firms with lower assets tangibility because of the managerial consumption of the perquisites. In order to reduce the opportunistic behaviour of managers, some firms may choose higher debt levels. Therefore, a negative relationship between the assets’ tangibility and financial leverage is expected.
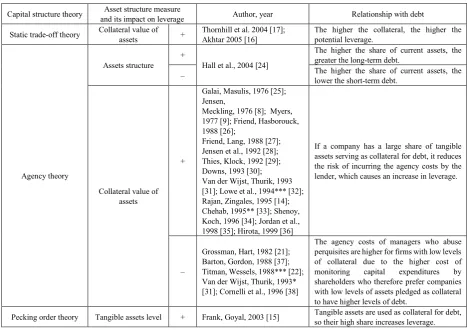
[image:2.595.70.538.413.743.2]These contradictions are best illustrated by the lack of agreement as to the basic facts of two classic studies in this area: by Harris and Raviv [7] and by Titman and Wessels [22]. According to the earlier article [7], the available studies generally agree that leverage increases with the share of fixed assets. However, according to the authors of the competitive study [22], their results do not provide evidence for a correlation between debt ratios and the collateral value of assets. As a result, proponents of the various capital structure theories may choose between the radically differing literature items supporting their views, which for obvious reasons is not satisfactory from the point of view of the theory development [23]. A synthetic summary of the results from previous studies aiming at establishing the relationship between assets structure and leverage are shown in Table 1. Table 1. Assets structure as a determinant of capital structure – review of studies
Capital structure theory and its impact on leverage Asset structure measure Author, year Relationship with debt
Static trade-off theory Collateral value of assets + Thornhill et al. 2004 [17]; Akhtar 2005 [16] The higher the collateral, the higher the potential leverage.
Agency theory
Assets structure + Hall et al., 2004 [24]
The higher the share of current assets, the greater the long-term debt.
– The higher the share of current assets, the lower the short-term debt.
Collateral value of assets
+
Galai, Masulis, 1976 [25];
Jensen,
Meckling, 1976 [8]; Myers, 1977 [9]; Friend, Hasborouck, 1988 [26];
Friend, Lang, 1988 [27]; Jensen et al., 1992 [28]; Thies, Klock,1992 [29]; Downs, 1993 [30]; Van der Wijst, Thurik, 1993 [31]; Lowe et al., 1994*** [32]; Rajan, Zingales, 1995 [14]; Chehab, 1995** [33]; Shenoy, Koch, 1996 [34]; Jordan et al., 1998 [35]; Hirota, 1999 [36]
If a company has a large share of tangible assets serving as collateral for debt, it reduces
the risk of incurring the agency costs by the
lender, which causes an increase in leverage.
–
Grossman, Hart, 1982 [21]; Barton, Gordon, 1988 [37]; Titman, Wessels, 1988*** [22]; Van der Wijst, Thurik, 1993*
[31]; Cornelli et al., 1996 [38]
The agency costs of managers who abuse perquisites are higher for firms with low levels of collateral due to the higher cost of monitoring capital expenditures by shareholders who therefore prefer companies with low levels of assets pledged as collateral to have higher levels of debt.
Pecking order theory Tangible assets level + Frank, Goyal, 2003 [15] Tangible assets are used as collateral for debt, so their high share increases leverage.
2. Data and Methods
The source of the analytical data is the BACH-ESD [39] (Bank for the Accounts of Companies Harmonised - European Sectoral references Database). The database contains 28 financial ratios for non-financial incorporated European companies for nine EU countries: Austria, Belgium, France, Germany, Italy, the Netherlands, Poland, Portugal and Spain.
The ratios used in this study are weighted means and they are differentiated by NACE code (Nomenclature statistique des Activités économiques dans la Communauté Européenne), firm sizes, countries and years. The analysis covers the eleven-year period 2000-2010. The data from more recent years were not included due to a significant number of missing items at the time of the analysis.
[image:3.595.317.548.266.425.2]The analysis involves the capital structure and asset structure ratios in three groups of enterprises: small companies (with a turnover of less than 10 million euro), medium-size companies (with a turnover between 10 million euro and 50 million euro) and large companies (with a turnover in excess of 50 million euro) in thirteen industries. The taxonomy of economic activity by NACE is two-levelled: one-letter level (sections) and two-digit level (divisions). This analysis involves enterprises grouped at the level of section, i.e. thirteen industries. Several industries were excluded from the analysis due to very limited data availability. Table 2 shows the industrial range of the research as well as the three-letter symbols attributed to each industry which are applied in the following parts of the paper.
Table 2. Industrial sections by NACE
NACE Section Symbol
A Agriculture, forestry and fishing AGR
B Mining and quarrying MIN
C Manufacturing MNF
D Electricity, gas, steam and air conditioning
supply water ELE
E Water supply, sewerage, waste management
and remediation activities WAT
F Construction CST
G Wholesale and retail trade, repair of motor
vehicles and motorcycles TRD
H Transportation and storage TRS
I Accommodation and food service activities HOT
J Information and communication INF
L Real estate activities RLE
M Professional, scientific and technical activities PRF
N Administrative and support service activities ADM
The variables involved in the research are financial ratios based on book values (due to the fact that the firms are non-public companies, for which the market values are
unavailable), which can be categorised into two groups: capital structure ratios and assets structure ratios. The most commonly used capital structure ratio in empirical research is the debt to assets ratio. Apart from using this variable, the range of capital structure characteristics was extended to several other ratios characterising other forms of debt, such as short-term and long-term debt as well as provisions.
[image:3.595.64.293.461.706.2]As for the assets structure, the standard measure of asset tangibility is usually defined as the ratio of total tangible assets to book value of total assets [40] or the ratio of fixed assets to total assets [6]. Here, four measures of assets structure are applied, as shown in table 3. The choice of variables is conditioned by the data availability in the BACH-ESD database.
Table 3. Capital structure and asset structure ratios used in the analysis
Ratio
character Liability / asset item Symbol Ratio number in BACH-ESD
Capital structure
Total debt D/A 1–R22
Provisions P/A R23
Credits C/A R24
Long-term credits LC/A R25
Short-term credits SC/A R26
Long-term liabilities LL/A R27
Short-term liabilities SL/A R28
Asset structure
Financial fixed assets FFA/A R13
Tangible fixed assets TFA/A R14
Current assets CA/A R15
Current investment and cash in hand or at
bank CI/A
R21
Note: The ratios constitute the share of individual liability or asset items in the total capital (assets).
The variables are ratios of means and not means of ratios, as the data available is aggregated. This means that the ratios are calculated with the use of the balance sheet data averaged for all companies in a given category of size, country and industry. They are not means of ratios, which would indicate that ratios are first calculated at the firm level (unavailable in BACH-ESD database) and then the ratios are averaged for the whole category of firms.
The methodology of the study is based on the Pearsnon’s correlation coefficient between the two lists of variables: the capital structure ratios and the assets structure ratios. The coefficient was computed for the whole data set, as well as for each country, industry and size group separately. This is supposed to reveal whether there are any national, industrial or size-related differences between the capital – assets structure relation, either concerning its sign or significance.
Then, the relationship is further examined for the binominal objects treated as industries in countries, size groups in countries and size groups in industries. The obtained results are meant to allow for identifying some regularities concerning the way country-specific features, industry factors, as well as firm-specific factors related to size affect the way assets structure correlates with financing strategies.
the multidimensional distance between the objects in the form of the Euclidean distance, which was calculated for the objects treated as countries, industries and size groups. The objects were characterised by the correlation coefficient results between all the pairs of variables describing assets structure and capital structure. Therefore, each object was described by 28 variables. Comparing the average distance between the countries with the one between industries and size groups will indicate which of the three factors is the most responsible for the diversity of the way assets structure correlate with the capital structure.
4. Results and Discussion
The most general results concern the correlation coefficient computed between the pairs of variables for the whole dataset, i.e. for all countries, industries, size groups and years. They are shown in table 4.
Most of the coefficients are statistically significant, and the majority of the significant ones are negative. The strongest negative relationship is observed between the current assets ratio and the long-term liabilities, suggesting that the larger the share of current assets, the lower the long-term debt. However, at the same time a positive relation is observed between the current assets ratio and total debt. The strongest positive relationship is again between current assets and short-term liabilities, which is fairly the easiest to explain as natural for firms trying to maintain balance between current liabilities and current assets.
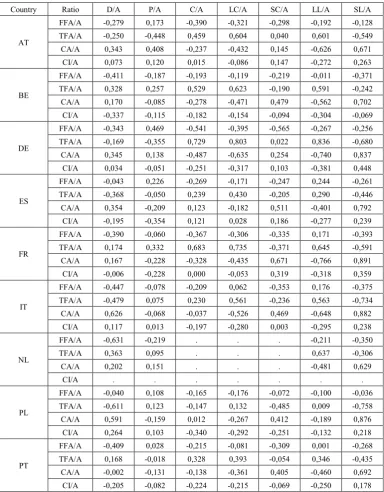
To make the analysis more detailed and to detect certain country patterns in the examined relationships, the correlation analysis was also performed for individual countries, as shown in Table 5. Due to the missing data for the Netherlands, some coefficients are not available for this country.
The results indicate the following regularities:
– the relation between financial fixed assets and most debt ratios is negative and usually statistically significant;
– the relation between tangible fixed assets and short-term liabilities is significantly negative for all countries, similarly to short-term credits;
– the relation between tangible fixed assets and credits, long-term credits and long-term liabilities is usually positive and statistically significant;
– the relation between tangible fixed assets and the debt ratio is negative for Austria, Germany, Spain, Italy and Poland and positive for the other countries, but always significant;
– the relation between current assets and debt, short-term credits and short-term liabilities is positive and significant for all countries but Portugal; – the relation between current assets and long-term
credits and long-term liabilities is negative and significant for all countries;
– the relation between current investment ratio and short-term debt is usually positive, but usually
negative with long-term debt ratios;
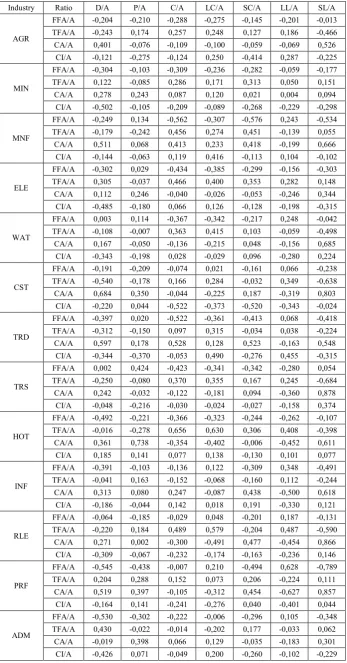
– most of the deficiencies of significance are observed between the provisions and assets structure ratios. The same procedure was followed with respect to individual industries, as shown in table 6. The correlation coefficient values computed for the industrial cross-section reveal that:
– the relation between financial fixed assets and most debt ratios is negative and usually statistically significant (except long-term liabilities, where the relation is positive in most industries, though often insignificant);
– the relation between tangible fixed assets and total debt ratio as well as short-term liabilities is negative for most industries, though often insignificant in case of the debt ratio;
– the relation between tangible fixed assets and credit ratios as well as long-term liabilities is usually significantly positive (except the industries of information and communication and administration, where the relation is mainly negative)
– the relation between current assets and debt, short-term credits and short-term liabilities is positive and usually significant for all industries but administration;
– the relation between current assets and credits, long-term credits and long-term liabilities is negative and significant for most industries; the main exceptions include mining, manufacturing, trade and administration industry,
– the relation between current investment ratio and debt ratio is negative for all industries but accommodation industry.
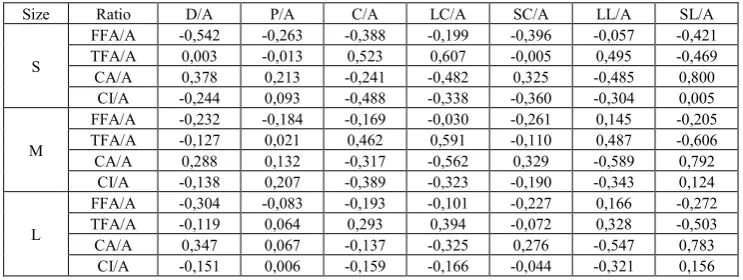
– The last factor considered is the firm size. The results of the correlation between the assets structure ratios and the capital structure ratios in this cross-section are shown in table 7. The results show that:
– the relation between financial fixed assets and most debt ratios is negative and usually statistically significant, the only exception is the ratio of long-term liabilities for medium and large firms, where the relation is significantly positive;
– the relation between tangible fixed assets and total debt ratio is significantly negative for medium and large firms and positive but insignificant for small firms;
– the relation between tangible fixed assets and credits, long-term credits and long-term liabilities is positive and statistically significant for all size groups;
– the relation between tangible fixed assets and short-term credits, short-term liabilities is negative regardless of size and usually significant;
– the relation between current assets and debt, provisions, short-term credits and short-term liabilities is positive and significant for all size groups;
long-term credits and long-term liabilities is negative and significant for all size groups;
– the relation between current investment ratio and total debt ratio, all credit ratios and long-term liabilities is negative regardless of size, mostly
significant;
[image:5.595.113.498.267.760.2]– the relation between current investment ratio and provisions and short-term liabilities is positive regardless of size, mostly significant.
Table 4. Correlation matrix for all countries, industries, size groups and years (deficiencies of significance at p=0,05 are highlighted).
Ratio D/A P/A C/A LC/A SC/A LL/A SL/A
FFA/A -0,325 -0,057 -0,300 -0,161 -0,324 0,077 -0,291
TFA/A -0,090 -0,000 0,431 0,536 -0,040 0,435 -0,521
CA/A 0,324 0,070 -0,181 -0,411 0,326 -0,531 0,788
CI/A -0,188 -0,032 -0,194 -0,159 -0,120 -0,265 0,104
Table 5. Correlation matrix for all individual countries (deficiencies of significance at p=0,05 are highlighted).
Country Ratio D/A P/A C/A LC/A SC/A LL/A SL/A
AT
FFA/A -0,279 0,173 -0,390 -0,321 -0,298 -0,192 -0,128
TFA/A -0,250 -0,448 0,459 0,604 0,040 0,601 -0,549
CA/A 0,343 0,408 -0,237 -0,432 0,145 -0,626 0,671
CI/A 0,073 0,120 0,015 -0,086 0,147 -0,272 0,263
BE
FFA/A -0,411 -0,187 -0,193 -0,119 -0,219 -0,011 -0,371
TFA/A 0,328 0,257 0,529 0,623 -0,190 0,591 -0,242
CA/A 0,170 -0,085 -0,278 -0,471 0,479 -0,562 0,702
CI/A -0,337 -0,115 -0,182 -0,154 -0,094 -0,304 -0,069
DE
FFA/A -0,343 0,469 -0,541 -0,395 -0,565 -0,267 -0,256
TFA/A -0,169 -0,355 0,729 0,803 0,022 0,836 -0,680
CA/A 0,345 0,138 -0,487 -0,635 0,254 -0,740 0,837
CI/A 0,034 -0,051 -0,251 -0,317 0,103 -0,381 0,448
ES
FFA/A -0,043 0,226 -0,269 -0,171 -0,247 0,244 -0,261
TFA/A -0,368 -0,050 0,239 0,430 -0,205 0,290 -0,446
CA/A 0,354 -0,209 0,123 -0,182 0,511 -0,401 0,792
CI/A -0,195 -0,354 0,121 0,028 0,186 -0,277 0,239
FR
FFA/A -0,390 -0,060 -0,367 -0,306 -0,335 0,171 -0,393
TFA/A 0,174 0,332 0,683 0,735 -0,371 0,645 -0,591
CA/A 0,167 -0,228 -0,328 -0,435 0,671 -0,766 0,891
CI/A -0,006 -0,228 0,000 -0,053 0,319 -0,318 0,359
IT
FFA/A -0,447 -0,078 -0,209 0,062 -0,353 0,176 -0,375
TFA/A -0,479 0,075 0,230 0,561 -0,236 0,563 -0,734
CA/A 0,626 -0,068 -0,037 -0,526 0,469 -0,648 0,882
CI/A 0,117 0,013 -0,197 -0,280 0,003 -0,295 0,238
NL
FFA/A -0,631 -0,219 . . . -0,211 -0,350
TFA/A 0,363 0,095 . . . 0,637 -0,306
CA/A 0,202 0,151 . . . -0,481 0,629
CI/A . . . .
PL
FFA/A -0,040 0,108 -0,165 -0,176 -0,072 -0,100 -0,036
TFA/A -0,611 0,123 -0,147 0,132 -0,485 0,009 -0,758
CA/A 0,591 -0,159 0,012 -0,267 0,412 -0,189 0,876
CI/A 0,264 0,103 -0,340 -0,292 -0,251 -0,132 0,218
PT
FFA/A -0,409 0,028 -0,215 -0,081 -0,309 0,001 -0,268
TFA/A 0,168 -0,018 0,328 0,393 -0,054 0,346 -0,435
CA/A -0,002 -0,131 -0,138 -0,361 0,405 -0,460 0,692
Table 6. Correlation matrix for individual industries (deficiencies of significance at p=0,05 are highlighted).
Industry Ratio D/A P/A C/A LC/A SC/A LL/A SL/A
AGR
FFA/A -0,204 -0,210 -0,288 -0,275 -0,145 -0,201 -0,013
TFA/A -0,243 0,174 0,257 0,248 0,127 0,186 -0,466
CA/A 0,401 -0,076 -0,109 -0,100 -0,059 -0,069 0,526
CI/A -0,121 -0,275 -0,124 0,250 -0,414 0,287 -0,225
MIN
FFA/A -0,304 -0,103 -0,309 -0,236 -0,282 -0,059 -0,177
TFA/A 0,122 -0,085 0,286 0,171 0,313 0,050 0,151
CA/A 0,278 0,243 0,087 0,120 0,021 0,004 0,094
CI/A -0,502 -0,105 -0,209 -0,089 -0,268 -0,229 -0,298
MNF
FFA/A -0,249 0,134 -0,562 -0,307 -0,576 0,243 -0,534
TFA/A -0,179 -0,242 0,456 0,274 0,451 -0,139 0,055
CA/A 0,511 0,068 0,413 0,233 0,418 -0,199 0,666
CI/A -0,144 -0,063 0,119 0,416 -0,113 0,104 -0,102
ELE
FFA/A -0,302 0,029 -0,434 -0,385 -0,299 -0,156 -0,303
TFA/A 0,305 -0,037 0,466 0,400 0,353 0,282 0,148
CA/A 0,112 0,246 -0,040 -0,026 -0,053 -0,246 0,344
CI/A -0,485 -0,180 0,066 0,126 -0,128 -0,198 -0,315
WAT
FFA/A 0,003 0,114 -0,367 -0,342 -0,217 0,248 -0,042
TFA/A -0,108 -0,007 0,363 0,415 0,103 -0,059 -0,498
CA/A 0,167 -0,050 -0,136 -0,215 0,048 -0,156 0,685
CI/A -0,343 -0,198 0,028 -0,029 0,096 -0,280 0,224
CST
FFA/A -0,191 -0,209 -0,074 0,021 -0,161 0,066 -0,238
TFA/A -0,540 -0,178 0,166 0,284 -0,032 0,349 -0,638
CA/A 0,684 0,350 -0,044 -0,225 0,187 -0,319 0,803
CI/A -0,220 0,044 -0,522 -0,373 -0,520 -0,343 -0,024
TRD
FFA/A -0,397 0,020 -0,522 -0,361 -0,413 0,068 -0,418
TFA/A -0,312 -0,150 0,097 0,315 -0,034 0,038 -0,224
CA/A 0,597 0,178 0,528 0,128 0,523 -0,163 0,548
CI/A -0,344 -0,370 -0,053 0,490 -0,276 0,455 -0,315
TRS
FFA/A 0,002 0,424 -0,423 -0,341 -0,342 -0,280 0,054
TFA/A -0,250 -0,080 0,370 0,355 0,167 0,245 -0,684
CA/A 0,242 -0,032 -0,122 -0,181 0,094 -0,360 0,878
CI/A -0,048 -0,216 -0,030 -0,024 -0,027 -0,158 0,374
HOT
FFA/A -0,492 -0,221 -0,366 -0,323 -0,244 -0,262 -0,107
TFA/A -0,016 -0,278 0,656 0,630 0,306 0,408 -0,398
CA/A 0,361 0,738 -0,354 -0,402 -0,006 -0,452 0,611
CI/A 0,185 0,141 0,077 0,138 -0,130 0,101 0,077
INF
FFA/A -0,391 -0,103 -0,136 0,122 -0,309 0,348 -0,491
TFA/A -0,041 0,163 -0,152 -0,068 -0,160 0,112 -0,244
CA/A 0,313 0,080 0,247 -0,087 0,438 -0,500 0,618
CI/A -0,186 -0,044 0,142 0,018 0,191 -0,330 0,121
RLE
FFA/A -0,064 -0,185 -0,029 0,048 -0,201 0,187 -0,131
TFA/A -0,220 0,184 0,489 0,579 -0,204 0,487 -0,590
CA/A 0,271 0,002 -0,300 -0,491 0,477 -0,454 0,866
CI/A -0,309 -0,067 -0,232 -0,174 -0,163 -0,236 0,146
PRF
FFA/A -0,545 -0,438 -0,007 0,210 -0,494 0,628 -0,789
TFA/A 0,204 0,288 0,152 0,073 0,206 -0,224 0,111
CA/A 0,519 0,397 -0,105 -0,312 0,454 -0,627 0,857
CI/A -0,164 0,141 -0,241 -0,276 0,040 -0,401 0,044
ADM
FFA/A -0,530 -0,302 -0,222 -0,006 -0,296 0,105 -0,348
TFA/A 0,430 -0,022 -0,014 -0,202 0,177 -0,033 0,062
CA/A -0,019 0,398 0,066 0,129 -0,035 -0,183 0,301
Table 7. Correlation matrix for individual size groups (deficiencies of significance at p=0,05 are highlighted). Size Ratio D/A P/A C/A LC/A SC/A LL/A SL/A
S
FFA/A -0,542 -0,263 -0,388 -0,199 -0,396 -0,057 -0,421
TFA/A 0,003 -0,013 0,523 0,607 -0,005 0,495 -0,469
CA/A 0,378 0,213 -0,241 -0,482 0,325 -0,485 0,800
CI/A -0,244 0,093 -0,488 -0,338 -0,360 -0,304 0,005
M
FFA/A -0,232 -0,184 -0,169 -0,030 -0,261 0,145 -0,205
TFA/A -0,127 0,021 0,462 0,591 -0,110 0,487 -0,606
CA/A 0,288 0,132 -0,317 -0,562 0,329 -0,589 0,792
CI/A -0,138 0,207 -0,389 -0,323 -0,190 -0,343 0,124
L
FFA/A -0,304 -0,083 -0,193 -0,101 -0,227 0,166 -0,272
TFA/A -0,119 0,064 0,293 0,394 -0,072 0,328 -0,503
CA/A 0,347 0,067 -0,137 -0,325 0,276 -0,547 0,783
[image:7.595.127.481.258.417.2]CI/A -0,151 0,006 -0,159 -0,166 -0,044 -0,321 0,156
Table 8. Correlation between fixed assets ratio (TFA/A) and debt ratio (D/A) for industries in countries (deficiencies of significance at p=0,05 are
highlighted).
Industry AT BE DE ES Country FR IT NL PL PT
AGR -0,830 -0,439 . -0,213 0,839 -0,627 0,563 -0,870 0,756
MIN -0,031 0,398 -0,614 -0,538 -0,661 0,542 0,555 0,010 -0,581
MNF 0,870 0,210 0,052 0,112 -0,733 0,042 0,946 0,511 0,489
ELE 0,361 0,366 -0,849 0,528 0,648 -0,331 0,656 -0,054 0,564
WAT -0,272 0,589 -0,045 -0,437 0,537 -0,651 0,400 -0,210 -0,403
CST -0,092 -0,929 -0,089 -0,733 -0,845 0,024 -0,416 -0,552 0,676
TRD 0,566 0,064 0,448 0,243 -0,058 -0,827 0,591 -0,466 0,421
TRS -0,578 0,587 0,150 -0,697 0,026 -0,253 0,030 0,546 0,281
HOT -0,194 0,850 0,330 0,398 0,878 -0,253 0,157 0,254 -0,773
INF -0,360 0,677 0,149 0,736 -0,069 -0,393 0,015 -0,028 -0,165
RLE 0,922 -0,776 -0,805 -0,904 -0,519 -0,436 . -0,459 0,343
PRF -0,657 0,493 -0,306 -0,695 0,800 -0,640 0,506 0,685 0,308
ADM -0,088 0,807 0,878 -0,209 0,012 0,302 0,580 -0,909 0,431
Table 9. Correlation between fixed assets ratio (TFA/A) and debt ratio (D/A) for size groups in countries (deficiencies of significance at p=0,05 are
highlighted).
Size Country
AT BE DE ES FR IT NL PL PT
S 0,112 0,706 -0,537 -0,442 0,444 -0,591 0,641 -0,733 0,323 M -0,244 0,079 -0,306 -0,205 0,125 -0,573 0,200 -0,654 0,218 L -0,422 0,179 0,234 -0,467 0,061 -0,288 0,145 -0,529 -0,019
Table 10. Correlation between fixed assets ratio (TFA/A) and debt ratio (D/A) for size groups in industries (deficiencies of significance at p=0,05 are
highlighted).
Size AGR MIN MNF ELE WAT CST Industry TRD TRS HOT INF RLE PRF ADM
[image:7.595.86.501.566.750.2]S -0,250 0,644 0,053 0,716 -0,079 -0,298 -0,331 0,209 -0,491 0,135 -0,284 0,257 -0,069 M -0,451 -0,128 -0,400 0,105 -0,079 -0,213 -0,371 -0,368 -0,102 -0,153 -0,217 0,457 0,598 L -0,543 -0,158 -0,530 0,046 -0,390 -0,852 -0,376 -0,270 -0,245 -0,209 -0,122 0,071 0,630
Table 11. Euclidean distances for countries
Country AT BE DE ES FR IT NL PL PT
AT 0,00
BE 2,14 0,00
DE 0,85 2,56 0,00
ES 1,82 1,93 2,90 0,00
FR 2,26 1,01 2,01 1,74 0,00
IT 1,59 1,77 2,09 1,32 1,60 0,00
NL 2,54 1,79 4,51 2,74 3,32 2,78 0,00
PL 3,08 3,73 4,51 1,89 4,10 1,68 3,47 0,00
Table 12. Euclidean distances for industries
Industry AGR MIN MNF ELE WAT CST TRD TRS HOT INF RLE PRF ADM
AGR 0,00
MIN 1,72 0,00
MNF 2,82 1,38 0,00
ELE 1,84 0,60 1,75 0,00
WAT 1,57 2,01 2,27 1,79 0,00
CST 2,15 2,86 2,97 3,67 2,35 0,00
TRD 1,79 2,40 1,60 2,60 2,97 3,49 0,00
TRS 1,72 3,17 3,15 2,60 0,79 2,38 3,37 0,00
HOT 2,26 3,07 4,14 2,18 2,58 2,87 3,90 2,26 0,00
INF 2,88 2,58 2,62 2,84 1,95 2,62 2,65 2,88 4,04 0,00
RLE 2,25 3,55 3,82 3,27 1,47 1,37 4,08 1,81 2,69 2,28 0,00
PRF 4,84 3,54 3,19 3,90 3,65 3,34 4,88 5,30 4,57 1,62 3,23 0,00
ADM 2,46 0,93 2,59 1,37 2,89 3,81 2,95 4,29 3,59 1,92 4,29 2,76 0,00
Table 13. Euclidean distances for size groups
Size S M L
S 0,00
M 0,45 0,00
L 0,73 0,38 0,00
When comparing the correlation results in the three above cross-sections at first glance, it seems that the way the assets structure affects capital structure in terms of correlation sign and significance is the least differentiated across size groups. In most cases the direction of the relationship is the same in all sizes ant it is therefore difficult to distinguish any outstanding firm size. However, when the other two sections are considered, despite some dominating tendencies, there were relatively easily observable exceptions in terms of countries and industries which deviate from the general rules.
Analysing the assets–capital structure correlation for the binominal objects is meant to detect some other potential regularities between these balance sheet features. For instance, the way assets structure affects financial structure may differ not only across countries, but also across industries within one country. In order to identify potential relationships in this area the correlation analysis was performed for objects treated as industries in countries. However, due to the amount of results, their presentation was only limited to the Pearson index between the key ratios, i.e. the fixed assets ratio (TFA/A) and the main debt ratio (D/A), as shown in table 8.
The results show that the assets–capital structure relationship is not homogeneous neither within individual countries nor individual industries. The only exceptions in terms of countries are Belgium, the Netherlands and Portugal, where the relation is mainly positive, almost irrespectively of the industry, although not always significant. Austria, Spain, Italy and Poland are usually characterised with the inverse relationship (as shown previously in the analysis performed for countries), but clearly there are certain exception in terms of industries, where the relation is positive. It is worth noting perhaps, that Poland is the country with the biggest number of statistical insignificancies. As for industries, the manufacturing industry stands out as characterised with
positive relation in all countries but France. Nearly the opposite is true for the construction industry.
Generally, the way assets structure affects capital structure is influenced both by the country and industry factors, which means, that a positive relation in one country does not necessarily mean that the same relation can be expected in all industries within this country. Similarly, the correlation sign for an industry may differ across countries.
By analogy, the considered relationship may vary not only across countries, but also across size groups within one country, as shown in table 9 presenting the Pearson index results of the same pair of ratios for size groups in countries. The table reveals that the analysed relationship is much more stable across size groups in countries than for industries in countries. This means that a relation of a given sign for a country means that most likely the sign of this correlation remains the same, regardless of the size group. Exceptions from this rule include Austria, Germany and Portugal, where either the small-sized firms or large ones differ from the rest in terms of the correlation sign. However, when looking at the direction of the correlation across countries in individual size groups, it is obvious, that it does depend on the country specificity. Moreover, this dependence is observed in each size group. What should be noticed is the absence of statistical insignificancies, with the only exception of medium-sized firms in Austria.
Summing up, the assets–capital structure relation is surely affected by country characteristics more than by firm size specificity.
The results obtained for the industry-size cross-section again show that the firm size does not seem to differentiate significantly the way assets structure influences corporate financial decisions. It is clear, however, that the industry specificity does matter when the direction of the relationship is considered. Moreover, the results confirm that the few industries with a positive relationship include mainly energy industry, professional activity and administration. In the majority of industries the relationship is negative across all size groups, though not necessarily significant. Therefore, similarly to the country-size cross-section, it can be concluded that if a relation between the assets structure and financial structure is negative for a given industry, it will most probably be negative for all size groups within this industry.
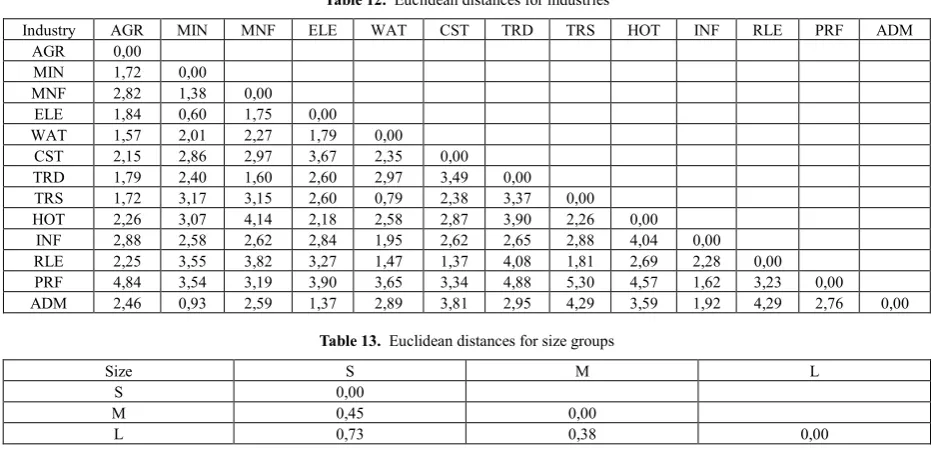
Relatively the weakest impact of the firm size on the way assets structure affects the capital structure in comparison with the other two factors, i.e. the country and industry specificity, is further confirmed by the Euclidean distances calculated for objects treated as countries (table 11), industries (table 12), and size groups (table 13). The average distance is clearly the lowest for the size groups (0,71) in comparison to the other two mean values (1,45 and 1,63) for countries and industries respectively. The higher the mean value, the bigger the distances between the objects and therefore the bigger the differences between the correlation results. This, in turn, proves the bigger diversity in the relationship between assets and capital structure ratios.
5. Conclusions
According to the main findings of the study, the relationship between the tangibility of assets and the debt level is usually negative and most often statistically significant. This general conclusion contradicts the common view supported e.g. by Harris and Raviv [7], Rajan and Zingales [14] or Shleifer and Vishny [11], who claim that a larger share of tangible assets provides higher debt capacity. However, it remains consistent with the results obtained e.g. by Weiss and Wruck [12], Titman and Wessels [22] or Grossman and Hart [21].
Nevertheless, there are certain remarkable exceptions to this rule, particularly in the form of some countries and industries. The opposite and at the same time significant relationship between the above mentioned financial ratios was found in such countries as Belgium, France, the Netherlands and Portugal, as well as in such industries as the energy sector, professional activities and administration. The differences observed between the correlation signs across countries and industries indicate that the way assets structure correlates with corporate capital structure is influenced both by country factors and industry factors. This, in turn, reveals that the assets structure or tangibility is not only a significant financial structure determinant, as widely reported by literature, but also that the way it impacts capital structure is industry-dependent and country-dependent. Contrary
perhaps to some common-sense expectations based on the fact that the firm size is believed to significantly impact capital structure and also assets structure, the firm size measured with the amount of sales occurs relatively the weakest factor differentiating the assets-capital structure relationship.
Due to the fact that the capital structure is undoubtedly one of the most important financial risk factors, the conclusions form this study may raise some important managerial implications concerning the optimization strategy of investments diversification as well as the optimization of the capital structure itself. The research findings prove that the asset-capital structure relationship is far from straightforward. This contributes to the managerial knowledge of capital structure determinants by confirming the industry-dependence and the country-dependence of the correlation between assets and capital structure. This further complicates the managerial financial decisions by showing that country and industry features should be taken account for not only as direct capital structure determinants, but also as indirect factors affecting other capital structure determinants.
The above findings contribute to the scientific research on the capital structure determinants by providing new insights on the way assets structure determines financial structure. It seems likely, that other capital structure determinants may also act differently depending on external conditions, which is the main scientific implication of the study. It also proves that despite the abundance of studies on the capital structure, this area of corporate finance is still not completely recognized and therefore requires further exploration.
REFERENCES
[1] A. Skowronek-Mielczarek. Małe i średnie przedsiębiorstwa. Źródła finansowania (Small and Medium Enterprises. Sources of financing), C.H. Beck, Warszawa, 2003.
[2] T.W. Hall. The collateral channel: Evidence on leverage and asset tangibility, Journal of Corporate Finance, Vol.18, No.3, 570-583, 2012.
[3] J.H. van Binsbergen, J.R. Graham, J. Yang. Optimal Capital Structure, 2011. Online available from: http://ssrn.com/abstract=1743203.
[4] S. Ullah. Inter-Sectoral Differences in the Determination of Capital Structure: A Case Study Based on the Experience of Non-Financial Companies (2001-2008), Pakistan Business Review, October 2012. Online available from: http://ssrn.com/abstract=2197660.
[5] B. Köksal, C. Orman, A. Oduncu. Determinants of Capital Structure: Evidence from a Major Emerging Market Economy, 2013. Online available from: http://ssrn.com/abstract=2212648.
of Finance and Economics, No.67, 82-96, 2011.
[7] M. Harris, A. Raviv. The Theory of Capital Structure, Journal of Finance, Vol.46, No.1, 297-355, 1991.
[8] M.C. Jensen, W.H. Meckling. Theory of the firm: Managerial behavior, agency costs and ownership structure, Journal of Financial Economics, Vol.3, No.4, 305-360, 1976.
[9] S.C. Myers. Determinants of Corporate Borrowing, Journal of Financial Economics, Vol.5, No.2, 147-175, 1977.
[10] J. Abor. Industry Classification and the Capital Structure of Ghanaian SMEs. Studies in Economics and Finance, Vol.24, No.3, 207-219, 2007.
[11] A. Shleifer, R. Vishny. Liquidation values and debt capacity: a market equilibrium approach, Journal of Finance, Vol.47, No.4, 1343-1366, 1992.
[12] L. Weiss, K. Wruck. Information problems, conflicts of interest, and asset stripping: Chapter 11’s failure in the case of Eastern Airlines, Journal of Financial Economics, Vol.48, No.1, 55–97, 1998.
[13] E. Morellec. Asset liquidity, capital structure, and secured debt, Journal of Financial Economics, Vol.61, No.2, 173-206, 2001.
[14] R.G. Rajan, L. Zingales. What Do We Know About Capital Structure? Some Evidence from International Data, Journal of Finance, Vol.50, No.5, 1421-1460, 1995.
[15] M.Z. Frank, V.K. Goyal. Capital Structure Decisions, AFA San Diego Meetings 2003, http://ssrn.com/abstract=396020. [16] S. Akhtar. The Determinants of Capital Structure for
Australian Multinational and Domestic Corporations, Australian Journal of Management, Vol.30, No.2, 321-341, 2005.
[17] S. Thornhill, G. Gellatly, A. Riding. Growth History, Knowledge Intensity and Capital Structure in Small Firms, Venture Capital: An International Journal of Entrepreneurial Finance, Vol.6, No.1, 73-89, 2004.
[18] J.D. Rauh, A. Sufi. Explaining Corporate Capital Structure: Product Markets, Leases, and Asset Similarity, 2010. Online available from: http://ssrn.com/abstract=1592463.
[19] V. Sibilkov. Asset liquidity and capital structure, Journal of Financial and Quantitative Analysis, Vol.44, No.5, 1173-1196, 2009.
[20] P. Hernádi, M. Ormos. Capital Structure and Its Choice in Central and Eastern Europe, Acta Oeconomica, Vol.62, No.2, 229-263, 2012.
[21] S.F. Grossman, O. Hart. Corporate financial structure and managerial incentives, in: J.J. McCall (ed.), The economics of information and uncertainty, University of Chicago Press, Chicago, 1982.
[22] S. Titman, R. Wessels. The Determinants of Capital Structure Choice, Journal of Finance, Vol.43, No.1, 1-19, 1988. [23] M.Z. Frank, V.K. Goyal, Capital Structure Decisions: Which
Factors are Reliably Important?, 2007, http://ssrn.com/abstract=567650 (15.4.2012.)
[24] G.C. Hall, P.J. Hutchinson, N. Michaelas. Determinants of the Capital Structures of European SMEs, Journal of Business
Finance and Accounting, Vol.31, No.5-6, 711-728, 2004. [25] D. Galai, R. Masulis. The Option Pricing Model and the Risk
Factor of Stock, Journal of Financial Economics, Vol.3, No.1-2, 631- 644, 1976.
[26] I. Friend, J. Hasbrouck. Determinants of Capital Structure, in: A. Chen (ed.), Research in Finance, Vol. 7, JAI Press Inc., pp. 1-19. New York, 1988.
[27] I. Friend, L.H. Lang. An Empirical Test of the Impact of Managerial Self-Interest on Corporate Capital Structure, Journal of Finance, Vol.43, No.2, 271-281, 1988.
[28] G.H. Jensen, D.P. Solberg, T.S. Zorn, Simultaneous Determination of Insider Ownership, Debt and Dividend Policies, Journal of Financial Quantitative Analysis, Vol. 27, No.2, 247-263, 1992.
[29] C.F. Thies, M.S. Klock. Determinants of Capital Structure, Review of Financial Economics, Vol.1, No.2, 40-52, 1992. [30] T.W. Downs. Corporate Leverage and Non-Debt-Tax Shields:
Evidence on Crowding Out, Financial Review, Vol.28, No.4, 549-583, 1993.
[31] R. Van der Wijst, R. Thurik. Determinants of Small Firm Debt Ratios: Analysis of Retail Panel Data, Small Business Economics, Vol.5, No.1, 55-65, 1993.
[32] J. Lowe, T. Naughton, P. Taylor. The Impact of Corporate Strategy on the Capital Structure of Australian Companies, Managerial and Decision Economics, Vol.15,No.3, 245-257, 1994.
[33] A. Chehab. Essays on the Determinants of Capital Structure, unpublished doctoral thesis, University of New Orleans, 1995.
[34] C. Shenoy, P.D. Koch. The Firm’s Leverage-Cash Flow Relationship, Journal of Empirical Finance, Vol.2, No.4, 307-331, 1996.
[35] J. Jordan, J. Lowe, P. Taylor. Strategy and Financial Policy in UK Small Firms, Journal of Business Finance and Accounting, Vol.25, No.1-2, 1-27, 1998.
[36] S. Hirota. Are Corporate Financing Decisions Different in Japan? An Empirical Study on Capital Stucture, Journal of the Japanese and International Economies, Vol.13, No.3, 201-229, 1999.
[37] S.L. Barton, P.J. Gordon. Corporate Strategy and Capital Structure, Strategic Management Journal, Vol.9, No.6, 623-632, 1988.
[38] F. Cornelli, R. Portes, M. Schaffer. The Capital Structure of Firms in Central and Eastern Europe, CEPR Discussion Paper No. 1392, 1996, http://ssrn.com/abstract=5211.
[39] BACH-ESD database, Online available from: http://www.bachesd.banque-france.fr.