45
Using natural conversations to classify autism with limited data:
Age matters
Michael Hauser1 Evangelos Sariyanidi1 Birkan Tunc1,2 Casey J. Zampella1
Edward S. Brodkin2 Robert T. Schultz1,2,3 Julia Parish-Morris1,2
1Center for Autism Research, Children’s Hospital of Philadelphia 2 Department of Psychiatry, University of Pennsylvania
3 Department of Pediatrics, University of Pennsylvania
Abstract
Spoken language ability is highly heteroge-neous in Autism Spectrum Disorder (ASD), which complicates efforts to identify linguis-tic markers for use in diagnoslinguis-tic classifica-tion, clinical characterizaclassifica-tion, and for research and clinical outcome measurement. Machine learning techniques that harness the power of multivariate statistics and non-linear data anal-ysis hold promise for modeling this hetero-geneity, but many models require enormous datasets, which are unavailable for most psy-chiatric conditions (including ASD). In lieu of such datasets, good models can still be built by leveraging domain knowledge.
In this study, we compare two machine learn-ing approaches: the first approach incorpo-rates prior knowledge about language vari-ation across middle childhood, adolescence, and adulthood to classify 6-minute naturalis-tic conversation samples from 140 age- and IQ-matched participants (81 with ASD), while the other approach treats all ages the same. We found that individual age-informed mod-els were significantly more accurate than a sin-gle model tasked with building a common al-gorithm across age groups. Furthermore, pre-dictive linguistic features differed significantly by age group, confirming the importance of considering age-related changes in language use when classifying ASD. Our results suggest that limitations imposed by heterogeneity in-herent to ASD and from developmental change with age can be (at least partially) overcome using domain knowledge, such as understand-ing spoken language development from child-hood through adultchild-hood.
1 Introduction
Autism Spectrum Disorder (ASD) is a
neurobiologically-based condition character-ized by social communication impairments and restricted, repetitive patterns of behaviors and
interests [1]. Although ASD is a neurodevel-opmental disorder, it is currently diagnosed using behavior alone, including spoken language. For the roughly 70 percent of individuals with ASD that have average to above-average verbal abilities [2], language is an important pathway to social connections. For clinicians and care providers, spoken language can provide a window into internal cognitive and social processing. Given that primary diagnostic tools for ASD often rely on language-mediated semi-structured inter-views and play activities to elicit behaviors found in the condition [3], measuring and quantifying subtle differences in spoken language between individuals with ASD and matched typically de-veloping (TD) controls is important for improving diagnostic speed and reliability. Furthermore, since the emergence of spoken language before age 5 is a critical predictor of later functional outcomes in ASD [4,5,6], characterizing spoken language development is crucial for understanding long-term developmental outcomes.
Behavioral heterogeneity in ASD is a persistent challenge for researchers and clinicians. In fact, generalizability from one individual to the next is so low that it is often said, “If you have met one person with autism, you have met one per-son with autism”. Wide phenotypic variability has made it difficult to draw reliable statistical conclu-sions about ASD, and indeed, has made it chal-lenging to study the disorder at all [7]. Signifi-cant variability is similarly present in the verbal domain, with the spoken language skills of indi-viduals with ASD ranging from severely impaired to verbally gifted [8]. As an illustration, a recent narrative study found that intra-group variability (ASD alone) was greater than inter-group variabil-ity (between ASD and TD) [9].
ASD have grappled with this phenotypic variabil-ity [10, 11]. Unfortunately, many of the most exciting machine learning models (e.g., models that are able to capture nonlinear dependencies across many dimensions), require large, well-characterized training datasets to function cor-rectly, which are rare in ASD (and are particu-larly scarce for children). These two constraints in ASD research (wide variability in high dimen-sional spaces, and lack of large datasets), suggest that it may be useful to proactively incorporate in-formation that psychiatrists and linguists deem im-portant, thus guiding machine learning models to learn relevant dependencies while ignoring irrele-vant ones.
2 Language in ASD
Prior research suggests that language is a valu-able metric that can be used to distinguish indi-viduals with ASD from TD controls. For exam-ple, the NEPSY narrative retelling test, in which a child listens to and retells a story while being evaluated on how many key story elements were remembered, has been explored for its utility in supporting ASD identification [12]. In an analy-sis of 97 children aged 4-8 years, Prud’hommeaux and colleagues found that children with ASD were more likely than TD controls to veer off topic and incorporate their own specialized interests into the narrative. Similarly, another study showed that TD children are more likely to use similar words and semantic concepts to those given in the narrative, while children with ASD will retell the narrative with different words and concepts related to their own specialized interests [9]. Although promis-ing, these and other studies that focus on one-sided language samples, rather than more ecologically valid conversations, miss a potential source of in-formative variance in language in ASD: the con-versational partner.
Typically, natural conversations involve dy-namic adjustments on a variety of levels that facili-tate rapport and communication; this is called “lin-guistic accommodation” or “alignment” [13]. In-creased accommodation is associated with percep-tions of better conversation [14], but most prior re-search on language in ASD has used samples from structured or semi-structured elicitation tasks - or conversations conducted with an autism specialist - rather than natural conversations [15]. Thus, it is unknown whether and how typical (non-expert)
speakers adjust their conversational behaviors to accommodate social communication differences in ASD, and whether the extent of accommoda-tion changes over the course of development. To explore this new area, the machine learning mod-els employed in this study include include dyadic features derived from a natural conversation (such as turn-taking rates) and interlocutor (conversation partner) features, as well as features from individ-uals with ASD.
3 Developmental Changes in Conversation
Individuals with and without ASD continue to de-velop socially and cognitively throughout child-hood, adolescence, and into early adulthood. For example, although Theory of Mind (or the abil-ity to take another person’s perspective) emerges in early childhood [16], it becomes increasingly sophisticated throughout typical adolescence and early adulthood [17]. Thus, age-related differ-ences in conversation (which is inherently social) are likely to be found.
Physical and emotional changes between child-hood and adolescence (e.g., puberty [18]) in-crease the likelihood that people’s preferred topic of conversation might change over time as well. Whereas young children may be more likely to talk about family and school, older children may be more focused on peer relationships [19], and adults might naturally gravitate toward talking about occupations or romantic partners. Unfortu-nately, few studies have explored natural conversa-tion across development, and normative expecta-tions for brief conversaexpecta-tions are poorly understood across developmental phases and ages.
4 Current Study
The purpose of the current study is to test whether separating a large sample of individuals with and without ASD into different age groups, namely middle childhood (8 to 11), adolescence (12 to 17) and adulthood (18 and up), increases the accuracy and reliability of a simple machine learning classi-fication model for classifying ASD vs. TD, despite inevitable trade-offs in sample size.
classifica-tion accuracy would improve significantly when conducted within each age group separately, as compared to the combined sample. This is in contrast to generally accepted doctrine in machine learning (i.e., that more data is better), since in our study we divide our larger dataset into three smaller datasets.
We further tested whether the specific features that best distinguished diagnostic groups differed significantly by age. Based on prior research and clinical observation, we hypothesized that the rela-tive predicrela-tive value of specific features would dif-fer across development.
5 Methods
5.1 Participants
One hundred forty individuals participated in the present study (ASD: N=81, TD: N=59). Partic-ipants were categorized by age into three sub-groups (see Table 1): middle childhood (8-11 years), adolescence (12-17 years) and adulthood (18-50 years). Diagnoses were confirmed (ASD group) or ruled out (TD group) using the Clin-ical Best Estimate process [20] informed by the Autism Diagnostic Observation Schedule - Sec-ond Edition (ADOS-2) [3] and adhering to DSM-V criteria for ASD [21]. To control for non-age related phenotypic heterogeneity, age subgroups were matched on Full Scale IQ estimates (WASI-II) [22], verbal and nonverbal IQ estimates, and sex ratio (Table 1). Participants with ASD were also matched across age subgroups on autism symptom severity, based on ADOS-2 Calibrated Severity Scores [23] and scores on the Social Communication Questionnaire (SCQ) [24]. All participants were native English speakers.
5.2 Procedure
All aspects of this study were approved by the In-stitutional Review Boards of the Children’s Hos-pital of Philadelphia and the University of Penn-sylvania. All adult participants and parents of minor children provided written informed con-sent for participation. The primary experimental task for this study was a slightly modified ver-sion of the Contextual Assessment of Social Skills (CASS) [25]. The CASS is a semi-structured assessment of conversational ability designed to mimic real-life first-time encounters. Participants engaged in two three-minute face-to-face conver-sations with two different confederates (research
staff, blind to participant diagnostic status and un-aware of the dependent variables of interest). In the first conversation (Interested condition), the confederate demonstrated social interest by engag-ing both verbally and non-verbally in the conver-sation. In the second conversation (Bored con-dition), the confederate demonstrated boredom and disengagement both verbally (e.g., one-word answers, limited follow-up questions) and non-verbally (e.g., neutral affect, limited eye-contact and gestures). Prior to each conversation, study staff provided the following prompt to the partic-ipants and confederates before leaving the room: “Thank you both so much for coming in today. Right now, you will have three minutes to talk and get to know each other, and then I will come back into the room.”
CASS confederates included 42 undergraduate students or BA-level research staff (12 males, 30 females, all native English speakers). Fourteen confederates interacted with the ASD group, 7 with the TD group, and 21 with both groups. Confederates were semi-randomly selected, based on availability and clinical judgment. Confeder-ate sex ratios did not differ by diagnostic group (p=n.s.). In order to provide opportunities for par-ticipants to initiate and develop the conversation, and in accordance with CASS confederate instruc-tions [25], confederates in both conditions were trained to wait 10 seconds before initiating the conversation and to speak for no more than 50% of the time. If conversational lapses occurred, con-federates were trained to wait 5 seconds before re-initiating the conversation. No specific con-versational topic prompts were provided to either speaker.
Table 1: Sex ratio, mean age (in years) and mean IQ scores for ASD and TD children (8-11 years), adolescents (12-17 years), and adults (18-50 years), and measures of autism symptoms for ASD participants.
Dx N Age group N Sex (f/m) Age Full-scale IQ Verbal IQ Non-verbal IQ ADOS CSS SCQ
ASD 81
Children 22 8, 14 9.98 105 103 105 7.32 19.81
Adolescents 24 7, 17 14.62 102 103 101 6.58 17.38
Adults 35 5, 30 26.73 104 108 99 7.06 17.23
TD 59
Children 19 8, 11 9.58 103 104 102 · ·
Adolescents 12 6, 6 14.17 103 101 103 · ·
Adults 28 5, 23 28.42 109 110 106 · ·
Note: Diagnostic groups did not significantly differ on sex ratio, age, or IQ within age bins, and age bins did not differ from one another on these variables (allp=ns). In the ASD group, age bins did not differ significantly from one another on ADOS-2 calibrated severity scores (CSS) or on SCQ scores (allp=ns). Five participants with ASD had missing scores on the SCQ (1 child, 4 adults).
(a) The TreeCam audio/video capture device.
(b) Illustration of the task environment. Participants and confederates sat face-to-face while engaging in a “get to know each other” dialogue, with the TreeCam placed in between.
Figure 1: Experimental setup of the TreeCam device, as well as participants and confederates.
5.3 Audio Data Processing
Audio streams were extracted from audio/video recordings, and saved in lossless .flac format. A team of reliable annotators produced time-aligned, verbatim, orthographic transcripts of audio record-ings in the transcription software XTrans [26]. Each recording was processed by two junior an-notators and one senior annotator, all of whom were undergraduate students and native English speakers. Before becoming junior annotators for this cohort, each team member received at least 10 hours of training in Quick Transcription [27] modified for use with clinical interviews of par-ticipants with ASD [10, 11, 28]. In addition, annotators achieved reliability (defined as >90% in common with a Gold Standard transcript) on segmenting (marking speech start and stop times) and transcribing (writing down words and sounds produced, using the modified Quick Transcription specification) before beginning independent anno-tation. Training files included audio recordings of conversations between individuals with and
with-out autism that were not used in this study. For CASS recordings, one reliable junior an-notator segmented utterances into pause groups, while the second transcribed words produced by each speaker. A senior annotator then thoroughly reviewed and corrected each file. All senior anno-tators had at least 6 months of prior transcription experience. Final language data were exported from XTrans as tab-delimited files that were batch imported into R. Annotations marking non-speech sounds like laughter, indicators of language er-rors like stutters, and punctuation were removed, while other disfluencies (including filled pauses and whole-word repetitions) remained.
5.4 Speech/Language Features
One hundred twenty-three features were calcu-lated for each speaker (participant, confederate) in the Bored condition and the Interested condi-tion separately, using base R [29], qdap [30], and Linguistic Inquiry and Word Count (LIWC) soft-ware [31]. There were six main feature groups: pause/overlap metrics (12), segment/turn metrics (6), speaking rate/word complexity metrics (9), LIWC categories (80), lexical entropy/diversity measures (5), and parts of speech (9). Formality and polarity (2) were also computed at the con-versation level for each speaker, using all words produced by a given speaker in each condition, leading to a total of 123 linguistic features. Dif-ferences between speakers were calculated within each condition (Participant Interested - Confed-erate Interested, Participant Bored - ConfedConfed-erate Bored) and within each speaker across conditions (Participant Interested - Participant Bored, Con-federate Interested - ConCon-federate Bored), yielding
8×123 = 984features.
an-alyzing text-based natural language data. LIWC relies on a dictionary of words that are grouped by semantic similarity into lexical categories. These word-language lexica are designated by a majority vote by human judges, as are which words that fall into each, or multiple, of these lexica. This type of text analysis has been used successfully to analyze various mental disorders [32], as well as to charac-terize personality traits from transcribed language or written text [33].
Lexical features are included in the current study as they have proven informative in prior ASD research. For example, the words produced by interviewing psychologists correlate signifi-cantly with ASD symptom severity [34]. Bone and colleagues conducted their analysis across a wide age range (3.58 to 13.17 years), and interlocutors were autism experts, but their research nonethe-less suggests that word choice by conversational partners could be a potentially sensitive marker of ASD phenotype. In the current study, confederate word choice is captured.
Difference metrics were included in our fea-ture set for two primary reasons. First, the orig-inal intent of the CASS task was to probe how individuals with ASD handle variations in con-versational context, as compared to TD peers. Thus, within-speaker differences across two con-texts (Bored interlocutor, Interested interlocutor) are pertinent relative to the original design. Sec-ond, interlocutor differences within a given con-dition were included as a general measure of lin-guistic accommodation; to study how closely the speaking rates, pause rates, and preferred conver-sational topics of the two speakers align. Research shows that greater linguistic accommodation is as-sociated with social success [35] and also sug-gests that reduced accomodation in ASD in child-hood [36] may improve by adulthood [37].
We recognize that for linear models, introduc-ing new features as linear combinations of old features (such as the difference between the In-terested and Bored conditions) is algebraically equivalent to not introducing these features at all. However, by introducing these additional features, we are guiding the model to learn dependencies that clinicians deem important and have functional value in real-world social contexts. This is espe-cially true when using an automated feature se-lection technique, such as the f-value employed here, as these techniques limit the number of
di-mensions that can be used by a model. In the cur-rent study, rather than requiring our model to learn to take the difference across two dimensions, we are giving the model this knowledgea priori, and thus allowing the model to learn to use this differ-ence with only one dimension. This type of rea-soning forms the motivation for sparse coding (see below).
6 Results and Discussion
6.1 Model Design
Linear logistic regression, also known as the Max-imum Entropy classifier or the softmax classi-fier, was used to classify ASD vs. TD. Features were down-selected before being input into the model by identifying dimensions with the highest f-value (largest mean separation between groups). The model was trained and tested according to leave one out, with an internal5-fold cross vali-dation to determine what percentage of the total features are kept from thef-value, selected from
0.5%, 1%, 2%, 5%, 10%or20%. The top scor-ing f-test values can be seen in Figure 3 for the different age ranges. We used an`2-regularization penalty in the cost function in order to smooth out model coefficients. Our models were implemented in the Python library SciKit-Learn [38].
We use logistic regression so as to have an in-terpretable linear model. With more complex non-parametric and/or non-linear models, it is more difficult to understand the contribution of different variables on the model performance. We did not use a sparsity constraint in the model, such as an `1penalty, since we are already imposing sparsity on the feature space by downsampling the feature dimension to those features with largef-values.
0.50 0.55 0.60 0.65 0.70 0.75 0.80
Accuracy
0 20 40 60 80 100 120
Num
b
er
of
o
ccurences
[image:6.595.77.278.66.190.2]Accuracy of suggested age groups: 0.829 p-value: 0.000 Weighted accuracies of 8 to 11, 12 to 17 and 18 to 50 age groups
Figure 2: Comparison of the classification accuracy (weighted average of the three age groups) of the ac-tual age-based split against1000randomized splits (not based on age) where sample sizes and proportions of classes in each sample were kept same as the actual split. The black vertical line shows the actual accuracy, and the red histogram shows the distribution of accu-racy for random splits. The proportion of the distribu-tion to the right of the vertical line defines thep-value.
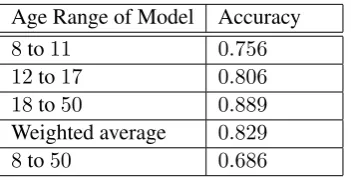
Table 2: Classification accuracy for the three individ-ual age groups and the entire sample. The weighted average (based on sample size) accuracy of the three age-specific models is0.829(p<0.001, see Figure2).
Age Range of Model Accuracy
8to11 0.756
12to17 0.806 18to50 0.889
Weighted average 0.829
8to50 0.686
6.2 Classification Accuracy
Classification accuracy for three age-specific mod-els, as well as the accuracy of a model for all ages together (8 and older), are shown in Table2. Age-specific models outperformed the single model. The weighted average of the three age-specific models, weighted according to number of sam-ples in each age group, was 0.829. In contrast, the single model for all ages achieved an accu-racy of 0.686. Thus, our age-informed approach resulted in a 20.8%relative increase in accuracy,
p < 0.001 (Figure 2). Again, this is notable as it contrasts with the standard doctrine in machine learning that training a model on more data is bet-ter; in our case we trained three models on roughly a third of the data each, yielding improved results.
6.3 Distinguishing Features by Age Group
Different linguistic features emerged as important for distinguishing between TD and ASD
partici-pants in each age group, as seen in Figure3.
In the 8 to 11 age group, overall pronouns and personal pronouns predicted diagnostic sta-tus, such that children with ASD produced smaller proportions of pronouns than matched TD peers. In particular, the first person plural pronoun “we” was used relatively less frequently by the ASD group, suggesting that children with ASD were less likely to describe themselves as associat-ing with others durassociat-ing conversation. Children in the ASD group also tended to use more out-of-dictionary words than TD children (i.e., they pro-duced a smaller percentage of words that were in the LIWC dictionary, relative to their total word production), which could be due to children with ASD talking about specialized, idiosyncratic in-terests or simply using low-frequency words or phrases. Finally, children with ASD spoke more slowly, measured in words per minute with breath pauses removed, than matched TD children, and used comparatively fewer verbs (Figure3a).
Top linguistic features that predicted diagnosis in the 12 to 17 age group are shown in Figure3b. The Bored condition emerged as particularly im-portant for distinguishing between TD and ASD adolescents, as did confederate word choice. Pro-nouns were predictive in this age group as well. Specifically, the second person personal pronoun “you” was produced relatively more often by TD teens in relation to confederates in the Bored con-dition. This could indicate more attempts by the TD group to engage with an obviously bored con-versational partner, and relatively diminished ef-fort put ef-forth by teens with ASD. Confederates speaking with autistic teens used words associated with less authenticity, but greater clout, than when speaking with TD peers, and responded more of-ten to TD participants with negations (perhaps in response to increased questions/comments about themselves, as indicated by greater use of “you” by TD teens).
[image:6.595.94.270.382.472.2]0 2 4 0
1 2 3
4 F-value: 20.4
family-PI
−5 0 5 10 0.00
0.05 0.10 0.15
0.20 F-value: 19.6
ppron-XB
15 20 25 30 0.00
0.05 0.10 0.15
0.20 F-value: 13.9
verb-CB
−10 0 10 0.00
0.02 0.04 0.06 0.08 0.10
F-value: 12.3
pronoun-XB
0 1 2 3 4 0.0
0.5 1.0 1.5 2.0
2.5 F-value: 11.8
we-PI
80 85 90 95 0.00
0.05 0.10 0.15
0.20 F-value: 11.4
Dic-PI
0 2 4 0.0
0.5 1.0 1.5
2.0 F-value: 11.3
family-XI
−100 −50 0 50 0.0000
0.0025 0.0050 0.0075 0.0100 0.0125 0.0150
F-value: 10.4
speechrate-XB
−10 0 10 0.00
0.02 0.04 0.06 0.08 0.10
F-value: 9.8
verb-XB
0 2 4 0.0
0.2 0.4 0.6 0.8 1.0
1.2 F-value: 9.4
we-XI
Predictive features from ages 8 to 11 with F-test signficance
(a) Ages 8 to 11.
0 25 50 75 100 0.00
0.01 0.02 0.03
0.04 F-value: 58.5
Authentic-CB
−4 −2 0 2 0.0
0.1 0.2 0.3 0.4
0.5 F-value: 23.5
negate-CD
0 2 4 0.00
0.25 0.50 0.75 1.00 1.25
1.50 F-value: 21.1
negate-CB
0 50 0.000
0.005 0.010 0.015
0.020 F-value: 21.1
Authentic-XB
−50 0 50 0.000
0.005 0.010 0.015
0.020 F-value: 20.3
Authentic-CD
0 25 50 75 100 0.00
0.01 0.02 0.03
0.04 F-value: 19.7
Clout-CB
0.0 2.5 5.0 7.5 10.0 0.0
0.1 0.2 0.3 0.4
0.5 F-value: 19.0
time-CB
−50 0 50 0.000
0.005 0.010 0.015 0.020
0.025 F-value: 17.2
Clout-CD
−10 −5 0 5 10 0.000
0.025 0.050 0.075 0.100
0.125 F-value: 16.7
you-XB
−100 −50 0 50 0.000
0.005 0.010 0.015 0.020 0.025 0.030
F-value: 16.1
Clout-XB
Predictive features from ages 12 to 17 with F-test signficance
(b) Ages 12 to 17.
0 5 10 0.0
0.1 0.2
0.3 F-value: 59.7
overlap-per-min-CI
−8 −6 −4 −2 0 0.0
0.1 0.2 0.3
0.4 F-value: 54.6
overlap-perc-PI
0.0 2.5 5.0 7.5 10.0 0.0
0.1 0.2
0.3 F-value: 52.4
overlap-per-min-PI
0 1 2
0 2 4 6 F-value: 42.2 overlap-sd-CB
−6 −4 −2 0 0.0
0.5 1.0 1.5 2.0 2.5
3.0 F-value: 39.1
overlap-perc-CB
5 10 15 20 0.00
0.05 0.10 0.15
0.20 F-value: 36.7
turn-per-min-CB
0 2 4 6 8 0.0
0.2 0.4 0.6 0.8 1.0
1.2 F-value: 35.5
overlap-per-min-CB
−6 −4 −2 0 2 0.0
0.1 0.2
0.3 F-value: 31.0
overlap-perc-PD
10 20 30 40 0.00
0.02 0.04 0.06 0.08
F-value: 29.3
talk-perc-CB
5 10 15 20 0.00
0.05 0.10 0.15
0.20 F-value: 26.9
intra.perc-PB
Predictive features from ages 18 to 50 with F-test signficance
[image:7.595.127.472.62.530.2](c) Ages 18 and older.
Figure 3: Histograms of the top 10 most discriminant features (ranked byf-test value) for the different age ranges considered, namely middle childhood, adolescence, and adulthood. In all figures, red is the ASD sample, and blue is the TD sample. Acronyms: PI = participant:interested, PB = participant:bored, PD = participant:difference bored), CI = confederate:interested, CB = confederate:bored, CD = confederate:difference (interested-bored), XI = cross:interested (participant-confederate), XB = cross:bored (participant-confederate).
partners), the way in which conversations occur may include awkward pauses, interruptions, and other temporal atypicalities that could negatively impact conversation quality.
The linguistic features identified in our ma-chine learning analysis are consistent with prior research, as well as with observations about ASD made by clinicians and linguists. Importantly, our analysis goes a step further by quantifying the ex-tent to which each of these features is important
for distinguishing diagnostic groups at each age.
6.4 Feature Consistency Across Age Groups
The purpose of this subsection is to quantify which predictive speech/language features change by age group (i.e., how many predictive features remain predictive regardless of age). To do this, we mea-sured change in thef-value.
Suppose we have age groups (8,11) and
1000 1500 2000 2500 3000 3500 4000 Distance
0 100 200 300 400
Num
b
er
of
o
ccurrences Distance ofsuggested age groups: 2119 p-value: 0.150
F-value Distances across 8 to 11 and 12 to 17 age groups
(a) Ages (8,11) and (12,17)
1500 2000 2500 3000 3500 4000 Distance
0 50 100 150 200 250 300 350 400
Num
b
er
of
o
ccurrences
Distance of suggested age groups: 3025 p-value: 0.007
F-value Distances across 8 to 11 and 18 to 50 age groups
(b) Ages (8,11) and (18,50)
1500 2000 2500 3000 3500 Distance
0 50 100 150 200 250 300 350 400
Num
b
er
of
o
ccurrences
Distance of suggested age groups: 3108 p-value: 0.005
F-value Distances across 12 to 17 and 18 to 50 age groups
[image:8.595.80.511.66.178.2](c) Ages (12,17) and (18,50)
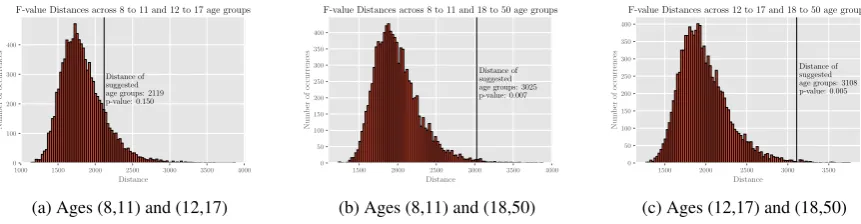
Figure 4: f-value distances (kfi−fjk1) of the actual age-based split against1000randomized splits (not based
on age) where sample sizes and proportions of classes were kept same as the actual split. The black vertical lines show the actual distance, and the red histograms show the distributions of distances for random splits.
f-values betweenf(8,11) andf(12,17). Since each participant is associated with8×123 = 984 fea-tures, as mentioned in Section6.1, thenf(8,11)and f(12,17) are both 984-dimensional vectors, with each dimension containing thef-value of its cor-responding feature. Measuring distances across dimensions does not make sense in this case, as each of the individual f-values are calculated in one dimension independently of each other. Thus, we use the`1-norm, sometimes referred to as the Manhattan distance, when measuring these dis-tances, i.e.kf(8,11)−f(12,17)k1.
Given that the magnitudes kf(8,11)k1 = 1505, kf(12,17)k1 = 1848and kf(18,50)k1 = 3035, we see that the changes in magnitude of the feature importance from one age group to another are pro-portionally very large, and in fact often exceed, the magnitude of the features themselves. This tells us that the specific linguistic features that are im-portant for distinguishing between ASD and TD, as defined by the f-test, vary enormously across age groups, especially when considered against the scale of the linguistic features themselves (Fig-ures4a-4c, and Table3).
Table 3: Measuring the extent to which the feature im-portance changes with the`1-norm, according to each
feature’s f-value, depending on which age group is under consideration. Thep-value corresponds to dis-tances developed from the null hypothesis where no age groups are considered, while ensuring correct pro-portions of ages and classes are kept.
Measurement Value p-value
kf(8,11)−f(12,17)k1 2119 0.150 kf(8,11)−f(18,50)k1 3025 0.007 kf(12,17)−f(18,50)k1 3108 0.005
7 Discussion
In this study, we demonstrated that machine learn-ing models for classifylearn-ing and characterizlearn-ing ASD improve significantly after incorporating domain knowledge. Specifically, we showed that mod-els accounting for developmental changes in spo-ken language and conversation are more accurate for distinguishing ASD from typical development, relative to models resting on the assumption that language patterns during natural conversation re-main consistent across ages. We further showed that linguistic features most strongly predicting ASD vary significantly across age groups, sug-gesting that specific atypicalities in the ways that individuals with ASD use language (versus TD controls) are not static across development.
These findings highlight the value of machine learning models that are clinically informed, par-ticularly for understanding highly heterogeneous conditions like ASD. Developing separate mod-els for different age groups (i.e., middle child-hood, adolescence, and adulthood), we were able to significantly improve the models’ classification performance and reliability, despite reductions in sample size. This bodes well for future appli-cations of machine learning for studying psychi-atric conditions. Future research will incorporate pitch-related features, extend classification to non-ASD psychiatric conditions, and explore the use of more complex nonlinear models for classification and prediction in larger sample sizes.
8 Conclusions and Future Work
pro-vide specific, developmentally-informed interven-tion targets that could be used to improve language and conversation skills in individuals with ASD. We anticipate that additional features identified through machine learning in other domains could similarly inform future efforts to develop targeted clinical interventions.
For future work, we would like to use these techniques in a longitudinal study for measuring treatment progress. This can be done by track-ing feature values of an individual as they change through time. Additionally, we would like to use these techniques to see if they can be used to dif-ferentiate between other mental health disorders, such as anxiety, depression and obsessive compul-sive disorder.
Acknowledgements
This work was supported by NIMH grant R34MH104407, Services to Enhance Social Func-tioning in Adults with Autism Spectrum Disorder (E.S. Brodkin, PI); by the National Center for Re-search Resources, Grant UL1RR024134, now the National Center for Advancing Translational Sci-ences, Grant UL1TR000003 (MPIs: E.S. Brodkin and R.T. Schultz); by the Intellectual and Devel-opmental and Disabilities Research Center at the Childrens Hospital of Philadelphia and the Uni-versity of Pennsylvania, NICHD U54HD86984 (MPIs: M. Robinson and R.T. Schultz); and by the Institute for Translational Medicine and Ther-apeutics (ITMAT) Transdisciplinary Program in Translational Medicine and Therapeutics (MPIs: E.S. Brodkin and R.T. Schultz), and by generous gifts from the Eagles Charitable Foundation and the Allerton Foundation to R.T. Schultz.
References
[1] Fifth Edition, American Psychiatric Association, et al. Diagnostic and statistical manual of mental disorders. Arlington: American Psychiatric
Pub-lishing, 2013.
[2] Helen Tager-Flusberg and Connie Kasari. Mini-mally verbal school-aged children with autism spec-trum disorder: The neglected end of the specspec-trum.
Autism Research, 6(6):468–478, 2013.
[3] C Lord, M Rutter, P DiLavore, S Risi, K Gotham, and S Bishop. Autism diagnostic observation schedule–2nd edition (ados-2). Los Angeles, CA:
Western Psychological Corporation, 2012.
[4] Christopher Gillberg and Suzanne Steffenburg. Out-come and prognostic factors in infantile autism and similar conditions: A population-based study of 46 cases followed through puberty. Journal of autism
and developmental disorders, 17(2):273–287, 1987.
[5] Patricia Howlin, Susan Goode, Jane Hutton, and Michael Rutter. Adult outcome for children with autism. Journal of child psychology and psychiatry, 45(2):212–229, 2004.
[6] Andr´e Venter, Catherine Lord, and Eric Schopler. A follow-up study of high-functioning autistic chil-dren. Journal of child psychology and psychiatry, 33(3):489–597, 1992.
[7] Meng-Chuan Lai, Michael V Lombardo, Bhismadev Chakrabarti, and Simon Baron-Cohen. Subgrouping the autism spectrum”: Reflections on dsm-5. PLoS
biology, 11(4):e1001544, 2013.
[8] Deborah K Anderson, Catherine Lord, Susan Risi, Pamela S DiLavore, Cory Shulman, Audrey Thurm, Kathleen Welch, and Andrew Pickles. Patterns of growth in verbal abilities among children with autism spectrum disorder. Journal of consulting and
clinical psychology, 75(4):594, 2007.
[9] Masoud Rouhizadeh, Emily PrudHommeaux, Jan Van Santen, and Richard Sproat. Measuring id-iosyncratic interests in children with autism. In Pro-ceedings of the conference. Association for
Com-putational Linguistics. Meeting, volume 2015, page
212. NIH Public Access, 2015.
[10] Julia Parish-Morris, Christopher Cieri, Mark Liberman, Leila Bateman, Emily Ferguson, and Robert T Schultz. Building language resources for exploring autism spectrum disorders. In LREC... International Conference on Language Resources & Evaluation:[proceedings]. International
Confer-ence on Language Resources and Evaluation,
vol-ume 2016, page 2100. NIH Public Access, 2016.
[11] Julia Parish-Morris, Mark Liberman, Neville Ryant, Christopher Cieri, Leila Bateman, Emily Fer-guson, and Robert Schultz. Exploring autism spec-trum disorders using hlt. InProceedings of the third workshop on computational lingusitics and clinical
psychology, pages 74–84, 2016.
[12] Emily Prudhommeaux and Masoud Rouhizadeh. Automatic detection of pragmatic deficits in children with autism. InThe... Workshop on Child, Computer
and Interaction, volume 2012, page 1. NIH Public
Access, 2012.
[13] Cindy Gallois and Howard Giles. Communication accommodation theory. The international
encyclo-pedia of language and social interaction, pages 1–
18, 2015.
[14] Stanford W Gregory, Kelly Dagan, and Stephen Webster. Evaluating the relation of vocal accom-modation in conversation partners’ fundamental fre-quencies to perceptions of communication quality.
[15] Daniel Bone, Chi-Chun Lee, Matthew P Black, Marian E Williams, Sungbok Lee, Pat Levitt, and Shrikanth Narayanan. The psychologist as an inter-locutor in autism spectrum disorder assessment: In-sights from a study of spontaneous prosody.
Jour-nal of Speech, Language, and Hearing Research,
57(4):1162–1177, 2014.
[16] Henry M Wellman. The child’s theory of mind.
The MIT Press, 1992.
[17] Iroise Dumontheil, Ian A Apperly, and Sarah-Jayne Blakemore. Online usage of theory of mind continues to develop in late adolescence.
Develop-mental science, 13(2):331–338, 2010.
[18] Deborah Yurgelun-Todd. Emotional and cogni-tive changes during adolescence. Current opinion
in neurobiology, 17(2):251–257, 2007.
[19] B Bradford Brown. Adolescents’ relationships with peers. Handbook of adolescent psychology, pages 363–394, 2004.
[20] Catherine Lord, Eva Petkova, Vanessa Hus, Wei-jin Gan, Feihan Lu, Donna M Martin, Opal Ousley, Lisa Guy, Raphael Bernier, Jennifer Gerdts, et al. A multisite study of the clinical diagnosis of different autism spectrum disorders. Archives of general
psy-chiatry, 69(3):306–313, 2012.
[21] American Psychiatric Association et al. Diagnos-tic and statisDiagnos-tical manual of mental disorders (DSM-5R). American Psychiatric Pub, 2013.
[22] David Wechsler. WASI-II: Wechsler abbreviated
scale of intelligence. PsychCorp, 2011.
[23] Vanessa Hus, Katherine Gotham, and Catherine Lord. Standardizing ados domain scores: Separat-ing severity of social affect and restricted and repeti-tive behaviors. Journal of autism and developmental
disorders, 44(10):2400–2412, 2014.
[24] Michael Rutter, Anthony Bailey, and Cathrine Lord. The social communication questionnaire:
Manual. Western Psychological Services, 2003.
[25] Allison B Ratto, Lauren Turner-Brown, Betty M Rupp, Gary B Mesibov, and David L Penn. Devel-opment of the contextual assessment of social skills (cass): A role play measure of social skill for in-dividuals with high-functioning autism. Journal of
Autism and Developmental Disorders, 41(9):1277–
1286, 2011.
[26] Meghan Lammie Glenn, Stephanie M Strassel, and Haejoong Lee. Xtrans: A speech annotation and transcription tool. In Tenth Annual Conference of the International Speech Communication Associa-tion, 2009.
[27] Owen Kimball, Chai-Lin Kao, Teodoro Arvizo, John Makhoul, and Rukmini Iyer. Quick transcrip-tion and automatic segmentatranscrip-tion of the fisher con-versational telephone speech corpus. InRT04 Work-shop, 2004.
[28] Julia Parish-Morris, Mark Y Liberman, Christo-pher Cieri, John D Herrington, Benjamin E Yerys, Leila Bateman, Joseph Donaher, Emily Ferguson, Juhi Pandey, and Robert T Schultz. Linguistic camouflage in girls with autism spectrum disorder.
Molecular autism, 8(1):48, 2017.
[29] RDC Team et al. R: A language and environment for statistical computing. R foundation for statistical
computing, Vienna, Austria, 2008.
[30] Tyler W Rinker. qdap: Quantitative discourse analysis package. University at Buffalo/SUNY, 2013.
[31] James W Pennebaker, Ryan L Boyd, Kayla Jor-dan, and Kate Blackburn. The development and psy-chometric properties of liwc2015. Technical report, 2015.
[32] Stanley D Rosenberg and Gary J Tucker. Verbal behavior and schizophrenia: The semantic dimen-sion. Archives of General Psychiatry, 36(12):1331– 1337, 1979.
[33] James W Pennebaker and Laura A King. Lin-guistic styles: Language use as an individual differ-ence. Journal of personality and social psychology, 77(6):1296, 1999.
[34] Manoj Kumar, Rahul Gupta, Daniel Bone, Niko-laos Malandrakis, Somer Bishop, and Shrikanth S Narayanan. Objective language feature analysis in children with neurodevelopmental disorders dur-ing autism assessment. In INTERSPEECH, pages 2721–2725, 2016.
[35] Kate Muir, Adam Joinson, Rachel Cotterill, and Nigel Dewdney. Characterizing the linguistic chameleon: Personal and social correlates of lin-guistic style accommodation. Human
Communica-tion Research, 42(3):462–484, 2016.
[36] Zo¨e Louise Hopkins. Language alignment in
chil-dren with an autism spectrum disorder. PhD thesis,
University of Sussex, 2016.
[37] Katie E Slocombe, Ivan Alvarez, Holly P Brani-gan, Tjeerd Jellema, Hollie G Burnett, Anja Fischer, Yan Hei Li, Simon Garrod, and Liat Levita. Lin-guistic alignment in adults with and without asperg-ers syndrome. Journal of Autism and
Developmen-tal Disorders, 43(6):1423–1436, 2013.
[38] F. Pedregosa, G. Varoquaux, A. Gramfort, V. Michel, B. Thirion, O. Grisel, M. Blondel, P. Pret-tenhofer, R. Weiss, V. Dubourg, J. Vanderplas, A. Passos, D. Cournapeau, M. Brucher, M. Perrot, and E. Duchesnay. Scikit-learn: Machine learning in Python. Journal of Machine Learning Research, 12:2825–2830, 2011.
[39] Christopher M Bishop. Pattern recognition and