EUR 2682..e
PART V
EUROPEAN ATOMIC ENERGY COMMUNITY - EURATOM
SAXTON PLUTONIUM PROGRAM
. Quarterly Progress
Report
for the period ending September 30, 1965
by
N.R. NELSON
(Westinghouse Atomic Power Division)
1966
EURATOM/US Agreement for Cooperation
EURAEC Report No. 1415 prepared by the
Westingl\OU$e .Electric Corporation, Pittsburgh, Pa. - USA
LEGAL NOTICE
This document was prepared under the sponsorship of the Commission of the European Atomic Energy Community (Euratom) in pursuance of the joint programme laid down by the Agreement for Cooperation signed on 8 November 1958 between the Government of the United States of America and the European .Atomic Energy Community.
It is specified that neither the Euratom Commission, nor the Government of the United States, their contractors or any person acting on their behalf:
Make any warranty or representation, express or implied, with respect to the accuracy; completeness, or usefulness of the information con-tained in this document, or that the use of any information, apparatus, method, or process disclosed in this document may not infringe privately owned rights; or
Assume any liability with respect to the use of, or for damages resulting from the use of any information, apparatus, method or process disclosed in this document.
This report is on sale ar the addresses listed on:· cover page 4
at the price of FF 12.50 FB 125.- DM 10.- Lit. 1560 Fl. 9.--'
When ordering, please .. quote the EUR number and the title, which are indicated on the cover, of each report.
Printed by Guyot, s.a. Brussels, February 1966
EUR 2682.e PART. V
SAXTON PLUTONIUM PROGRAM Quarterly Progress Report for the
period ending September 30, 1965 by N.R. NELSON (Westinghouse
Atomic Power Division)
European Atomic Energy Community - EURATOM EURA TOM/US Agreement for Cooperation
EURAEC Report No. 1415 prc,pared by the Westinghouse Electric Corporation, Pittsburgh, Pa. (USA)
AEC Contract No. AT(30-l)-3385
Brussels, February 1966 - 90 pages - 22 figures - FE 12/i
The final detailed analyses and comparison of design predictions versus critical experiment data have been completed. Results are in close agreement. All fuel assemblies have been completed and shipped to Saxton. The 3 X 3 subassembly, which was completed during the previous quarter, has continued satisfactory operation in Saxton Core I and has accumulated an exposure of
The Saxton license amendment, allowing operation with plutonium bearing new fuel, was issued on September 20, 1965.
EUR 2682.e
PART V
EUROPEAN ATOMIC ENERGY COMMUNITY - EURATOM
SAXTON PLUTONIUM PROGRAM
Quarterly Progress Report
for the period ending September 30, 1965
by
N.R. NELSON
(Westinghouse Atomic Power Division)
1966
EURATOM/US Agreement for Cooperation
EURAEC Report No. 1415 prepared by the
Westinghouse Electric Corporation, Pittsburgh, Pa. - USA
SUMMARY
The final detailed analyses and comparison of design predictions versus critical experiment data have been completed. Results are in close agreement. All fuel assemblies have been completed and shipped to Saxton. The 3 X 3 subassembly, which was completed during the previous quarter, has continued satisfactory operation in Saxton Core I and has accumulated an exposure of
about 1,400 MWD/t (U + Pu).
The Saxton license amendment, allowing operation with plutonium bearing new fuel, was issued on September 20, 1965.
CONTENTS
SAX-100 Project
Ad.ministration---SAX-220 Fuel Design-Mechanical,Thermal & Hydraulic----SAX-230 Fuel Design -
Materials---SAX-250 Planning & Analysis of Critical Experiments
---SAXF-310 Fuel Fabrication -
Materials---SAXF-320 Fuel Inspection & Assembly---SAX-330 New Fuel
Shipping---SAX-340 Safeguards
Analysis---SAX-350 Alpha
Protection---SAX-400 Performance of Critical
Experiments---SAX-510 Nuclear Analyses of Operation
Performance---SAX-660 Post-Irradiation Materials
Evaluation---Remaining
Sub-Tasks---Page Number
100-1
220-1
230-1
250-1
310-1
320-1
330-1
340-1
350-1
400-1
510-1
660-1
Figure No. 250.l 250,2 320.l 320.2 320.3 320.4 320.5 320.6 320,7 320.8 320.9 320.10 320.11 350.l 350.2 350,3 350.4 350.5 350.6 510.1 660.1 660.2
LIST OF FIGURES
A Comparison of Analysis with Experiment
for Fuel Substitution Experiments in a Multi-Region 19 x 19 Core
Core Diagram for Two Region Power Shaping Experiment Containing Simulated Fuel Followers and Flux Wire Thimbles
I
Assembly Location 2D - Assembly No. 503-12-5
Assembly Location 3D - Assembly No. 503-13-1
3 x 3 Subassembly - Assembly No. 503-4-26
Assembly Location 4D - Assembly No. 503-12-1
Assembly Location 2C - Assembly No. 503-12-2
Assembly Location 3C - Assembly No. 503-12-3
Assembly Location 4c - Assembly No. 503-12-7
Assembly Location 2E - Assembly No. 503-12-4
Assembly Location 3E - Assembly No. 503-12-6
Assembly Location 4E - Assembly No. 503-12-8
Plan View of Saxton Core Showing Fuel Assembly Location
Page Number
250-6 250-13 320-2 320-3 320-4 320-5 320-6 320-7 320.8 320-9 320-10 320-11 320-12
Saxton Plutonium Project Alpha Monitoring System 350-2 Channels RIC-I-P/RIC-II-P Functional Block
Diagra,m
Saxton Plutonium Project Alpha Monitoring System 350-3 Channel RIC-I-P/RIC-II-P Flow Diagram
Saxton Plutonium Project Alpha Monitoring System 350-4 Channels RIA-21-P, RIA-25-P Functional Block
Diagram
Saxton Plutonium Project Alpha Monitoring System 350-5 Channel RIA-22-P, RIA-23-P Functional Block
Diagram
Saxton Plutonium Project Alpha Monitoring System 350-6 Channels RIA-61-P, RIA-62-P Functional Block
Diagram
Saxton Plutonium Project Alpha Monitoring System 350-7 Channel RIA-71-P, RIA-72-P Functional Block
Diagram
Saxton Core II Loading Diagram 510-16
Location of Rod to be Examined in Assembly 3-D 660-3
SAX-100
Project Administration
N. R. Nelson
All project work up to the stage of refueling Saxton with Core II
has been completed except for the issuance of topical reports.
These reports will be expedited during the next quarter after
refueling, which will start during the first week in October.
After startup and after analysis of startup data, there will be
a period of over a year and a half of routine reactor operation
with occasional shutdowns. During this time, nuclear core follow
and some therm.al. and hydraulics follow will be carried out.
However, there will not be a great deal of technical information
generated. Consequently, it is being suggested to the AEC that
semi-annual reports, instead of quarterly reports, be issued
during that time.
Revised Work Programs have been submitted to the AEC and approval,
with some restrictions, has been obtained through the first half
of fiscal year 1966.
Manuscript receiTed on Deceaber
10, 1965.
SAX-220 Fuel Design - Mechanical, Thermal
&
HydraulicH. N. Andrews, E. A. McCabe, N. J. Georges, E. A. Bassler
Manufacture of the plutonium fuel assemblies and inspection of the
channel spacing between adjacent fuel rods and between fuel rods
and fuel assembly enclosure were completed during this period.
The nominal design channel spacing between fuel rods and between
fuel rod and assembly enclosure were .189 and .149 inches respectively.
Minimum rod to enclosure spacings of .135 inch average along the
length of the rod and .123 inch local were established as inspection
requirements. The fuel assembly enclosures were reworked as necessary
to meet these requirements. The inspection data are now being used
by the Therm.al-Hydraulics Design Group to establish engineering hot
channel subfactors for fuel rod bow and channel spacing in the
as-fabricated fuel assemblies.
A topical report in the Mechanical and Thermal-Hydraulic area will
be prepared during the next qua.rter.
SAX-230 Fuel Design - Materials R. J. Allio, A. Biancheria
The work under this sub-task has been completed. A topical report is in preparation. Issuance of this report, which was scheduled for the first quarter of fiscal
1966
has been delayed until the second quarter.SAX-250 Planning and Analysis of Critical Experiments
*
**
F. L. Langford, W. L. Orr, H. I. Sternberg, P. Deramaix, L. Bindler
A. Introduction and Summary
1, Introduction
The objective of this task was to plan, design, and analyze
the critical experiments carried out at the Westinghouse
Reactor Evaluation Center (WREC) to verify the Saxton nuclear
design. The fuel rods used in these experiments also will be
used in the nine central fuel assemblies of the second Saxton
reactor core for a period of about two years.
The WREC critical experiments program and the supporting
program of analysis have been completed. Much of the
post-critical comparison of analysis with experiment was reported
1
in the previous quarterly report. Comparisons were made in
the following functional areas:
a. Reactivity and Criticality
b, Power Peaking Effects
c. Power Sharing
Work continued in these areas during the quarter with the
emphasis placed on the analysis of the multi-region experiments.
*
On leave from Belgo-Nucleaire, Brussels, Belgium and CEN, Mel, Belgium**
working on the Saxton Plutonium Program.in the scope of the EURATOM/AEC/ Westinghouse Contract.
2. Summary
The following statements briefly sunnnarize the work
completed during the quarter.
a. The analysis of the multi-region experiments was
completed. The analysis of the remaining power sharing
configurations confirm the comparisons reported previously.1
2
The PDQ-3 analysis and the measured power distributions
determined using factors from foil irradiation experiments
to relate measured gamma activity to rod power for the two
different fuel types agree within approximately
1%,
Theagreement between analysis and measurements is within
5%
using factors determined by a thermal method.
b. Comparisons of analysis with experiment were made for a
wide range of multi-region reactivity measurements. The
comparisons include fuel substitution experiments, core
perturbations such as water slots, poison worth
measure-ments, and temperature coefficient measurements. In
general, close agreement was obtained.
c. A draft of the final topical report was completed and is
currently being reviewed. This report will be issued in
the next quarter bringing to a close the work under this
task.
The work of this quarter is reported according to the
following functional headings:
(1) Reactivity Measurements and Analysis
(2) Special Power Sharing Experiment
(3) Final Criticality Comparisons
B. Analysis/Experiment Comparisons
l. Reactivity Measurements and Analysis
During the experimental program, extensive reactivity
measurements were ma.de in both single and multi-region
configurations. In general, these measurements can be
grouped into four categories:
a. Reactivity worth of changes in core geometry for step
changes in loading from a one-zone core to a two-zone
core.
b. Reactivity worth of core perturbations such as water
slots.
c. Reactivity worth of control rods and soluble poison.
d. Temperature coefficient measurements.
(1) Fuel Substitution Experiments
The fuel substitution experiments were of two
'
types. First, insert experiments were carried
out in which a relatively small number of fuel
rods in the center of the core were replaced by
fuel rods of a different type, as in a central
3 x 3 region. Second, changes in core configuration
were made in small steps as in changing from a
single region core to a multi-region core by
replacing one fuel type with the other fuel type.
The reactivity change was measured for each step.
Consequently, experimental information is available
for a number of different multi-region configurations.
The fuel substitution experiments provide an
excellent test of the analysis methods and cross
sections. The LEOPARD~PDQ-3 sequence using cross
4
sections reported by Wescott at the
1964
GenevaConference was used to determine the reactivity
effect of each core change. Since a larger
discrepancy between analysis and experiment was
found for the Pu0
2
-uo
2 fueled reference core than for the reference core fueled withuo
2, it was
necessary to consider the etf'ect of the difference
in the size of the induced error in evaluating core
changes involving both fuels. The correction was
based on the relative number of neutrons produced
by fissioning in each fuel as determined from a
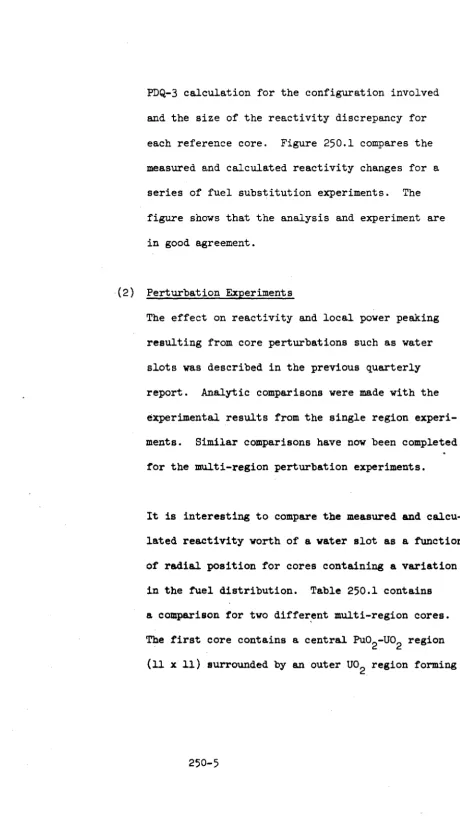
PDQ-3 calculation for the configuration involved
and the size of the reactivity discrepancy for
each reference core. Figure 250.1 compares the
measured and calculated reactivity changes for a
series of fuel substitution experiments. The
figure shows that the analysis and experiment are
in good agreement.
(2) Perturbation Experiments
The effect on reactivity and local power peaking
resulting from core perturbations such as water
slots was described in the previous quarterly
report. Analytic comparisons were made with the
experimental results from the single region
experi-ments. Similar comparisons have now been completed
for the multi-region perturbation experiments.
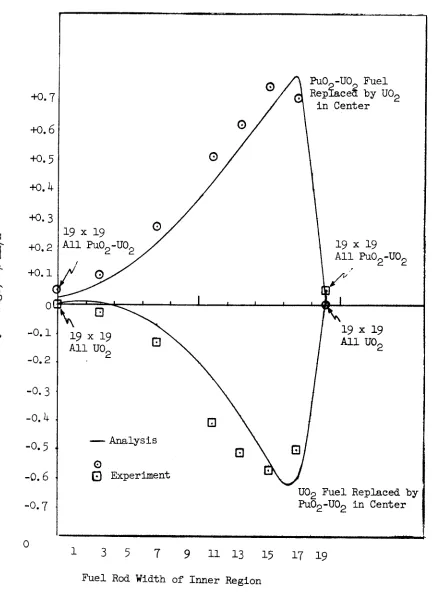
It is interesting to compare the measured and
calcu-lated reactivity worth of a water slot as a function
of re.dial position for cores containing a variation
in the fuel distribution. Table 250.l contains
a comparison for two differ~nt multi-region cores.
The first core contains a central
Puo
2
-uo
2 region (ll x ll) surroundedby
a.n outeruo
2 region forming
[image:16.721.133.594.62.882.2]+o.7
+o.6
+o.
5+o.4
+o. 3
+0.2
+0.1
0
-0.1
-0.2
-0.3
-0.4
-0.5
-0.6
-0.7
0
19 X 19 All Pu0
2
-uo
219 X 19 A11
uo
2
-Analysis
0
G
Experiment1 3 5 7
Q
Pu.O -UO Fuel Repta.ce~ by
uo
2in Center
19 X 19 All Pu.02
-uo
2'
19 X 19 All
uo
2
uo
2 Fuel Replaced by Pu.02-uo
2 in Center9 11 13 15 17 19
Fuel Rod Width of Inner Region
Figure 250.1 A Comparison of Analysis with Experiment for Fuel Substitution Experiments in a Multi-Region 19x19 Core.
[image:17.710.80.522.113.716.2]I\)
Vl 0
I
...J
Core Size
2l X 2l
2l X 21
2l X 21
2l X 2l
21 X 21
21 X 21
Table 250.l
Water Slot Reactivity Effects - Analysis and Experiment
Multi-Re~ion Cores
Region l Region 2
Measured
Size Fuel Fuel Water Slot Location
%
6k/kl l X l l Pu0
2-uo2 uo2
5 Center Rods Removed(Pu0
2-uo 2 ) +
o.46
l l X l l Pu0
2-uo2 uo2 5 Pu0f-uo2 Rods at Fuel
+ 0.27
Inter ace Removed
l l X 11 Pu0
2-uo2 uo2
5 uo
2 Rods at Fuel Interface
+ 0.20
Removed
11 X 11 uo
2 Pu02-uo2 5 Center Rods Removed (uo 2 )
+ 0.20
11 X 11 uo
2 Pu02-uo2
5 U0
2 Rods at Fuel Interface
+ 0.28
Removed
11 X 11 uo2 Pu02-uo2 5 Pu0f-uo2 Rods at Fuel
+ 0.25
Inter ace Removed
Calculated
%
6k/kI
+o.46
\
l + 0.38
+ 0.32
+ O.l9
+ 0.37
[image:18.878.85.787.256.584.2]a 21 x 21 core overall. In the second core, the
fuel positions are reversed with
uo
2 in the inner
region (11 x 11) and Pu0
2
-uo
2 in the outer region. The reactivity worth of each water slot was determinedin separate experiments by removing; (a) five fuel
rods in the center of the core, (b) five fuel rods
at the fuel interface (inner region rods removed)
and (c) five fuel rods at fuel region interface
(outer region fuel rods removed). The LEOPARD-PDQ-3
sequence was used for the analysis. Group constants
,,
for the slot were determined by the use of an extra
region in a fueled LEOPARD calculation in an effort
to account for the effect on the water slot spectrum
of the surrounding fuel. A different Dancoff
calcu-lation from that of the normal lattice was used for
the fuel rods surrounding the slot. Satisfactory
agreement between analysis and experiment was
obtained for the central water slot in the multi-region
cores. However, the comparison was unsatisfactory
for the water slot worth at the fuel interface.
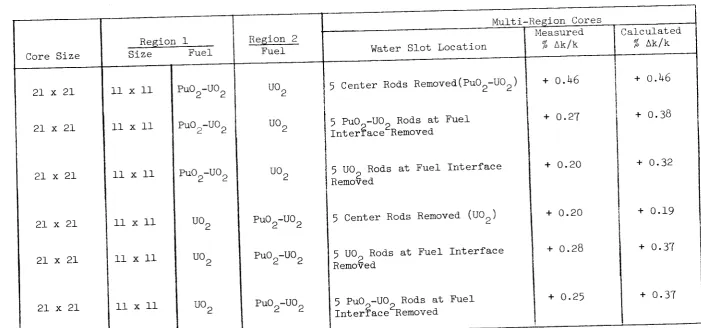
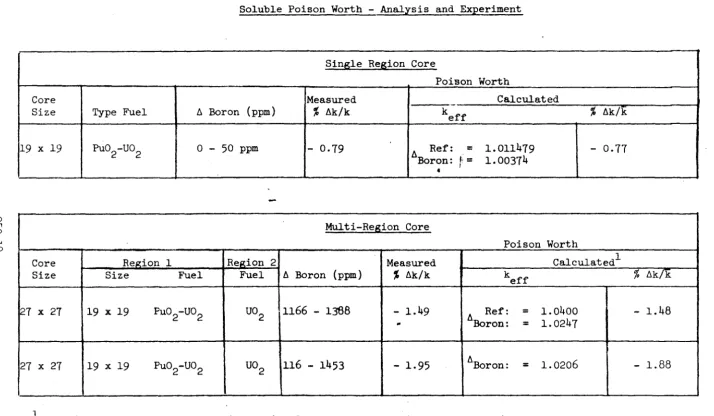
(3) Control Rod and Soluble Poison Worth
The reactivity worth of control rods and soluble
poison were determined in both single region and
multi-region configurations. Tables 250.2 and 250,3
contain comparisons of the measurements with the
f\)
\.J1
0
I
\0
Table 250.2
*
**
Control Rod Worth - Analysis and Experiment
I Single Region Core
I
I
I Rod Worth
r··-··- -·
Calculated
i Core Measured
' Size Type Fuel Control Rod Position
%
lik/k keffi
21 X 21 uo
2 5 Rods in Center - 4.50 Ref: = 1. 003477
Rods:= 0.95804
21 X 21 Pu0
2-uo2 5 Rods in Center - 3.92 Ref: = 1.012429
I Rods: = 0.978187
Multi-Region Core
Rod Worth
Core Region 1 Region 2 Measured Calculated
Size Size Fuel Fuel Control Rod Position
%
lik/k keff21 X 21 11 X 11 Pu0
2-uo2 uo2 5 Rods in Center - 3.65 Ref: = 1.008326
Rods:= 0.972443
21 X 21 11 X 11 Pu0
2-uo2 uo2 5 Rods - Pu02-uo2 - 2.92 Rods = 0.981933
Interface
!
!
5 Rods - U02
21 X 21 11 X 11 Puo 2-uo2
l
uo2 - 2.60 Rods:= 0.983037
i Interface
*
Control Rods (unclad)O.D. = o.403 inch
Composition = .05 Ag, .15 In, .80 Cd
**
Data Being Evaluated%
lik/k- 4.63
- 3.45
%
lik/k- 3.62
I !
!
- 2.65
[image:20.895.127.773.151.616.2]f\)
V1
0
I
µ
0
Table 250,3
Soluble Poison Worth - Analysis and Experiment
Sin~le Reaion Core
Poison Worth
Core Measured
-
CalculatedSize Type Fuel b Boron (ppm)
%
bk/k keff%
bk/k19 X 19 Pu0
2-uo2 0 - 50 ppm - 0.79 b Boron: Ref: = 1.011479 - 0.77
I,= 1.00374
I
•
Multi-Resion Core
Poison Worth
Core Re~ion 1 Re~don 2 Measured Calculated 1
Size Size Fuel Fuel b Boron (ppm)
%
bk/k keff%
bk/k27 X 27 19 X 19 Puo
2-uo2 uo2 1166 - 1368 - 1.49
..
6 Ref: = 1.0400 - 1.48Boron:
=
L 024727 X 27 19 X 19 Puo2-uo2 uo2 116 - 1453 - 1.95 6 Boron:
=
1. 0206 - 1.88 [image:21.904.101.816.66.482.2]Core
Size
19 X 19
(4)
Temperature CoefficientTemperature coefficient measurements were made at
atmospheric pressure for a range of temperatures
from approximately 15°c to a maximum of 70°C. The
analysis and experiment for a multi-region
configu-ration are compared in the following list. A
discrepancy of approximately 8% was found.
Temperature Coefficient
Sin~le Re5ion Region 2 {x 1052 %~k/k/0
c)
TemperatureSize Fuel Fuel Measured Calculated Range, 0c
11 X 11 Pu0
2
-uo
2uo
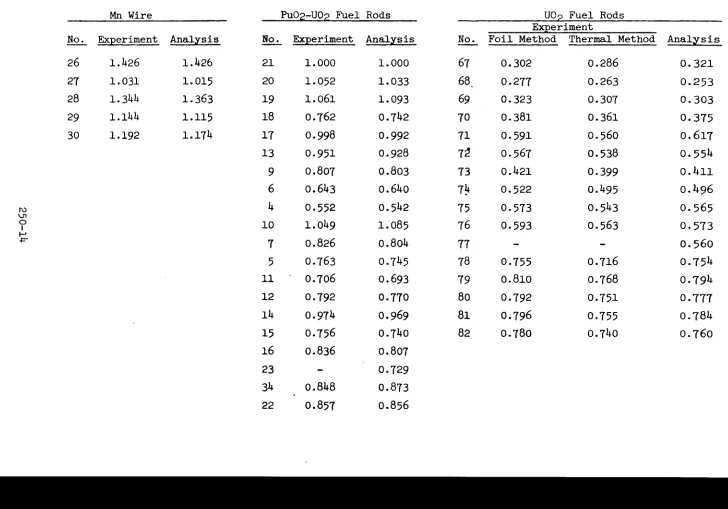
2 10.25 9.5 18-702. Special Power Sharing Experiment
The method used in the past to determine power distributions
in the Saxton reactor has been to measure the activation of
manganese wire in flux wire thimbles at fixed locations in
the core. The activation measurements are then translated
to rod power by means of a PDQ-3 calculation of activation
and power for the appropriate configuration. An experiment
was conducted at the WREC to determine whether any additional
uncertainty in the translation from activation to power is
introduced in a core containing two different fuel types.
To approximate the measurement conditions in the Saxton
reactor, two L-shaped arrays of
uo
2 fuel rods were installed
in the central Pu0
2
-uo
2 fuel region to simulate the control rod fuel followers and aluminum rods containingmanganese wire inserts were inserted at positions
corresponding to the .location of the flux wire thimbles.
Figure 250.2 is a diagram of the core showing the location
of the manganese wires and the rods that were gamma scanned.
A PDQ-3 calculation was carried out for this assembly.
Table 250.4 includes a comparison of the measured and
calculated power and wire activities. These comparisons
of analysis with experiment do not indicate the existence
of any special difficulty that might limit the usefulness
of the method in determining rod power in the Saxton design
core.
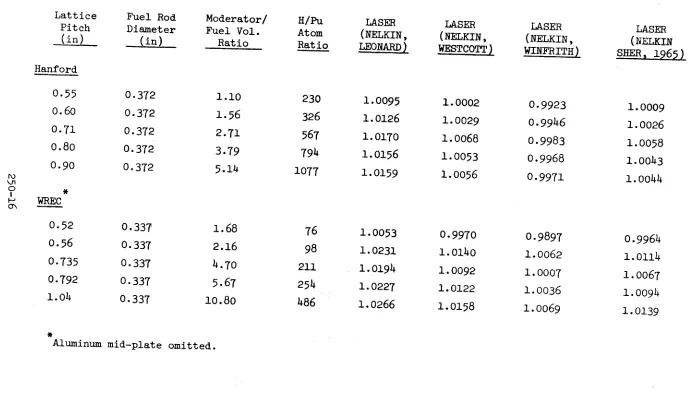
3.
Summary of Criticality ResultsA criticality study for a number of Hanford and WREC
mixed-oxide (Pu0
2
-uo
2) critical experiments was carried out using6
the LASER and LEOPARD programs. An improved version of
LASER is available which includes a variation of the thermal
energy mesh. The improved mesh consists of very fine energy
intervals under the Pu-239 and Pu-240 resonances and thus
eliminates the necessity of using weighted effective cross
section data in the thermal library. The effect of the
revised mesh for both Hanford and WREC experiments is to
improve the reactivity correlation as well as to eliminate
>
-
---
--,,--1
-i
-
--···-·-~L
I
--- -- ---- --..--.
- - - -->-- -
---····
'11.1
~ .__ -
>---','i
·-'
' "'I1:S
.
""
.111
"
~• "11
• ,a. '5
.,
2~., '15'
.
"
"
'8'71 u
----Configuration: ,---
---~-I
· - --I - - -I' 7/
,
'"'12
..
~.
...,
r, : P'IO
L.12',
' 13 ' "t'I 1'1
....
'ict • ja.o
....
~·
"n
~
Iii "12.
r •
- ""Jo
• )If
27 x 27 Core
19 x 19
Pu0
2-uo
2 Inner Regionuo
2 Outer RegionI
-,
j
11
l
I
II
t-+
I--~
-I
--
--
--·-'~?8
I ' ' 1,1 ''"
' --'---.
I"
r1~1 ·-0
uo
2-•
Puo2 uo2
D
Mn Wire. Figure 250.2 Core Diagram for Two-Region Power Shaping ExperimentContaining Simulated Fuel Followers and Flux Wire Thimbles.
250-13
[image:24.690.118.657.57.714.2]--Table 250,4
Special Power Sharing Experiment - Analysis and Experiment
Mn Wire PuO~-U02 Fuel Rods U02 Fuel Rods
Experiment
No. Experiment Analysis No. Experiment Analysis No. Foil Method Thermal Method Anal~sis
26 1.426 1.426 21 1.000 1.000 67 0.302 0.286 0.321
27 1.031 1.015 20 1.052 1.033 68 0.277 0.263 0.253
28 1.344 1.363 19 1.061 1.093 69 0.323 0.307 0.303
29 1.144 1.115 18 0.762 0.742 70 0.381 0.361 0.375
30 1.192 1.174 17 0.998 0.992 71 0.591 0.560 0.617
13 0.951 0.928 7~ 0.567 0.538 0.554
9 0.807 0.803 73 o.421 0.399 o.4ii
6 o.643 o.64o
1;
0.522 o.495 o.496I\) 4 0.552 0.542 75
o.
573 0.543 0.565V1
0 10 1.049 1.085
76 0.593 0.563 0.573
I
I-'
.f="'
7 0.826 0.804 77
-
-
0.5605 0.763 0.745 78 0.755 0.716 0.754
11 0.706 0.693 79 0.810 0.768 0.794
12 0.792
0.110
80 0.792 0.751 0.77714 0.974 0.969 81 0.796 0.755 0.784
15 0.756 0.740 82 0.780 0.740
0.160
16 o.836 0.807
23
-
0.72934 o.848 0.873
[image:25.873.80.808.92.601.2]the apparent trend with pitch present in earlier
calcul.ations. Two cross-section sets, Winfrith7 and
SHER 19658, in addition to those reported previously,
Leonard9 and Wescott, were investigated during the
quarter using the revised LASER. A complete summary of the resul.ts obtained with LASER using the Nelkin scattering kernel for the various cross-section sets is included in
Table 250.5. LEOPARD results are summarized in Table 250.6.
A comparison was made of the results obtained with LASER
and LEOPARD, by computing the average discrepancy and the standard deviations for the various mixed oxide experiments
that were analyzed. These results are listed in Table 250.7.
The comparison shows somewhat better agreement from the
standpoint of both the average discrepancy and standard
deviation for the LASER code.
[image:26.686.121.602.54.835.2]TABLE 250.5
LASER Reactivity Comparisons with Different Thermal Cross Sections
Lattice Fuel Rod Moderator/ H/Pu
LASER LA.SER LASER
LA.SER
Pitch Diameter Fuel Vol. Atom
(NELKIN, (NELKIN, (NELKIN,
(NELKIN
(inL (in_)_ Ratio Ratio
LEONARD[ WESTCOTTJ_ WINFRITH)
SHER, 1965) Hanford
0.55 0.372 1.10 230 1.0095
1.0002 0.9923 1.0009
0.60 0.372 1.56 326
1.0126 1.0029 0.9946
1.0026
0.71 0.372 2.71
567 1.0170 1.0068 0.9983 1.0058
0.80 0.372 3.79
794 1.0156 1.0053 0.9968
1.0043
0.90 0.372 5.14
1077 1.0159 1.0056
0.9971 1.0044
I\)
\J1 0
*
IWREC
I-'
0\
0.52 0.337 1.68
76 1.0053 0.9970
0.9897 0.9964
0.56 0.337 2.16
98 1.0231 1.0140 1.0062 1.0114
0.735 0.337 4.70 211 1.0194
1.0092 1.0007 1.0067
0.792 0.337 5.67
254 1.0227 1.0122 1.0036 1.0094
1.04 0.337 10.80 486
1.0266 1.0158 1.0069
1.0139
[image:27.880.93.784.133.543.2]I\) Vl 0 I I-' -.:i Lattice Pitch (in) Hanford .55 .60 • 71 .80 .90
*
WREC .52 .56 .735 .792 1.04*
Table 250.6
LEOPARD Reactivity Comparisons with Different Thermal Cross-Sections
LEOPARD (Leonard) 1.0165 1.0240 1.0314 1.0297 1.0272 0.9998 1.0223 1.0268 1.0313 1.0314 LEOPARD (Westcott Geneva 1964)
1.0039 1.0102 1.0170 1.0133 0.9890 1.0103 1.0128 1.0175 1.0167 LEOPARD (Sher 1965)
1.0049 1.0102 1.0155 1.0129 1.0098 0.9892 1.0101 1.0114 1.0159 1.0143
I\)
V1
0
I I-'
CP
Cross Sections
LEONARD
II II
WESTCOTT
II
"
SHER 1965
II II
Winfrith
II II
*
TABLE 250.7
Comparison of the Different Standard Deviations Determined from LEOPARD and LASER Calculations
a 0 Lattices
~eop
LEOPARD LASER
5.26 10-3 2.73 10-3 HANFORD 1.0258
11. 75 10-3 7.92 10-3 WREC 1.0223
9.26 10-3 6.19 10-3 H & W
*
1.024044.8110-3 2.55 10-3 Ui\NFORD 1.0111
10.33 10-3 6.69 10-3 WREC 1.0091
8.40 10-3 5.99 10-3 H & W 1.0100
3.54 10-3 1.69 10-3 HANFORD 1.0107
9.57 10-3 6.17 10-3 WREC 1.0076
7.37 10-3 4.93 10-3 H & W 1.0092
-
2.13 10-3 HANFORD--
6.25 10-3 WREC--
5.40 10-3 H & W-Combination of the Hanford and WREC data.
~aser
1.0141
1.0194
1.0168
1.0039
1.0096
1.0071
1.0036
1.0076
1.0056
0.9958 1.0014
[image:29.873.72.786.80.512.2]References
1. N. R. Nelson, "Saxton Plutonium Program Quarterly Progress
Report for the Period Ending June 30, 1965," WCAP-3385-4 (1965).
2. W. R. Cadwell, et. al., "PDQ-3, A Program for the Solution of the Neutron Diffusion Equations in Two-Dimensions on the IBM-704," WAPD-TM-179 (May 1960).
3, R. F. Barry, "LEOPARD - A Spectrum Dependent Non-Spatial Depletion Code for the IBM-7094," WCAP-3741 (1963),
4. C. H. Westcott, "Survey of Nuclear Data for Reactor Calculations,"
A/Conf. 28/P. 717 ( 1964).
5. H.P. Flatt and D. C. Haller, "AIM-5 - A Multi-Group, One-Dimensional Diffusion·Equation Code," NAA-SR-4694 (March 1960).
6. C. G. Poncelet, "Burnup Physics of Heterogeneous Reactor Lattices,"
WCAP-6069 (1965).
7, A. C. Douglas and J, F. Barry, "Neutron Cross Sections of Pu-239 in the Energy Rangel Kev to 15 Mev," AWRE-0-79/64 (1965).
'8, J, R. Stehn, "Thermal-Neutron Cross Sections of Fissile Isotopes,11
ANS Transactions, Vol. 8, No. l (June 1965).
9. B. R. Leonard, Jr., 11
Plutonium Physics: Contribution to Plutonium Handbook," HW-7294
7
(March 1962) .SAXF-310 Fuel Fabrication - Materials
R.
J.
Allio,A,
Biancheria, R. N. Stanutz, M. D. HoustonPelletized Fuel
All pelletized fuel rods fabricated by Nuniec were received by
Westinghouse during the report period. High temperature water,
isotopic analysis, rare earth analysis and
Pu/U
ratio analysishave been completed and received by Westinghouse. The analyses
have been confirmed to be within specification. The remaining
items to compldte the contractual commitments at Numec are:
1. Library samples
2, Scrap recovery
The library samples are ready and will be shipped as soon as the
Westinghouse Waltz Mill facility receives a license amendment
allowing storage of an increased amount of
Puo
2-uo
2 powder. Scraprecovery is expected to be completed by October
15, 1965,
In themeantime, Numec has initiated action to transfer accountability
for this material from the Westinghouse license to the Numec
account.
Vibrationally Compacted Fuel
All vibrationally compacted fuel rods fabricated by the Battelle
Northwest Laboratories were received by Westinghouse during the
last report period. Fuel library samples have been received at
Waltz Mill. The only item required to complete the contract is
the return of spare components. This shipment is expected
shortly.
Terminal Report
Preparation of a final report on fuel fabrication has been delayed
by late completion of fuel assemblies. The report will be completed
during the next quart er.
SAXF-320 Fuel Inspection and Assembly
W. E.
Ray,
A. Biancheria, R. N. Stanutz, M.A. ParkerDuring this period the core loading pattern of the vibrationally compacted and pelletized f'uel rod assemblies and the location of the stainless and Zircaloy-4 rods within these assemblies were
reviewed with the Nuclear and Thermal and Hydraulic Design sections.
An acceptable loading design was determined and submitted to Mechanical Design for preparation of ma.nufacturing drawings.
Assembly of all
9
x9
plutonium fuel assemblies was completed during the period. The assemblies have been inspected, approved and shipped to Saxton. The Saxton license amendment to permit operation with plutonium bearing fuel was issued on September 20th, Assemblies will be loaded in the reactor the first week in October.Croes-section drawings recording the fuel rod identification letters and numbers as installed in lattice spaces in the nine fuel assemblies and in the one 3 x 3 subassembly are included in Figures 320.l through 320.10. The location of assemblies within the core are shown on
Figure 320,11. The symbol X in some of the grid locations indicates flux thimbles, neutron source points, or 9'x 9 removable rods. Since the
9
x9
removable rods will be inserted at Saxton, the identification numbers of the rods inserted in the grid locations marked X will be recorded during refueling./
00 MO
J8
J9
XM3
I6
N4D9
118IA
Rl
B8
A6
05
JO
K6
Jlc4
I5
R5
:e5
F6
01M4 NO L2
J4
LO S2 L1ir8
X 118 08
H7
o4
L3
A7
TOQl
I lTl
K7I2
G3 KO N9P6
031'7
L6
I4
T2E5
B2M2
o6
Q5 :S3W6
M5
M9
E9.01
I3
ll903
Zirc&loy-4 Clad Pu0
2
-uo
2 VipacFigure 320,l - Assembly Location 2D Assembly No. 503-12-5
320-2
K3
I7
R2
[image:34.710.130.610.102.815.2]PW EW QI OB X TP
VI RP FT EP HQ AW NH EF
u4
MG AJ ~ PU FR PQTC PE AN ~ 3 NZ
MS MQ Subas 3embly GB
FX LS OH
OE MT GD SU FI LD
LZ JM CI TJ MD
.
LPCH lTH
Rods U4, Vl 304'Stainless Steel Clad Pu0
2-uo2 Vipac Rods M, D 304 Stainless Steel Clad Puo
2-uo2 Pellets
Others - Zircaloy-4 Clad Pu0
2-uo2 Pellets
PF
KP
FN
ST
SA
FP
ND
LJ
[image:35.699.69.501.141.565.2]D
Figure 320.2 - Assembly Location 3D Assembly No. 503-13-1
320-3
TI
SS
M
X
X
TI'
RY
MR
NORTH
"W"
~ /
cz
D B9X5
Xl
J6 E
FA
"Y"
"X"
Rods CZ, FA - Pelletized Fuel
Rods
D, E
-
Removable Rods - Pelletized FuelRods B9, J6 - Vipac Fuel
Rods
Xl, X5 -
Removable Rods - Vipac FuelZircaloy-4 Clad Pu0
2
-uo
2 FuelFigure 320,3 3 x 3 Subassembly Assembly No. 503-4-26
[image:36.699.136.634.69.810.2]K4
N3
~3
N2 XR6
A2
RO
R7
Ul
tJO
S9
R4
Ml
VO
u6
-
--
-P2
U5
P3
EO
M7
A3
L7
N5
M8
09
S8
134
Sl
P4
E3
K8
X
Al
IU3
R3
PO QO C2.J7
Q7
S4
L8
G4L5
so
El
ro
Q3
~S5
Q4
I9
DOS7
Q6
E2
Q8
U2-
P7
P5
R9
A5
Q9
J2 02
Pl
A9
Zircaloy-4 Clad Pu0
2
-uo
2 Vipac Fuel 304 Stainless Steel Clad Pu02
-uo
2 Vipac Fuel (Underlined)Figure 320.4 - Assembly Location 4D Assembly No. 503-12-1
320-5
~2
tr3
IKl
[image:37.702.103.486.141.604.2]NJ KL LR IL
1
RD CG AD JX OY IV MW SQ
LC ER LL Jl1A. LX CS QH KQ
QG
OL
BC EU JB IG PR MJX PI RM MP OA IP JC FZ
GE JT ~I KZ MF SM DW EQ
HI JR ffH SR NA FO DP MC
NB TG )0 MU JS NC DZ 11:L
RC OP DY GZ X SF BZ MO
Zircaloy-4 Clad Pu0
2
-uo
2 PelletsFigure 320.5 - Assembly Location 2C Assembly No. 503-12-2
320-6
KU
PX
GF
[image:38.702.124.608.67.756.2]cry SE
FL
IANN
cw
bR
CP RA Hs
ON....
-CM
-
K ~ Fs
~
pIK
""'
-
-DJ
-
N ILV QW JQ~
OU GADX
...
-
J OQ JFRI
...
0RL
X.,
EN IR
.
AtFD
MY CMtE
GN
TE
-
...
SN
-
T IM K)G DQ KR IJlC-
I
SCLI
R-
TO GS 'IMro
IH
L IM-™
TN NX LE X KYKT
LW QEZircaloy-4 Clad Pu0
2
-uo
2 Pellets 304 Stainless Steel Clad Pu02
-uo
2 Pellets (underlined letters)Figure 320.6 - Assembly Location 3C Assembly No. 503-12-3
[image:39.696.72.561.111.764.2]RT QL LT GO
IO HT DR MB KG IF BB QP
DC FF HX GL IT LK GM DI
NT LG BU IE AI RF P:i. GG
X HN CA BF GP DS CE RE
QM AB DL QF LO DD IQ HW
BT
™
KN PO BY ES HJ CQJA BE FC DF DU RX AY MI
EJ BS HP HR X JU BJ GY
Zircaloy-4 Clad Pu0
2
-uo
2 PelletsFigure 320.7 - Assembly Location 4C Assembly No. 503-12-7
320-8
GC
QJ
sz
[image:40.696.118.616.43.888.2]FK BA NU BG
TR RV TL Qz; LY EG EK QU
BR GK EN ED NF QX BO DK
QR BD PJ CU GR NE EZ
MM
X NV IRK KF JZ BK PC PG
DO
ex
PY
DT IN ICco
HZLN ~y 0il SR BW DA KJ RV
MX IRZ JX !LU JW MN N'O FG
LA IKff i,B ITK X KA
PJ
LHZircaloy-4 Clad Pu0
2
-uo
2 PelletsFigure 320.8 - Assembly Location 2E Assembly No. 503-12-4
32U-CJ
QD
SW
FM
[image:41.699.106.579.108.783.2]RW HA NQ DE
KC
FY EO TS SJ RB PY MEAO CV TB NG DN ]N KS EB
KV SB HG ID FV
PH
ALcc
00 CB MK
ow
PK
QS HY XSP
PD • AA IXKO
PA
PV NW JGPN KX PT FJ GJ JE NP NL JL
GT AP SY RG ID3 HM OL AM IW
NR
AT
:EM (N X GR.oc
FW ODZircaloy-4 Clad Pu0
2
-uo
2 PelletsFigure 320,9 - Assembly Location 3E Assembly No. 503-12-6
[image:42.699.127.590.83.848.2]SK CD HE LF
RO AF' OT AS PP GI HO EM
AU GV HD GU QT MV KD BV
JY FE PB RJ OK KB BL FS
X HS MH AH NK JV SG PZ
EH FU AR TQ TH CN NS RS
OF AG BI AZ KM AQ AK PS
SL TA SI FQ PL OS CF FH
NM QA HK DB X EL GX BP
Zircaloy-4 Clad Pu0
2
-uo
2 PelletsFigure 320.10 - Assembly Location 4E Assembly No. 503-12-8
320-11
-AE
LQ
QV
[image:43.701.108.557.73.783.2]PLAN VIEW OF SAXTON CORE SHOWING FUEL ASSEi~BL V LC)CA Tlt)NS
A
B
C
D
E
F
w
2
~~I~
l@~IP I
YJ
LEGEND:
3
D
0
D
C]
U02 PELLETS
w
~
Pu02 - U02 PELLETS,
I\)
0
I
t-'
D
i
~ I~~~ ~
I
LJ
MECHANICALLY MIXED
I\)
4
@)
Pu02 - U02 VIBRATIONALLY
COMPACTED - DYNAPAK
PROCESS
~ ~ ~ - I . . . . _ ~
I~~~ A
5
y
[image:44.871.138.778.172.617.2]SAX-330 New Fuel Shipping
H. E. Walchli, H. W. Keller
During the quarter, modifications to the fuel shipping containers
were completed. Licenses authorizing transport of the fuel and
receipt of the fuel at Saxton were issued by the AEC. Fuel
assemblies were completed, packaged and shipped to Saxton.
This subtask has been completed. It will not be included in
future reports.
SAX-340 Safeguards Analysis R. C. Nichols
The final licensing procedures for the Partial Plutonium Saxton
Core II were completed during this quarter. The Saxton Partial
Plutonium Core II was reviewed by the Advisory Committee on
Reactor Safeguards at its July
8
meeting. The main questions~eised by ACRS at this meeting concerned the magnitude of
reactivity ano.nu:w..ies which might be expected to occur during
operation of the core, and the magnitude of reactivity anomaly
whose occurrence would justify a precautionary shutdown.
ACRS was told that a departure of 3 or
4
percent Ak from predictionwould not be considered unusual over the lifetime of the Core II
because of the uncertainties in the burnup rate of the mixed fuel
core. However, based on post-operating experience at Saxton,
short-term reactivity losses of significant magnitudes would not
be expected in the operation of Core II. A conservative analysis
has shown that the Saxton reactor system could accept a sudden
insertion of up to 1.25 percent Ak/k with the possibility of core
damage but without causing failure of the reactor coolant system.
ACRS then recommended that SNEC and the Regulatory Staff select an
appropriate limit to reactivity anomalies "beyond those attributable
to discrepancies between prediction and observation of long term
reactivity effects due to burnup." Accordingly, the following
statement was prepared by Westinghouse, approved by SNEC and
forwarded to the staff for approval:
"During the operation of the reactor, periodic measurements and
predictions of core reactivity shall be made. The core reactivity
measurements shall be made at equilibrium conditions and shall
take into consideration experimentally determined or analytically
determined core characteristics.
"The prediction of core reactivity shall be made based upon
extrapolation of all preceding nominal core reactivity measurements
and shall be made on a weekly basis. An unexplained reactivity gain
or loss shall be defined as the difference between the experimental
measurement and the prediction based upon extrapolation. If an
unexplained reactivity loss of
1,25
percent 6k/k or more should occur,an evaluation shall be instituted and the Commission notified."
The staff felt that this statement was adequate and the proposed
Operating License Amendment was published in the August 17 issue
of the FEDERAL REGISTER for the required waiting period of thirty
(30) days. The Operating License Amendment was officially issued
on September 20,
1965.
Work was initiated and completed to re-evaluate the hot startup,
rod withdrawal at power and steam break accidents with more
conservative values of the moderator temperature coefficient.
This re-evaluation was performed so that the Saxton Technical
Specifications for the moderator temperature coefficient limits
could be made less restrictive if the zero and low power experiments
indicate such a requirement.
The values used in the re-evaluation are:
Hot Startup
Rod Withdrawal at Power
Steam Break
New
= - 2.0 x 10-
4
Ak/k/°F-4
a = - 2.0 x 10 Ak/k/°F
m
2000 ppm a
.
-
3.4 x 10⁻⁴ Ak/k/°Fm
1000 ppm a
.
-
4.1 X 10⁻⁴ Ak/k/°Fm
0 ppm a
.
-
5.5
x 10-4 Ak/k/°Fm
Old
-- 2.7 X 10
-4
- 2.7 X 10
-4
- 2,7 X 10⁻⁴
- 3.4 X 10⁻⁴
- 4.1 X 10⁻⁴
The results of the re-evaluation do not significantly alter the
accident analyses presented in the Safeguards Report for the Saxton
Core II. The hot startup accident results are no different at all
as the transient is governed by the Doppler coefficient and is not
changed by this small variation in moderator temperature coefficient.
The rod withdrawal at power re-analysis shows a change of
o.6°F
in the moderator at the peak power conditions which would result in4
-4
a change in reactivity between the two cases of O. 2 x 10 ~k/k
which is a very small value and does not change the power transient
significantly.
The transients of the steam break are not changed by the change in
moderator coefficient as reactor scram occurs well before any large
moderator temperature changes occur, Changing the moderator coefficient
only changes the amount of reactivity required in control rods out
of the core prior to the accident to prevent return to critical during
the moderator cooldown.
SAX-350 Alpha Protection
J.
W. PowerAll ten channels of the Alpha Monitoring System (AMS) were delivered,
installed, calibrated, and operationally checked-out. Figures 1 to
5 are functional block diagrams of the ten AMS instrumentation channels. Figure
6
is a piping diagram of the detector housing assembly.The following programs of instrument operation were initiated in
conjunction with SNEC prior to plutonium fuel core loading.
A. Prior to receipt of instrumentation at the site, Radon-Theron
background level studies were conducted on a time basis throughout
the plant in order to establish alarm set points.
B. More intensive alpha surface contamination techniques were
established as normal plant survey operations.
C. Alpha hand and foot monitoring stations were put in operation on
a permanent basis.
D. Direct comparisons of the AMS air particulate monitors with the
laboratory analysis instrumentation were initiated in order to
re-affirm the channel's alpha efficiency and sensitivity.
1.S;;I;
-I ~
PUIIOE
SAMPU • -Y"==-+---========n
/
/
IIUl
-,\
i I
I
s.!:U .,. I I =t-
.,.---"""
•••
SAMPU
'N-;_,qf/
--,
I
PRESSUM SWITCH
ALARM
= ,
OUTlfT
L ______ _
I
I
_ _j
I
cC::.
Ll
CHMNH Rl(-1-P lttC-2, RtC-ll·P
Vo\POR CONTAINER ENVl~NT
PRESSUM PROlrCT C.WIT
FUM Al.ARM LNI
M>HB
GAS SAMPLE
PORT HCH-1-1 fJM!m
---,
I tNPtfT~ P O W F R - - - ~ ' ! . _ _
I
r---
.
i
I'""'"
I
I
I- - - 1
~,
~,
\.yu
qJ
~
~
6
,"T'\'r·
~l
N»I Al!111'CTol!r HOiKiNG~ SlMlll
V-
,---1 j
l
-I ,0\_ 4 - ~ -frrnL
i
r l --t-'6'_--£_:::::'j__~
]I
I
7iow c!Jnllllll'lr - _J
- M\·CJB -
-- ,
"'"""'
JIICOIIDER
lll'UT
I cc>t.M RATI INDICA~ I ..,n:
INTIGAATOA: _ _ ~ •cOIDU --- I I INPIII
I
I
I I
'- 1- - - - - - - - - iii-2551
-ec.ill(...l ...
I
~
- -- cOMPUlIR INOK:Aloa
-IIPIJT - ~ P O W E R
1
IIPIJT
- 1 - - - ...
I_ -
-PfflW:R DfSTRIIUTO. PANEL
"'Pill
___ ~ - - --- POWER
350-2
l
- - - •COlll(I
-U.XlON·PllffONUII PI0.1:CT
Al PHA MONm>ltK, SYS 1'EM
CMAl9E..S IIC+PIINC · 11-P flKTIOIUt llOCl DIACUM
[image:51.916.99.827.47.589.2]w
Vl 0
I w
',:j
H
§
~
trj
w
Vl
0
I\)
PURGl
( . ~A\IPL[ I" •
INUT
\A \\PlE
{l'JTUT
VAPOR
CONTAIN[R
I PIIESSURE
I PIIOl(ClQR
ASSfMILY
I
_J
\
PARTICIJlAl( SAMPIIFll1£R PAPER HOLDER
112.".
DETECTOR HOOS ING AS SEMIL Y
FLOW INDICATOR
NOTE:
IN!SS OMRWISE N01£D
All CONNECTIONS ARE PIPING • RUBBER PRESSURE HOSE
'·
£. D Sil 319:R>-C
GAS SAMPU BOMB TAP
SAXTON-PLUTONIUM PROJECT
ALPHA MONITORING 5 Y5 T[M CHANNIL RIC-1-PI RIC-ll·P
w \Jl 0 I ..,.->zj H § :::0 t:rl w \Jl 0 w
CHANNEL RIA-21-P RADIO-CHEMISTRY LAB
,---1
I
I
AIR I
SAMPLE )1,-i ,1
INLIT
I
I
I
FILTERI
PAPER HV-70I
I
I
AIR ISAMPLE -C I OUTLIT
I
I
L _
AIM-3
- - - 1
- - - 1
HVPS
HI ACTIVITY ALARM
I
COUNT LEVEL INDICATOR I
I
II I
I Pll.SE~--
••uq ···-· ""'c. II
I
I
I I
I
LVPS ELAPSEI I
v:;it,
I
"OH" _ _ _. AEr:DERI
I
SAMPLE
L - - - ·
_ _ _ _ _
11Pllt\P READOUT ASSEMBLY
I
REMOTE
ALARM
REMOTI RECORDER
INPUT
.___ _________________ _. _____ _!I_
POWER_J INPUT
DETECTOR HOUSING
-SAXTON-PLUTONIUM PROJECT ALPHA MONITORING SYSTEM
CHANNELS RIA-21-P, RIA-24 P {i'::....
FUNCTIONAL BLOCK DIAGRAM \Lli
w \Jl 0 t \Jl f-rj H
8
~ t:rJ w \Jl 0 +:-"CHANNEL RIA-22-P SAMPLING ROOM
r
-1.
REMOlt I
ALARM
I
MAP-SB
HI ACTIVITY Al.AIIM
,----
---'
I
I
I
I
I I
I
I I
I
. > - - - 'HOIIN
I
tNPSI I
AIR SAMPLI
INLET
I
flll[R PAPERI
~AMPLI HOLDERI
r-I
I
I
I
I
FILTER FP-S PAPEI
I
_ _ _ _ l!HI_
SCINTIU.ATION t •
I
I I
I
I
I
.._:.,__..!.4,1 PULSE
I I
---
I I
LVPS
L _ - - -
MM-611-I
I
I
I
_ _ _ 1,REMOTE
I
R E C O R D E R ~ ~ - - - : - - - t t - - : - - - ~ - - - _ ; _ _ _ _ _ _ _ _ _ _ __J
L _ _ -
-,VACULM
I
I
I
I
I
OUTPUT
GAGE
I
AIR (
SAMPLE -,C
I
I
OUTLET
I
~
I
I _J
POWER I - - -SWITCH- SAMPLIR ASSEMBLY
INPUT MA-SB
SWITCH
POWER - - - -
---INPUT CHANNEL RIA-23-P CHARGING PUMP ROOM
"ON"
£ D SK. 313392-C
CX-1 DETECTOR HOUSING
r
SAXTON~PLUTONIUM PROJECT ALPHA MONITORING SYSTEM CHANNEL RIA 22-1'. RIA-23-P FUNCTIONAL BLOCK DIAGRAM
I
I
w Vl 0 I 0\ '-:rJ H
8
~ trJ w Vl 0CHANNEL RIA-61-P GENERAL PiANT SURVEY
AC-3
, - - - ,
I
I
SCINTILLATIONt
Ii'Rfl
.. __
1 _ _ _L _:_ ()[TECTOR _-
~
~
_Jl
RASP-IA
I
r--
-,-SC;Tl~ATIONC
-- - -
lPRf-1. ...
_1 ___ _
l~ :___ DETECTOR
l _ _ _
~ _jj
,
-'
H.V.P.S.
_ PAC-ISA~ _ _
G. M. ornCTOR
• • IBUILT-INI
COOO RATE INDICATOR
-,
I I
I
r - - - -
JG_:!_ - - - ,I
SPEAK£R
I
+
~ AMPLl'IERt
~ DISCRIMINATOR. •I
I
G,M, DETECTORt ~ J I •L _ _ _ _ _ _ _ _ _ _
I
l
SPA-I
~
-1
ii
I
SCINTILLATIONt
~
I ~~ _ D£TECT0R _ _ _ _ AMP _jI
I
I
LV.P.S.L _ _ _ _
-D£TECT0R PROBES IAVAILABlfl
CHANNEL RIA-62-P GENERAL PLANT SURVEY
L D SK 319394-C
BAmRIES
SAXTON-PLUTONIUM PROJECT
ALPHA MONITORING SYSTEM CHANNELS RIA-61-P RIA-62-P
i
FUN<:TIO~Al BLOCK DIAGRAMw
\Jl
0
I - l
crj
H
2
cD
M w
\Jl
0 CT\
CHANNEL RIA-71-P
VAPOR CONTAINER AIR LOCK (DURING SHIJTOOWN) MONITORING STATION
RADIO-CHEMISTRY LAB ( DURING OPERATION) MONITORING STATION
i
I
I
I
I~ - ~ - - _AC-JA - -I I
I
I
SCINTILLATIONt
~
II
I DETECTOR AMP I j
i
L _ _ _ _ _ _ _ J
DETECTOR PROBE
I
I
RM-JA
H.V.P.S.
COIMT LIVEL INDICATOR
PULSE
1AMPl.lFIER
-I ~ ~ • RECORDER
r--t--J I I OUTPUT
I
~ L V . P , S . • • SPEAKER I
I
CHANNEL RIA-72-P
LAUNDRY ROOM MONITORING STATION
'ON" __ __J INPUT
COUNTRATEMETER ~ POWER
E D. SK. 319393-C
*
The following additional equipment, not noted in the last report,
was procured for the AMS:
Channel RIC-1-P Vapor Container Air Particulate Monitor
y, B Monitor for (a/y, B) Ratio Determination
*
l Model MD-lB G.M. Detector Assembly
*
l Model RM-20BS Count Rate Module Assembly
Tracerlab/West Model Number
SAX-400 Performance of Critical Experiments
D. F. Hanlen, R. D. Leamer
The experimental work under this sub-task was completed during
the previous Quarter.
A topical report is being prepared for issue during the next
Quarter.
SAX-510
*
Nuclear Analyses of Operation Performance
F. L. Langford, W. L. Orr, A. J. Impink, R. H. Chastain, G. F. Elletti*, H. I. Sternberg
A. Introduction and Elumrrl.ary
1. Introduction
During the Quarter, the work under this task was begun.
The objectives of the task are to compare the expected
performance of the plutonium fuel in the Saxton reactor
with experimental results and to evaluate the differences
between the analysis and experiment that are found. A
second objective is to provide supporting analysis during
the irradiation period. The supporting analysis will
include the evaluation of reactivity and power distribution
changes with time corresponding to the operating history of
the core.
The work to be carried out under this task can be divided
into three phases: The first, concerns the planning of the
initial test program and the predictions of the reactor
performance based on the analysis and the extrapolation of
the experimental data from the WREC critical experiment.
CNEN - Rome, Italy
The second, involves the initial testing in Saxton from
zero-power tests to full-power operation. The analytic
requirements in this phase include the post
1
analysis ofthe startup data. The startup physics data will provide
the first test of the nuclear calculation models under
power reactor conditions of temperature and pressure and
with engineered fuel and control configurations.
The third phase is concerned with the long-term irradiation
of the core. During this phase, core conditions will be
periodically monitored and analyzed. The measurements will
include core power maps using the flux wire system, thermal
and hydraulic measurements, and reactivity state point
variables. These measurements will indicate the trend in
gross power sharing with burnup and provide a measure of
reactivity depletion. During this phase, the calculations
will be updated to conform with the actual reactor operating
history. At least twice during the long-term irradiation
period and at the end of Core II life, the zero-power
reactivity state will be measured by determining the all-rod,c
out, xenon-free, boron concentration at operating t l'lllI:'-'1·a t ur».
The moderator temperature coefficient and selected control rn.:
worths will be measured and trends with burn up arnl lJoron
concentration will be established.
2. Summary
The following statements briefly summarize the work
accomplished during the quarter:
a. The measurements program to be followed in the
Saxton Core II startup and escalation to full-power
was defined.
b. The program of analysis required in support of these
initial experiments was begun. In addition, the
analytic procedure to be followed throughout Core II
operation was defined and the necessary burnup
calculations were started.
B. Experimental Program
A detailed sequence of experiments to be carried out from
initial criticality to full-power operation has been defined.
The planned experimental program is shown in Tables 510.l and
510.2. The column labeled "Technique" refers to a defined
experimental procedure to be followed in the conduct of the
experiment.
C. Analytic Program
The analytic program consists of two parts: The first, concerns
the analysis that is needed in the conduct of the initial test
program. The required analysis includes determining the boron