r · * *»~tr »r ιρ,"·
ENVIRONMENTAL RADIOACTIVITY
I f ^ S i ä j ISPRA 1964 ,^|i^Ä!j
M. de BORTOLI, P. GAGLIONE,
A. MALVICINI and E. VAN DER STRICHT
l'.''r4iJUi!«äi *! IÌTÌ'BSIÌAUUI!
JR*:t;S» ;·· 1965
ÎM
mWMm.
Joint Nuclear Research Center Ispra Establishment ItalyProtection Service Site Survey and Meteorology
■§
jwæfiTsr"
mSßmtwm
.MS-
l l f l l
m
mw'yiè
L E G A L N O T I C E
This d o c u m e n t was p r e p a r e d u n d e r t h e sponsorship of t h e Commission of t h e E u r o p e a n Atomic E n e r g y C o m m u n i t y ( E U R A T O M ) .
N e i t h e r t h e E U R A T O M Commission, its contractors nor a n y person acting on their behalf:
lo — Make a n y w a r r a n t y or representation, express or implied, w i t h respect t o t h e accuracy, completeness, or usefulness of t h e information contained in this d o c u m e n t , or t h a t t h e use of a n y information, a p p a r a t u s , m e t h o d , or process disclosed in this d o c u m e n t m a y n o t infringe p r i v a t e l y owned rights; or
2o — Assume a n y liability w i t h respect t o t h e use of, or for damages resulting from t h e use of a n y information, a p p a r a t u s , m e t h o d or process disclosed in this d o c u m e n t .
p|«||
This report can be obtained, a t the price of Belgian Francs 85,— f r o m : P R E S S E S ACADÉMIQUES E U R O P É E N N E S 98, Chaussée de Charleroi, Brussels 6.
Please remit payments to :
— B A N Q U E D E LA SOCIÉTÉ G É N É R A L E (Agence Ma Campagne) Brussels account No. 964.558,
— B E L G I A N AMERICAN B A N K AND T R U S T COMPANY New York account No. 22.186,
— LLOYDS B A N K (Europe) L t d . 10, Moorgate London E.C.2,
gining the reference : " E U R 2509.e E N V I R O N M E N T A L R A D I O A C T I V I T Y I S P R A 1964".
Printed by Guyot, s.a., Brussels, September 1965.
This document was duplicated on the basis of the best available copy.
■ W a
:Λ»;
Ú\
EUR 2509.e
ENVIRONMENTAL RADIOACTIVITY - ISPRA 1964 by M. de SORTOLI, P. GAGLIONE, A. MALVICINI and E. VAN D E R STRICHT
European Atomic Energy Community - EURATOM
Joint Nuclear Research Center - Ispra Establishment (Italy) Protection Service - Site Survey and Meteorology
Brussels, September 1965 - 65 pages - 10 figures
In this report are briefly described the measurements of environmental radioactivity performed during 1964 by the site survey group of the Protection Service.
Data are given on the concentrations of strontium-90, cesium-137 and other radionuclides in fallout, air, soil, waters, herbage, animal bones and foods.
EUR 2509.e
ENVIRONMENTAL RADIOACTIVITY - ISPRA 1964 by M. de BORTOLI, P. GAGLIONE, A. MALVICINI and E. VAN D E R STRICHT
European Atomic Energy Community - EURATOM
Joint Nuclear Research Center - Ispra Establishment (Italy) Protection Service - Site Survey and Meteorology
Brussels, September 1965 - 65 pages - 10 figures
In this report are briefly described the measurements of environmental radioactivity performed during 1964 by the site survey group of the Protection Service.
E U R 2 5 0 9 . e
EUROPEAN ATOMIC ENERGY COMMUNITY - EURATOM
ENVIRONMENTAL RADIOACTIVITY
ISPRA 1964
by
M. de BORTOLI, P. GAGLIONE,
A. MALVICINI and E. VAN DER STRICHT
1965
Joint Nuclear Research Center Ispra Establishment - Italy
C O N T E N T S
P a g e
I N T R O D U C T I O N 7
1. A I R R A D I O A C T I V I T Y 9
2. F A L L O U T RADIOACTIVITY 10
3 . H E R B A G E R A D I O A C T I V I T Y 11
4 . R A D I O A C T I V I T Y O F M I L K AN D DAIRY P R O D U C T S 11
5. R A D I O A C T I V I T Y O F W A T E R S 12
6. S T R O N T I U M - 9 0 AND C E S I U M - 1 3 7 IN F I S H E S 13
7 . S T R O N T I U M - 9 0 IN C A L F - B O N E S 13
8. S T R O N T I U M - 9 0 AND C E S I U M - 1 3 7 IN V E G E T A B L E S 13
9. SOIL R A D I O A C T I V I T Y 13
LIST OF TABLES
Table 1
Table 2
Table 3
Table 4
Table
Table
Table 7
Table 8
Table 9
Table 10
Table 11
Table 12
Table 13
Table 14
Concentrations of g r o s s beta radioactivity in air at I s p r a J a n u a r y .
Concentrations of g r o s s beta radioactivity in air at Ispra F e b r u a r y .
Concentrations of g r o s s beta radioactivity in air at I s p r a M a r c h .
Concentrations of g r o s s beta radioactivity in air at Ispra A p r i l .
Concentrations of g r o s s beta radioactivity in air at Ispra May.
Concentrations of g r o s s beta radioactivity in air at Ispra June.
Concentrations of g r o s s beta radioactivity in air at Ispra July.
Concentrations of g r o s s beta radioactivity in air at Ispra August,
Concentrations of g r o s s beta radioactivity in air at I s p r a September.
Concentrations of g r o s s beta radioactivity in air at Ispra October.
Concentrations of g r o s s beta radioactivity in air at I s p r a November.
Concentrations of g r o s s beta radioactivity in air at Ispra D e c e m b e r .
Monthly average concentrations of radionuclides in a i r .
Table
Table
Table
Table
Table
Table
Table
Table
Table
Table
Table
Table
15
16
17
18
19
20
21
22
23
24
25
26
Table
Table
Table
27
28
29
Table 3 0
Table 31
Table 32
Table
Table
Table
33
34
35
Radionuclides in fallout.
Strontium-90 and cesium-137 in h e r b a g e .
Strontium-90 and cesium-137 in milk - Bar za.
Strontium-90 and cesium-137 in milk - Brebbia,
Strontium-90 and cesium-137 in milk - I s p r a .
Strontium-90 and cesium-137 in milk - O s m a t e .
Strontium-90 and cesium-137 in milk - Milano.
Strontium-90 and cesium-137 in milk - V a r e s e .
Strontium-90 and cesium-137 in c h e e s e .
Geographie coordinates of water sampling points.
Beta radioactivity subtracted p o t a s s i u m - 4 0 in the water of the lake "Maggiore".
Beta radioactivity subtracted potas sium-40 in l a k e s , s t r e a m s and wells near to the I s p r a E s t a b l i s h m e n t .
Strontium-90 and cesium-137 in lake w a t e r s .
Concentrations of radionuclides in lake w a t e r s .
Strontium-90 and cesium-137 in lake fishes - lake " M a g g i o r e " .
Strontium-90 and cesium-137 in lake fishes - lake " V a r e s e " .
Strontium-90 and cesium-137 in lake fishes - lake "Comabbio".
Strontium-90 and cesium-137 in lake fishes - lake "Monate".
Strontium-90 in calf-bones.
Strontium-90 and cesium-137 in vegetables.
LIST OF FIGURES
F i g u r e 1 Daily average concentrations of g r o s s beta r a -dioactivity in air at I s p r a January - June 1964.
F i g u r e 2 Daily average concentrations of g r o s s beta r a -dioactivity in air at I s p r a July - December 1964.
F i g u r e 3 Monthly average concentrations of s t r o n t i u m - 9 0 and cesium-137 in air at I s p r a .
F i g u r e 3 bis Monthly radiation dose due to a r g o n - 4 1 at Sta-tion 2.
Figure 4 G r o s s beta radioactivity monthly deposition at Ispra since F e b r u a r y 1958.
F i g u r e 5 Strontium-90 monthly deposition and cumulative deposit at I s p r a since F e b r u a r y 1958.
F i g u r e 6 Cesium137 monthly deposition at I s p r a since F e -b r u a r y 1958.
Figure 7 Strontium-90 in the milk of I s p r a and Milano sin-ce January I960.
F i g u r e 8 Sodium-22 and cesium-137 average concentrations in the milk of the zone of I s p r a .
F i g u r e 9 Map of the Joint Nuclear R e s e a r c h Center - I s p r a Establishment.
I N T R O D U C T I O N
In this r e p o r t a r e s u m m a r i z e d the r e s u l t s of the m e a s u r e m e n t s of environmental radioactivity p e r f o r m e d by the site survey group of the P r o t e c t i o n Service. The personnel of this group, which is supervised by Prof. A. Malvicini, chief of the Protection Service, is the following:
physicist: P . Gaglione chemist: M. de Bortoli
radioactivity m e a s u r e m e n t s : O. Malgarini, E . Lovati
monitoring network and sampling: G. B r u g h e r a , L. Pasqualini chemical laboratory: E . Pecchio, L. T o r t o r a , O. Cadario s e c r e t a r y : A. Schieppati.
The work is c a r r i e d out in a chemical l a b o r a t o r y and in a r a dioactivity m e a s u r e m e n t s laboratory, equipped for gamma and alpha s p e c -t r o m e -t r y and low-level be-ta coun-ting.
The following r e p o r t s on the same subject have already been published:
CNI - 43 M i s u r e di radioattività ambientale, I s p r a 1958 - 59
CNI - 95 Misure di radioattività ambientale, I s p r a I960
EUR - 223i M i s u r e di radioattività ambientale, I s p r a 1961
EUR - 4 8 l i M i s u r e di radioattività ambientale, I s p r a 1962
EUR - 2213e Environmental radioactivity, I s p r a 1963
Main object of the m e a s u r e m e n t s p e r f o r m e d is the constant knowledge of the radioactivity levels in the environment of the E u r a t o m I s p r a E s t a b l i s h m e n t , in order to identify and evaluate incidental r a d i o a c -tive contaminations caused by the Establishment itself.
Since the beginning of the survey the data collected a r e r e p r e -sentative only of the artificial radioactivity produced by weapon testing and of natural radioactivity, both of them contributing, a l m o s t entirely, to the i r r a d i a t i o n dose of the population in the e n v i r o n s .
The personnel devotes itself a l m o s t completely to routine a c -tivities, yet efforts a r e made to improve the techniques and to test new
methods, with the a i m of increasing the quality and the quantity of the work.
During I964 t h r e e important steps have been made on this way:
i) soil analyses were s t a r t e d early in the year;
-ii) a s p e c t r o m e t e r for the m e a s u r e m e n t of the cascade g a m m a e m i t t e r s in various m a t r i x e s was set up in autumn;
iii) in the l a s t weeks of the y e a r were begun the works of c e n t r a -lisation to the building N. 51, were the group is lodged, of the data of air radioactivity from the control stations: the connection, via telephonic c a b l e s , will make possible the d i r e c t r e a ding, in a r o o m of the building, of the values given by the m e a
-suring i n s t r u m e n t s situated in the stations. The two f o r m e r to-pics a r e discussed m o r e widely in the next c h a p t e r s .
Starting from 1963 among the activities of the site survey group it was included also the control of the liquid wastes from the decontamina-tion plant for liquids. During 1964 seventeen waste s a m p l e s were analyzed for g r o s s alpha and beta, gamma e m i t t e r s and s t r o n t i u m - 9 0 .
Mr. E . Van der Stricht, chemist of the site survey group; starting from
September 1964 has been t r a n s f e r e d to the D i r e c t o r a t e for Health and
AIR RADIOACTIVITY
The c o n t r o l of a i r r a d i o a c t i v i t y h a s been c a r r i e d out in five
Stations situated on the boundary of the E s t a b l i s h m e n t (see F i g . 9). The
new s t a t i o n s , which have had been f o r e s e e n to be r e a d y late in 1964, o
wing to delay in c o n s t r u c t i o n , will begin to work e a r l y in 1965.
The equipment of the s t a t i o n s and the m e a s u r e m e n t s p e r f o r
m e d a r e unchanged.
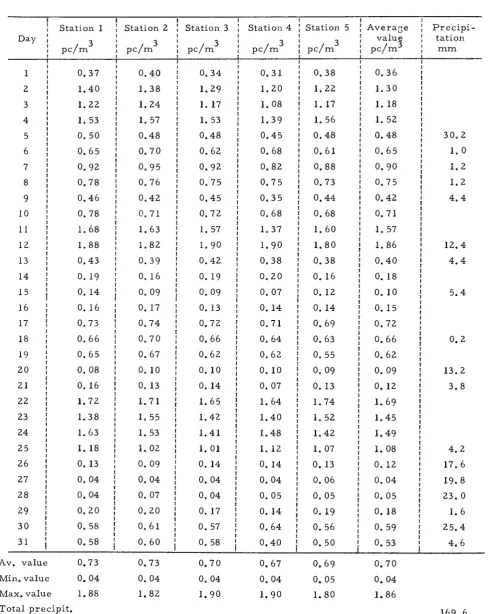
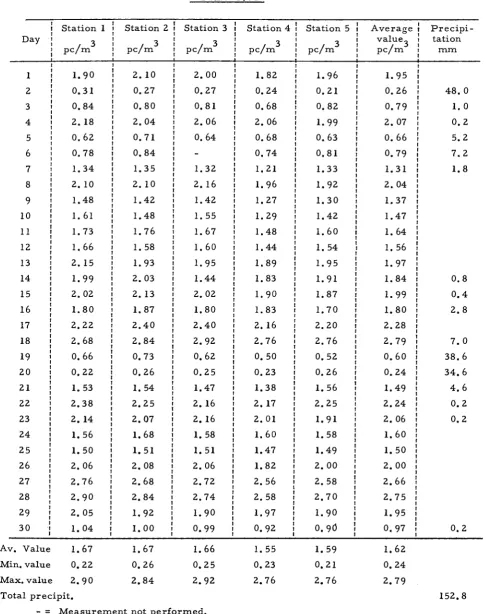
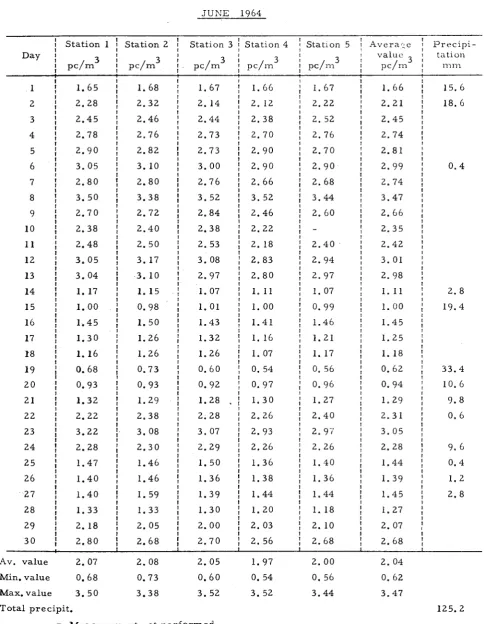
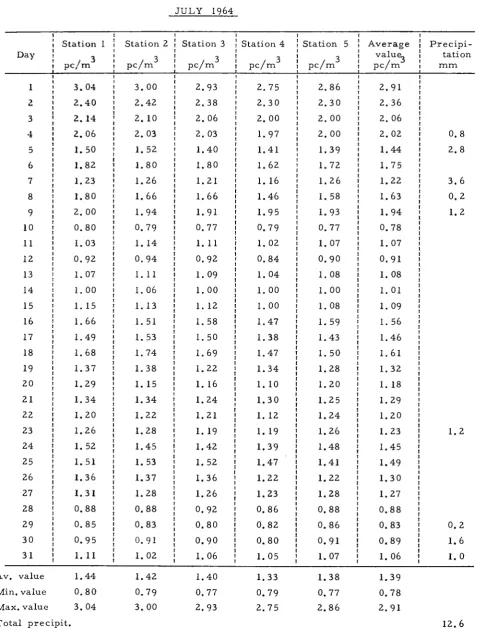
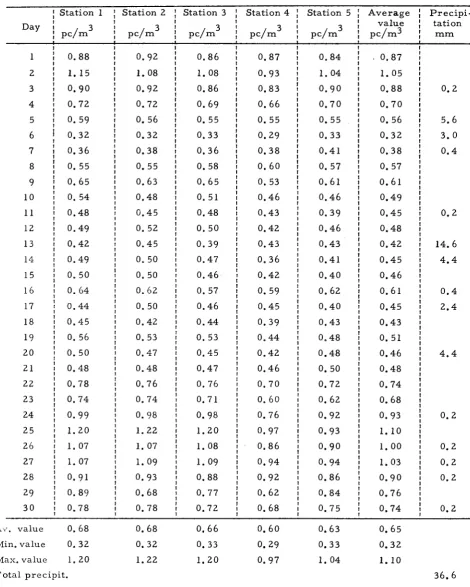
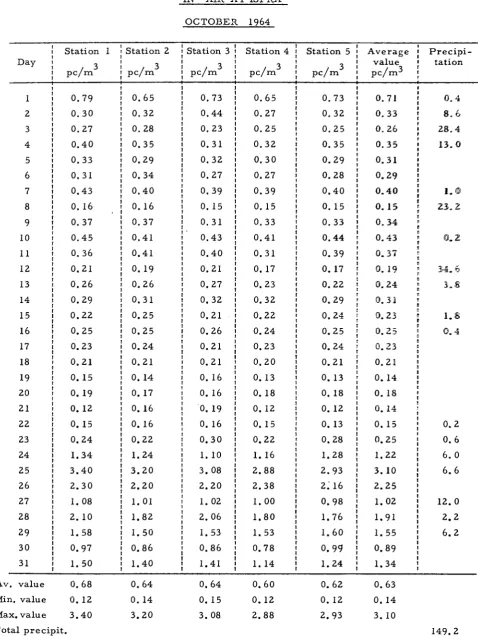
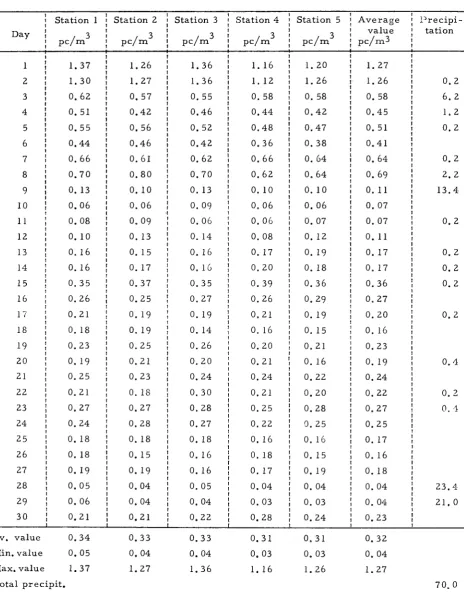
In T a b l e s 1 to 12 a r e r e p o r t e d the daily v a l u e s of g r o s s beta
r a d i o a c t i v i t y c o n c e n t r a t i o n s in a i r m e a s u r e d in each station and the daily
a v e r a g e v a l u e s . The l a t t e r a r e r e p r e s e n t e d in the h i s t o g r a m s of F i g u r e s ■2 1 and 2. The m a x i m u m daily v a l u e , a v e r a g e of the s t a t i o n s , 4 . 5 p c / m ,
o c c u r r e d on J a n u a r y 6; t h i s value is m o r e than 7 t i m e s lower than the
m a x i m u m value m e a s u r e d in 1963, which o c c u r r e d in J a n u a r y a l s o . The
i n c r e a s e in a i r r a d i o a c t i v i t y , which is noticed in the l a s t days of O c t o b e r ,
is due to the c h i n e s e b u r s t of the 16th of O c t o b e r . This b u r s t c a u s e d a l s o
a s m a l l c o n t a m i n a t i o n of h e r b a g e and milk.
R a d i o c h e m i c a l s e p a r a t i o n s of s t r o n t i u m 9 0 and c e s i u m 1 3 7
and g a m m a s p e c t r o m e t r y m e a s u r e m e n t s of other r a d i o n u c l i d e s have been
p e r f o r m e d on the monthly pooled s a m p l e s of a i r f i l t e r s . The r e s u l t s of
t h e s e m e a s u r e m e n t s a r e r e p o r t e d in Table 13, t o g e t h e r with the a v e r a g e
monthly v a l u e s of g r o s s beta r a d i o a c t i v i t y . A plot of s t r o n t i u m 9 0 and
c e s i u m 1 3 7 monthly a i r c o n c e n t r a t i o n s is given in F i g u r e 3.
F r o m the data it m a y be s e e n that:
i) the a v e r a g e a i r c o n c e n t r a t i o n of s t r o n t i u m 9 0 during 1964 h a s 14 / 3
been 3 . 0 χ 10 c / m , value l o w e r than that of 1963 by a f a c
t o r 1.7;
ii) the a v e r a g e f r a c t i o n of g r o s s beta r a d i o a c t i v i t y due to s t r o n
t i u m 9 0 and c e s i u m 1 3 7 in 1964 h a s been 6. 6%;
iii) the c e s i u m 1 3 7 to s t r o n t i u m 9 0 r a t i o (calculated on the y e a r
ly a v e r a g e values) h a s been 1. 50.
E n v i r o n m e n t a l r a d i a t i o n l e v e l s due to a r g o n 4 1 d i s c h a r g e d
f r o m the s t a c k of the I s p r a I R e a c t o r a r e m o n i t o r e d continuously at the
a r e a s u r v e y s t a t i o n s . As indicated in F i g u r e 9 t h e s e s t a t i o n s a r e on site
The highest radiation levels due to a r g o n - 4 I a r e r e c o r d e d at Station 2 (the closest and m o r e downwind to the Reactor) and the monthly values for the y e a r s 1963 and 1964 a r e r e p o r t e d in F i g u r e 3 b i s . The y e a r l y average exposure is about 3 m r e m , which is negligible compared to the natural radiation level of about 90 m r e m / y e a r m e a s u r e d on s i t e .
2. FALLOUT RADIOACTIVITY
2
Monthly samples of total (dry and wet) fallout a r e collected on a 4 m " a r e a and total beta and gamma s p e c t r o m e t r y m e a s u r e m e n t s as well as chemical separations a r e performed on the dry r e s i d u e obtained from evaporation.
G r o s s beta radioactivity, s t r o n t i u m 9 0 , cesium137 and s o -me other radionuclides deposited at I s p r a a r e given in Tables 14 and 15.
In F i g u r e 4 is r e p r e s e n t e d the h i s t o g r a m of g r o s s beta r a d i o -activity monthly deposition from F e b r u a r y 1958 through 1964. The same is made for strontium90 and cesium137 in F i g u r e s 5 and 6 r e s p e c t i v e ly; m o r e o v e r , in F i g u r e 5 is plotted the cumulative deposit of s t r o n t i u m -90, which at the end of 1964, attained the value of almost 120 m c / l v m . During I964 the s h o r t e r lived nuclides like s t r o n t i u m 8 9 , r u -thenium-103 and c e r i u m - 1 4 1 were no m o r e detectable, excepted a short period following the chinese b u r s t . In the month of December also the a-mount of zirconium-95 + niobium-95 became negligible.
Strontium-90 deposition, 22. 6 m c / K m , was about the half of that o c c u r r e d in 1963 and also precipitation was n e a r l y halved (IO6O m m against 1942 mm).
In order to m e a s u r e the fallout activation products having gamma radiations emitted in cascade a "sum. coincidence" s p e c t r o m e t e r was set up late in 1964 (2). Direct determination of radionuclides like sodium-22, cobalt-60, y t t r i u m - 8 8 and antimony-124 in fallout s a m p l e s was thus possible and their concentrations from 1963 through 1964 a r e r e p o r t e d in Table 15.
11
HERBAGE RADIOACTIVITY
Samples for the control of herbage radioactivity a r e collected in the following s i t e s : B a r z a , Brebbia, I s p r a , O s m a t e , Monvalle, Taino and Roccolo. The f i r s t four sites a r e also milk sampling points and the l a s t one is the hill on which is located building N. 51 (see F i g . 10). Mo-r e o v e Mo-r five sampling points a Mo-r e located within the E s t a b l i s h m e n t (see F i g . 9); additional s a m p l e s a r e collected whenever this is judged n e c e s -s a r y . Sample-s have been collected on a monthly b a -s i -s during the growing season and each sample (2 Kg fresh wt. ) is made up of s e v e r a l s u b s a m -p l e s , collected in different fields at each site, in order to obtain a good r e p r e s e n t a t i v i t y .
Samples a r e dried and submitted to gamma s p e c t r o m e t r y m e a -s u r e m e n t ; on an a-shed aliquot of each -sample chemical -separation-s of - strontium and c e s i u m and flame photometric determinations of calcium and p o -t a s s i u m a r e p e r f o r m e d . Only a few pho-tome-tric de-termina-tions of s-table strontium a r e made on pooled samples to take it into account in the calcu-lations of the chemical r e c o v e r i e s . The r e s u l t s of the m e a s u r e m e n t s together with the values of the fresh m a t t e r to dry m a t t e r weight r a t i o a r e r e ported in Table 16. F r o m the latter data the concentrations in fresh h e r b a -ge may be i n f e r r e d .
4. RADIOACTIVITY OF MILK AND DAIRY PRODUCTS
F o r the monitoring of the milk produced in the environs of the E s t a b l i s h m e n t samples a r e collected in the d a i r i e s of the four villages: B a r z a , Brebbia, I s p r a and Osmate (see map in F i g . 10) and, m o r e o v e r , for c o m p a r i s o n p u r p o s e s , in the two milk supply stations of V a r e s e and Milano. Two one l i t e r samples a r e collected weekly and the' m e a s u r e m e n t s a r e p e r f o r m e d on the pooled monthly s a m p l e s .
to 22 the data obtained a r e r e p o r t e d . A plot of s t r o n t i u m - 9 0 in the milk of the zone of I s p r a (average values of the four sites) and in that of Milano from I960 through 1964 is given in F i g u r e 7.
In F i g u r e 8 may be found a plot of sodium-22 a v e r a g e concen-tration in the milk of the zone of I s p r a from 1963 through 1964. These m e a s u r e m e n t s were p e r f o r m e d by d i r e c t g a m m a s p e c t r o m e t r y . More d e -tailed information on the movement of sodium-22 from fallout through food chains a r e given in a paper to be published (3).
Two s e r i e s of cheese samples were collected during 1964; p a r t of these samples were produced in Italy and p a r t abroad. Cheese s a m p l e s a r e submitted to the s a m e m e a s u r e m e n t s p e r f o r m e d on milk s a m p l e s . The data obtained a r e r e p o r t e d in Table 23.
5. RADIOACTIVITY OF WATERS
Waters a r e sampled on a monthly b a s i s in 23 points including lakes, s t r e a m s , wells and tapwater¿ Five l i t e r s a m p l e s a r e evaporated and beta counted; flame photometric m e a s u r e m e n t s of p o t a s s i u m on each sample a r e made to provide subtraction of beta radioactivity due to p o t a s s i u m - 4 0 . In Table 24 a r e given the geographic coordinates of the sampling points and in Tables 25 and 26 the radioactivity data for the lake " M a g g i o r e " and the other points r e s p e c t i v e l y .
Q u a r t e r l y collections of l a r g e volumes of water (400 to 500 l i ters) a r e performed in the four n e a r e s t lakes to the E s t a b l i s h m e n t , in o r -der to m e a s u r e the concentrations of s t r o n t i u m - 9 0 , cesium-137 and other radionuclides. The data obtained a r e r e p o r t e d in Tables 27 and 28. Making a comparison of strontium-90 and cesium-137 concentrations with those found in 1963 it may be noticed that both radionuclides have not appreciably
decreased, despite the m a r k e d reduction in fallout r a t e . Moreover a c e -sium-137 to strontium-90 ratio of roughly 1, or s m a l l e r , is constantly ob-served in lake w a t e r s .
13
6. STRONTIUM-90 AND CESIUM-137 IN FISHES
Q u a r t e r l y 2. 5 Kg samples of three fish species a r e taken in the four n e a r e s t lakes whenever made available by f i s h e r s . Samples a r e sub-mitted to the s a m e p r o c e d u r e adopted for milk s a m p l e s . In Tables 29 to 32 the data obtained a r e r e p o r t e d .
7. STRONTIUM-90 IN CALF-BONES
F e m o u r samples of 39 calves, about two months old and milk fed, have been collected and their strontium-90 content has been m e a s u r e d .
The data a r e r e p o r t e d in Table 33.
Strontium-90 levels during 1964 have been about the s a m e found late in 1963.
8. STRONTIUM-90 AND CESIUM-137 IN VEGETABLES
Vegetables from the most important production zones of Italy a r e sampled fortnightly at the m a r k e t of Milano.
Each sample dried and ground is submitted to g a m m a s p e c t r o m e t r y m e a s u r e m e n t , whereas chemical separations of strontium and c e -sium a r e p e r f o r m e d on the y e a r l y pooled samples of each s p e c i e s .
The r e s u l t s of the m e a s u r e m e n t s a r e r e p o r t e d in Table 34.
9. SOIL RADIOACTIVITY
p r o c e d u r e s and y t t r i u m 9 0 daughter beta counted. Cesium137 is s e p a r a -ted by adsorption on ammonium phosphomolybdate layer (5) and m e a s u r e d by gamma s p e c t r o m e t r y .
Calcium and potassium determinations a r e p e r f o r m e d by fla-me photofla-metry on sample aliquots dissolved in hydrofluoric acid.
The data obtained a r e r e p o r t e d in Table 3 5.
15
R E F E R E N C E S
(1) P . GAGLIONE, C. GANDINO, A. MALVICINI " C o n s i d e r a -zioni meteorologiche sulla diffusione d e l l ' a r g o n - 4 1 ad I s p r a ". Ingegneria Nucleare 5_, 5 - 1964.
(2) M, de BORTOLI, P . GAGLIONE, A. MALVICINI " Fallout Concentrations of some Radionuclides from 1963 through 1964 ". Nuclear I n s t r u m e n t s and Methods, to be published.
(3) M. de BORTOLI, P . GAGLIONE, A. MALVICINI " Some Data and Comments on Sodium22 in Food Chains ". Health P h y -s i c -s , to be publi-shed.
(4) M. de BORTOLI, P . GAGLIONE, A. MALVICINI, E . VAN DER STRICHT "Radioattività del suolo a I s p r a : m i s u r a e r i s u l t a t i ". In p r e p a r a t i o n .
C O N C E N T R A T I O N S O F G R O S S B E T A R A D I O A C T I V I T Y
I N A I R A T I S P R A
J A N U A R Y 1 9 6 4
D a y
1 2 3 4 5 6 7 8 9 10 11 12 13 14 15 16 17 18 19 20 2 1 22 23 24 2 5 26 27 28 2 9 30 3 1
S t a t i o n 1 / 3
p c / m 2 . 0 5 1 . 9 8 1 . 5 6 1 . 3 8 1 . 9 6 4 . 6 2 4 . 5 0 2 . 9 4 3 . 06 2 . 6 7 0 . 7 6 0. 08 0. 10 0. 14 0 . 3 6 1 . 0 8 1 . 4 6 1 . 6 2 2 . 2 8 2 . 2 3 2 . 5 4 3 . 5 4 2 . 9 5 2 . 6 6 2 . 6 0 1.57 2 . 10 2 . 2 5 2 . 02
1 . 8 0 1 . 6 6
S t a t i o n 2 / 3
p c / m
2 . 13 1 . 8 8 1 . 4 8 1 . 2 5 2 . 3 8 4 . 9 0 4 . 6 0 2 . 9 8 2 . 8 0 2 . 4 5 0 . 6 8 0. 10 0. 03 0 . 0 9 0 . 2 3 1. 00 1 . 3 5 1. 55 2 . 3 2 2 . 4 2 1 . 2 3 3 . 6 0 3 . 0 7 2 . 6 0 2 . 6 0 1. 53 2 . 0 0 2 . 5 4 2 . 0 4 1 . 6 6 1 . 8 2
S t a t i o n 3 / 3 p c / m
1 . 9 7 1 . 9 8 1 . 3 8 1 . 3 3 2 . 18 4 . 60 4 . 4 8 2 . 8 3 2 . 8 6 2 . 5 0 0 . 6 9 0. 10 0. 06 0 . 3 2 1. 04 1 . 3 7 1 . 5 9 2 . 3 1 1.ΕΓ5 1 . 1 6 3 . 06 2 . 6 2 2 . 5 6 ï . 58 2 . 13 2 . 3 5 2 . 05 1 . 9 5 1 . 8 0
S t a t i o n 4 / 3 p c / m
1 . 8 8 1 . 9 5 1 . 3 7 1. 07 1 . 7 0 3 . 9 5 3 . 6 5 2 . 5 3 2 . 55 2 . 4 1 0 . 7 0 0 . 0 4 0. 04 0 . 3 0 0 . 8 5 1 . 3 0 1 . 4 4 2 . 18 1 . 7 6 1 . 3 0 3 . 4 0 2 . 8 0 2 . 4 0 2 . 5 5 1 . 4 6 1 . 7 0 2 . 2 5 1 . 8 5 1. 15 1 . 6 0
S t a t i o n 5 / 3
p c / m 1 . 7 0 1 . 8 8 1 . 3 8 I . 15 1 . 9 2 4 . 2 4 4 . 1 7 2 . 6 6 2 . 7 3 2 . 3 6 0 . 7 0 0. 10 0 . 0 9 0 . 3 4 0 . 9 7 1 . 4 8 2 . 18 1 . 9 5 1 . 2 1 3 . 55 2 . 8 0 2 . 5 1 2 . 6 0 1 . 5 0 2 . 2 6 2 . 0 0 1. 53 1 . 7 4
A v e r a g e v a l u e , p c / m
1 . 9 4 1 . 9 3 1 . 4 3 1 . 2 3 2 . 02 4 . 4 6 4 . 2 8 2 . 7 8 2 . 8 0 2 . 4 7 0 . 7 0 0 . 0 8 0 . 0 6 0 . 0 9 0 . 3 1 0 . 9 8 1 . 3 7 1 . 5 3 2 . 2 5 2 . 04
1 . 4 8 3 . 5 2 2 . 9 3 2 . 5 5 2 . 58 1 . 5 2 1 . 9 8 2 . 3 5 1 . 9 9 1 . 6 2 1 . 7 2
P r e c i p i t a t i o n
m m
1.6 8 . 4 1 5 . 8 1 4 . 4 0 . 4
A v . v a l u e M i n . v a l u e M a x . v a l u e T o t a l p r e c
2 . 01 0 . 0 8 4 . 6 2 i p i t .
1.97 0 . 0 3 4 . 9 0
= M e a s u r e m e n t n o t pc ¡ r £ 1 . 9 5 0 . 0 6 4 . 6 0
a r m e d .
1 . 8 0 0. 04 3 . 9 5
1 . 9 1 0 . 0 9 4 . 2 4
1 . 9 0 0 . 0 6 4 . 4 6
D a y 1 2 3 4 5 6 7 8 9 10 11 12 13 14 15 16 17 18 19 20 21 22 23 24 25 26 27 28 29 Av. value Min. valu Max. valu Total p r e
[image:21.595.45.523.89.750.2]17
CONCENTRATIONS OF GROSS BETA RADIOACTIVITY
Station 1 / 3 p c / m
1.93 3.08 2.32 2.62 1.22 1.19 0.85 1.46 2.09 1.14 1.43 1.05 1. 14 1.09 0.62 0.50 0.07 0.35 1.38 1.60 2.48 2 . 1 4 2. 18 2.30 0.70 0.33 0.13 0.20 0.05 1.29 3 0.05 e 3.08 cipit. Station 2 / 3 p c / m
2.00 3.00 2. 10 2.72 2 . 3 0 1.14 0.83 1.37 2.06 1.06 1.46 0.88 1. 14 1.08 0.63 0.52 0.06 0.32 1.34 1.48 2 . 3 5 2 . 0 8 2 . 2 5 2.07 0.60 0. 12 0. 12 0. 18 0.04 1.28 0.04 3.00
IN AIR AT ISPRA
FEBRUARY 1964
Station 3 / 3 p c / m
1.90 2.97 2 . 2 0 2.87 2. 16
1.15 0.90 1.40 2 . 0 5 1. 12 1.47 0.92 1.08 1.06 0.64 0.52 0.04 0.34 1.40 1.53 2.50 2.20 2. 17 2.12 0.73 0.40 0.16 0. 16 0.07 1.31 0.04 2.97 Station 4
p c / m
1.74 2.72 2. 08 2.55 2.05 1. 10 0.80 1.30 2 . 0 5 I. 00 1.34 0.97 1. 10 1.00 0.51 0.47 0.04 0.23 0.95 1.44 2.27 1.94 2.00 2. 12 0.64 0.33 0. 13 0.18 0.04 1.21 0.04 2.72 Station 5
p c / m
1.90 2 . 9 0 2 . 2 0 2.50 2. 12 1.29 0.85 1.39 1.98 1. 16 0.90 1.02 1.14 0.96 0. 56 0.50 0.04 0.23 I . 18 1.56 2.37 2. 10 2.06 2. 03 0.73 0.35 0. 14 0. 18 0.05 1.25 0.04 2 . 9 0
Average value, p c / m
1.89 2.93 2.18 2 . 6 5 1.97 1.17 0.84 1.38 2.04 1.09 1.32 0.97 1.12 1.04 0.59 0.50 0.05 0.29 1.25 1.52 2.39 2.09 2 . 1 3 2.13 0.68 0.30 0. 13 0.18 0.05 1.27 0.05 2.93 Table 2
P r e c i p i -tation m m
14.6
1.2
11.6
0 . 8
1.8
2 0 . 2
0 . 8 3 . 0 3 . 6
16.6
CONCENTRATIONS OF GROSS B E T A RADIOACTIVITY
D a y
1 2 3 4 5 6 7 8 9 10 11 12 13 14 15 16 17 18 19 20 2 1 22 23 24 2 5 26 27 28 29 3 0 3 1
Station 1 / 3
p c / m
0.37 1.40 1.22 1.53 0 . 5 0 0 . 6 5 0.92 0.78 0.46 0.78 1.68 1.88 0.43 0. 19 0. 14 0. 16 0.73 0.66 0 . 6 5 0. 08 0. 16 1.72 1.38 1.63 1. 18 0. 13 0 . 0 4 0 . 0 4 0 . 2 0 0. 58 ! 0.58
! Station 2 / 3
I p c / m
0 . 4 0 1.38 1.24 1.57 0.48 0.7 0 0 . 9 5 0.76 0.42 0 . 7 1 1.63 1.82 0.39 0. 16 0. 09 0. 17 0 . 7 4 0 . 7 0 0.67 0. 10 0. 13 1.71 1.55 1.53 1.02 0.09 0 . 0 4 0.07 ¡ 0.20 ] 0.61 J 0 . 6 0 j
IN AIR ΑΊ MARCH
[ Station 3 / 3 ι p c / m
0.34 1.29 1. 17 1.53 0.48 0.62 0.92 0.75 0.45 0.72 1.57 1.90 0.42 0. 19 0.09 0. 13 0.72 0.66 0.62 0. 10 0. 14 1.65 1.42 1.41 1.01 0. 14 0.04 0. 04 0. 17 ¡ 0.57 0. 58 j
ISPRA 1964
¡ Station 4 ! / 3
ι p c / m ; 0 . 3 1 j 1.20
1.08 1.39 0 . 4 5 0.68 0.82 0 . 7 5 0 . 3 5 0.68 1.37 1.90 0.38 0 . 2 0 0. 07 0. 14 0 . 7 1 0 . 6 4 0.62 0. 10 0.07 1.64 1.40 1.48 1. 12 0. 14 0 . 0 4 0 . 0 5 0. 14 j 0 . 6 4 0.40
\ Station 5 I ι p c / m / 3
| 0.38 | 1.22 1.17 1.56 0 . 4 8 0 . 6 1 0.88 0.73 0 . 4 4 0.68 1.60 1.80 0.38 0. 16 0. 12 0. 14 0.69 0.63 0. 55 0.09 0. 13 1.74 1.52 1.42 I . 07 0. 13 0.06 0 . 0 5 0. 19 0.56 0 . 5 0 j
\ A v e r a g e
\ value ¡ p c / m ; 0.36 | 1.30 1. 18 1. 52 0.48 0 . 6 5 0 . 9 0 0 . 7 5 0.42 0 . 7 1 1. 57 1.86 0 . 4 0 0. 18 0. 10 0. 15 0. 72 0.66 0.62 0 . 0 9 0. 12 1.69 1.45 1.49 1.08 0. 12 0 . 0 4 0 . 0 5 ; 0. 18 0.59 ¡ 0 . 5 3
¡ P r e c i p i
\ tation
] m m
3 0 . 2
1 . 0 1.2 1.2 4 . 4
1 2 . 4
4 . 4
5 . 4
0 . 2
13.2
3 . 8
4 . 2
17.6 1 9 . 8 2 3 . 0
1.6
2 5 . 4
4 . 6
Av. value Min, value M a x . value Total p r e c i p i t .
0.73 0 . 0 4 1.88
0.73 0 . 0 4 1.82
0.7 0 0 . 0 4 1.90
0.67 0 . 0 4 1.90
0 . 6 9 0. 05 1.80
0 . 7 0 0 . 0 4 1.86
[image:22.595.64.554.136.751.2]19 T a b l e 4
C O N C E N T R A T I O N S O F G R O S S B E T A R A D I O A C T I V I T Y I N A I R A T I S P R A
A P R I L 1964
D a y
1 2 3 4 5 6 7 8 9 10 11 12 13 14 15 16 17 18 19 2 0 2 1 22 23 24 2 5 26 27 28 29 30 ·■
ι S t a t i o n 1
' / 3
ι p c / m
1 . 9 0 0 . 3 1 0 . 8 4 2 . 18 0 . 6 2 0 . 7 8 1 . 3 4 2 . 10 1 . 4 8 1 . 6 1 1 . 7 3 1 . 6 6 2 . 15 1 . 9 9 2 . 0 2 1 . 8 0 2 . 2 2 2 . 6 8 0 . 6 6 0 . 2 2 1 . 5 3 2 . 3 8 2 . 1 4 1 . 5 6 1 . 5 0 2 . 0 6 2 . 7 6 2 . 9 0 2 . 0 5 1 . 0 4
ι S t a t i o n 2
' / 3
ι p c / m
2 . 10 0 . 2 7 0 . 8 0 2 . 0 4 0 . 7 1 0 . 8 4 1 . 3 5 2 . 10
1 . 4 2 1 . 4 8 1 . 7 6 1 . 5 8 1 . 9 3 2 . 0 3 2 . 13 1 . 8 7 2 . 4 0 2 . 8 4 0 . 7 3 0 . 2 6 1 . 5 4 2 . 2 5 2 . 0 7 1 . 6 8 1 . 5 1 2 . 0 8 2 . 6 8 2 . 8 4 ¡ 1 . 9 2 1 . 0 0 j
ι S t a t i o n 3
' / 3
ι p c / m
! 2 . 0 0 0 . 2 7 0 . 8 1 2 . 0 6 0 . 6 4 1 . 3 2 2 . 16
1 . 4 2 1 . 5 5 1 . 6 7 1 . 6 0 1 . 9 5 1 . 4 4 2 . 0 2 1 . 8 0 2 . 4 0 2 . 9 2 0 . 6 2 0 . 2 5 1 . 4 7 2 . 16 2 . 16 1 . 5 8 1 . 5 1 j 2 . 0 6 j 2 . 7 2 2 . 7 4 1 . 9 0 | 0 . 9 9
ι S t a t i o n 4
' / 3
ι p c / m
1 . 8 2 0 . 2 4 0 . 6 8 2 . 0 6 0 . 6 8 0 . 7 4 1 . 2 1 1 . 9 6 1 . 2 7 1 . 2 9 1 . 4 8 1 . 4 4 1 . 8 9 1 . 8 3 1 . 9 0 1 . 8 3 2 . 16 2 . 7 6 0 . 5 0 0 . 2 3 1 . 3 8 2 . 17 2 . 0 1 1 . 6 0 1 . 4 7 1 . 8 2 2 . 5 6 2 . 5 8 1 . 9 7 ! 0 . 9 2
ι S t a t i o n 5
' / 3
ι p c / m
1 . 9 6 0 . 2 1 0 . 8 2 1 . 9 9 0 . 6 3 0 . 8 1 1 . 3 3 1 . 9 2 1 . 3 0 1 . 4 2 1 . 6 0 1 . 5 4 1 . 9 5 1 . 9 1 1 . 8 7 1 . 7 0 2 . 2 0 2 . 7 6 0 . 5 2 0 . 2 6 1 . 5 6 2 . 2 5 1 . 9 1 1 . 5 8 1 . 4 9 2 . 0 0 2 . 5 8 2 . 7 0 !
1 . 9 0 0 . 9 Ö
ι A v e r a g e ι v a l u e ! p c / m
1 . 9 5 0 . 2 6 0 . 7 9 2 . 07 0 . 6 6 0 . 7 9 1 . 3 1 2 . 0 4 1 . 3 7 1 . 4 7 1 . 6 4 1 . 5 6 1 . 9 7 1 . 8 4 1 . 9 9 1 . 8 0 2 . 2 8 2 . 7 9 0 . 6 0 0 . 2 4 1 . 4 9 2 . 2 4 2 . 06 1 . 6 0 1 . 5 0 2 . 0 0 ! 2 . 6 6 2 . 7 5 1 . 9 5 ! 0 . 9 7
ι P r e c i p i i t a t i o n
m m
4 8 . 0 1 . 0 0 . 2 5 . 2 7 . 2 1 . 8
0 . 8 0 . 4 2 . 8
7 . 0 3 8 . 6 3 4 . 6 4 . 6 0 . 2 0 . 2
0 . 2 A v . V a l u e 1 . 6 7
M i n . v a l u e 0 . 2 2 M a x . v a l u e 2 . 9 0 T o t a l p r e c i p i t .
= M e a s u r e m e n t n o t p e r f o r m e d 1 . 6 7
0 . 2 6 2 . 8 4
1 . 6 6 0 . 2 5 2 . 9 2
1 . 5 5 0 . 2 3 2 . 7 6
1 . 5 9 0 . 2 1 2 . 7 6
1 . 6 2 0 . 2 4 2 . 7 9
[image:23.595.45.532.125.740.2]CONCENTRATIONS OF GROSS BETA RADIOACTIVITY
IN AIR AT ISPRA
MAY 1964
D a y
1 2 3 4 5 6 7 8 9 10 11 12 13 14 15 16 17 18 19 20 21 22 23 24 25 26 27 28 29 30 31 Station 1
/ 3
p c / m 1. 56 2. 50 2.44 2.40 2. 18 2.40 1.97 2. 17 1.49 1.94 1.79 1.90 2.68 2. 18 1.89 3 . 15 2. 50 3. 10 3. 06 1.90 1.94 1.78 1.98 1.91 0.76 2.20 1.71 1.22 1.36 1.42 1. 54 Station 2
/ 3
p c / m
1.52 2.48 2. 18 2.43 2.24 2.40 1.94 2.22 1.47 1.96 1.92 1.85 2.50 2. 08 1.96 3.44 2.64 3.20 3.07 1.93 2. 18 1.92 2, 08 2. 14 0.79 2.20 1.80 1.24 1.41 1.46 1.61 Station 3 / 3 p c / m
1.47 2.44 2.38 2.50 2.04 2.56 1.93 2. 18 1.42 1.87 1.75 1.84 2. 52 2. 06 1.86 3.34 2.73 3. 16 3. 00 1.84 1.83 1.83 1.88 1. 97 0.74 2. 18 1.62 1.21 -Station 4
/ 3
p c / m 1.42 2.20 2. 14 2.22 2.30 2. 18 1.80 2.03 1.38 1.75 1.72 1. 58 2.30 2. 01 1.96 3. 03 2.23 3.00 3. 00 1.82 1.91 1.94 2. 08 2. 02 0.77 1.93 1. 60 1. 12 1. 07 1.26 1. 59 Station 5 / 3 p c / m
1. 56 2.22 2.28 2.32 2.24 2.26 1.91 2.03 1.43 1.82 1.79 1.64 2 . 4 0 2. 04 1.95 3 . 05 2,42 3. 08 2.90 1.86 1.86 1.84 2. 05 2. 14 0.75 2. 10 1.67 1. 17 1.28 1.33 1.60
A v e r a g e value p c / m3
1. 50 2.37 2.28 2.37 2.20 2.36 1.91 2. 13 1.44 1.87 1.79 1.76 2.48 2. 08 1.93 3 . 2 0 2.50 3. 11 3 . 0 1 1.87 1.94 1.86 2 . 0 1 2. 04 0.76 2. 12 1.68 1. 19 1.28 1.36 1. 58
P r e c i p i -tation
m m 1. 0
0 . 2
16.4
1.2 0 . 2
0 . 2
1.0
3 4 . 8
9 . 0 2 . 6 0 . 2
1.6
Av. value 2. 04 Min. value 0.76 Max. value 3.15 Total p r e ci pit.
- - M e a s u r e m e n t not p e r f o r m e d 2.08
0.79 3.44
2.0.8 0.74 3 . 3 4
1.92 0.77 3. 03 1,97 0.75 3. 08
2 . 0 0 0.76 3 . 2 0
[image:24.595.68.567.124.746.2]21 T a b l e ó C O N C E N T R A T I O N S O F G R O S S B E T A R A D I O A C T I V I T Y
IN A I R A T I S P R A
J U N E 1964
D a y
1 2 3 4 5 6 7 8 9 10 11 12 13 14 15 16 17 18 19 20 2 1 22 23 2 4 2 5 26 2 7 28 29 3 0 1
S t a t i o n 1 / 3 p c / m
1 . 6 5 2 . 2 8 2 . 4 5 2 . 7 8 2 . 9 0 3 . 0 5 2 . 8 0 3 . 5 0 2 . 7 0 2 . 3 8 2 . 4 8 3 . 0 5 3 . 0 4 1. 17 1 . 0 0 1 . 4 5 1 . 3 0 1. 16 0 . 6 8 0 . 9 3 1 . 3 2 2 . 2 2 3 . 2 2 2 . 2 8 1 . 4 7 1 . 4 0 1 . 4 0 1 . 3 3 2 . 18 2 . 8 0
1
S t a t i o n 2 / 3 p c / m
1 . 6 8 2 . 3 2 2 . 4 6 2 . 7 6 2 . 8 2 3 . 10 2 . 8 0 3 . 3 8 2 . 7 2 2 . 4 0 2 . 5 0 3 . 17 3 . 10 1. 15 0 . 9 8 1 . 5 0 1 . 2 6 1 . 2 6 0 . 7 3 0 . 9 3 1 . 2 9 2 . 3 8 3 . 08 2 . 3 0 1 . 4 6 1 . 4 6 1 . 5 9 1 . 3 3 2 . 05 2 . 6 8
S t a t i o n 3 / 3 . p c / m
1.67 2 . 14 2 . 4 4 2 . 7 3 2 . 7 3 3 . 0 0 2 . 7 6 3 . 5 2 2 . 8 4 2 . 3 8 2 . 5 3 3 . 08 2 . 9 7 1. 07 1 . 0 1 1 . 4 3 1 . 3 2 1 . 2 6 0 . 6 0 0 . 9 2 1 . 2 8 , 2 . 2 8 3 . 07 2 . 2 9 1 . 5 0 1 . 3 6 1 . 3 9 1 . 3 0 2 . 0 0 2 . 7 0
S t a t i o n 4 / 3 p c / m
1 . 6 6 2 . 12 2 . 3 8 2 . 70 2 . 9 0 2 . 9 0 2 . 6 6 3 . 52 2 . 4 6 2 . 2 2 2 . 18 2 . 8 3 2 . 8 0 1. 11 1. 00 1 . 4 1 1. 16 1. 07 0. 54 0 . 9 7 1 . 3 0 2 . 2 6 2 . 9 3 2 . 2 6 1 . 3 6 1 . 3 8 1 . 4 4 1 . 2 0 2 . 0 3 2 . 5 6
S t a t i o n 5 / 3 p c / m
1.67 2 . 2 2 2 . 52 2 . 76 2 . 7 0 2 . 90 2 . 6 8 3 . 4 4 2 . 60 2 . 4 0 ■ 2 . 94 2 . 97 1. 07 0 . 9 9 1 . 4 6 1 . 2 1 1. 17 0. 56 0. 96 1.27 2 . 4 0 2 . 9 7 2 . 26 1 . 4 0 1 . 3 6 1 . 4 4 1. 18 2 . 10 2 . 6 8
A v e r a g e v a l u e ,
p c / r n
1 . 6 6 2 . 2 1 2 . 4 5 2 . 7 4 2 . 8 1 2 . 9 9 2 . 7 4 3 . 4 7 2 . 6 6 2 . 3 5 2 . 4 2 3 . 01 2 . 9 8
1. 11 1. 00 1 . 4 5 1 . 2 5 1. 18 0 . 6 2 0 . 9 4 1 . 2 9 2 . 3 1 3 . 05 2 . 2 8
1 . 4 4 1 . 3 9 1 . 4 5 1 . 2 7 2 . 0 7 2 . 6 8
P r e c i p i t a t i o n
m m
1 5 . 6 1 8 . 6
0 . 4
2 . 8 1 9 . 4
3 3 . 4 1 0 . 6 9 . 8 0 . 6
9 . 6 0 . 4 1.2 2 . 8
A v . v a l u e M i n . v a l u e M a x . v a l u e T o t a l p r e c
2 . 0 7 0 . 6 8 3 . 5 0 i p i t .
2 . 0 8 0 . 7 3 3 . 3 8
= M e a s u r e m e n t n o t p e r f o 2 . 0 5 0 . 6 0 3 . 5 2
r m e d .
1 . 9 7 0. 54 3 . 5 2
2 . 00 0 . 56 3 . 4 4
2 . 04 0. 62 3 . 4 7
[image:25.595.48.533.110.735.2]CONCENTRATIONS OF GROSS BETA RADIOACTIVITY
IN AIR AT ISPRA
JULY 1964 Day 1 2 3 4 5 6 7 8 9 10 11 12 13 14 15 16 17 18 19 20 21 22 23 24 25 26 27 28 29 30 31 Station 1
/ 3
p c / m 3.04 2.40 2 . 1 4 2.06 1.50 1.82 1.23 1.80 2.00 0.80 1.03 0.92 1.07 1. 00 1. 15 1.66 1.49 1.68 1.37 1.29 1.34 1.20 1.26 1.52 1.51 1.36 1.31 0.88 0.85 0.95 1. n Station 2 / 3 p c / m
3.00 2.42 2. 10 2.03 1.52 1.80 1.26 1.66 1.94 0.79 1.14 0.94 1. 11 1.06 1. 13 1.51 1.53 1.74 1.38 1. 15 1.34 1.22 1.28 1.45 1.53 1.37 1.28 0.88 0.83 0.91 1.02 Station 3 / 3 p c / m
2.93 2.38 2.06 2. 03 1.40 1.80 1.21 1.66 1.91 0.77 1. 11 0.92 1.09 1.00 1. 12 1.58 1. 50 1.69 1.22 1. 16 1.24 1.21 1.19 1.42 1.52 1.36 1.26 0.92 0.80 0.90 1.06 Station 4 / 3 p c / m
2.75 2.30 2. 00 1.97 1.41 1.62 1. 16 1.46 1.95 0.79 1. 02 0.84 1. 04 1. 00 1. 00 1.47 1.38 1.47 1.34 1. 10 1.30 1. 12 1.19 1.39 1.47 1.22 1.23 0.86 0.82 0.80 1.05 Station 5
/ 3
p c / m
2.86 2.30 2.00 2. 00 1.39 1.72 1.26 I. 58 1.93 0.77 1.07 0.90 1. 08 1.00 1. 08 1.59 1.43 1.50 1.28 1.20 1.25 1.24 1.26 1.48 1.41 1.22 1.28 0.88 0.86 0.91 1.07 Average value, p c / m
2 . 9 1 2.36 2.06 2.02 1.44 1.75 1.22 1.63 1.94 0.78 1.07 0.91 1. 08 I. 01 1. 09 1.56 1.46 1.61 1.32 1. 18 1.29 1.20 1.23 1.45 1.49 1.30 1.27 0.88 0.83 0.89 1.06
P r e c i p i -tation m m
0 . 8 2 . 8
3 . 6 0 . 2 1.2
1.2
0 . 2 1.6 1.0
Av. value 1.44 1.42 1.40 1.33 1.38 1.39 Min. value 0.80 0.79 0.77 0.79 0.77 0.78 Max. value 3.04 3.00 2.93 2.75 2.86 2 . 9 1
[image:26.595.72.551.117.753.2]23 Table 8
CONCENTRATIONS OF GROSS BETA RADIOACTIVITY
IN AIR AT ISPRA
AUGUST 1964
D a y
1 2 3 4 5 6 7 8 9 10 11 12 13 14 15 16 17 18 19 20 21 22 23 24 25 26 27 28 29 30 31 Station 1 / 3 p c / m
1.46 0.60 1.00 1.72 1.66 1.72 1.36 1.27 0.94 0.64 0.90 0.80 1.02 1.00 0. 52 0.58 0.68 0.56 0.54 0.57 0.34 0. 52 0.36 0.58 0.90 1. 13 1. 02 0.90 0.70 0.60 0.68 Station 2 / 3 p c / m
1.44 0.56 1.04 1.65 1.66 1.72 1.36 1.28 0.98 0.60 0.89 0.78 1. 04 1.00 0.45 0. 54 0.65 0. 52 0.57 0.58 0.30 0. 56 0.29 0. 62 0.90 1. 13 0.95 0.89 0. 60 0.61 0.68 Station 3
/ 3
p c / m
1.46 0.55 1.04 1.62 1.62 1.63 1.42 1.28 0.91 0.61 0.85 0.80 1. 06 0.98 0.46 0.62 0.65 0.50 -0.54 0.32 0. 50 0.31 0.58 0.86 1. 10 1.02 0.98 0.69 0.58 0.63 Station 4 / 3 p c / m
1.30 0.54 0.93 1.56 1.58 1. 58 1.35 1.23 0.82 0. 61 0.82 0.74 1.02 0.90 0.40 0.48 0.58 0.51 0. 50 0.54 0.32 0. 50 0.32 0.55 0.78 0.97 0.94 0.81 0.62 0. 62 0.64 Station 5 / 3 p c / m
1.40 0.52 0.98 1.60 1.53 1.60 0.90 1.28 0.94 0.62 0.80 0.79 1.09 0.96 0.42 0. 52 0.64 0.53 0. 58 0.50 0.30 0.50 0.31 0. 57 0.81 1.02 0.93 0.84 0.64 0.60 0.78
A v e r a g e value p c / m3
1.41 0.55 1.00 1.63 1.61 1.65 1.28 1.27 0.92 0.62 0.85 0.78 1. 04 0.97 0.45 0. 55 0.64 0.52 0.54 0. 54 0.31 0.51 0.32 0. 58 0.85 1.07 0.97 0.88 0.65 0.60 0.68
P r e c i p i -tation
m m
0 . 2
21.2
1.8
2 . 2
17.4
0 . 2
24.8
0 . 2
18.2
0 . 2
0 . 2
0 . 2
14.2
0 . 2
Av. value 0. 88 Min. value 0. 34 f
Max. value 1.72 Total p r e c i p i t .
[image:27.595.48.524.140.738.2]CONCENTRATIONS OF GROSS BETA RADIOACTIVITY
IN AIR AT ISPRA
S E P T E M B E R 1964
D a y
1 2 3 4 5 6 7 8 9 10 11 12 13 14 15 16 17 18 19 20 21 22 23 24 25 26 27 28 29 30 Station 1
/ 3
p c / m
0.88 1.15 0.90 0.72 0.59 0.32 0.36 0. 55 0.65 0. 54 0.48 0.49 0.42 0.49 0.50 0. 64 0.44 0.45 0. 56 0.50 0.48 0.78 0.74 0.99 1.20 1. 07 1. 07 0.91 0.89 0.78 Station 2 / 3 p c / m
0.92 1.08 0.92 0.72 0.56 0.32 0.38 0.55 0.63 0.48 0.45 0. 52 0.45 0. 50 0. 50 0.62 0. 50 0.42 0.53 0.47 0.48 0.76 0.74 0.98 1.22 1. 07 1.09 0.93 0.68 0.78 Station 3
/ 3
p c / m
0.86 1.08 0.86 0.69 0.55 0.33 0.36 0.58 0.65 0.51 0.48 0.50 0.39 0.47 0.46 0.57 0.46 0.44 0.53 0.45 0.47 0.76 0.71 0.98 1.20 1.08 1.09 0.88 0.77 0.72 Station 4
/ 3
p c / m
0.87 0.93 0.83 0.66 0.55 0.29 0.38 0.60 0.53 0.46 0.43 0.42 0.43 0.36 0.42 0.59 0.45 0.39 0.44 0.42 0.46 0.70 0.60 0.76 0.97 0.86 0.94 0.92 0.62 0.68 Station 5 / 3 p c / m
0.84 1.04 0.90 0.70 0.55 0.33 0.41 0.57 0.61 0.46 0.39 0.46 0.43 0.41 0.40 0.62 0.40 0.43 0.48 0.48 0.50 0.72 0.62 0.92 0.93 0.90 0.94 0.86 0.84 0.75
A v e r a g e value p c / m3
. 0.87 1.05 0.88 0.70 0.56 0.32 0.38 0.57 0.61 0.49 0.45 0.48 0.42 0.45 0.46 0.61 0.45 0.43 0.51 0.46 0.48 0.74 0.68 0.93 1. 10 1.00 1.03 0.90 0.76 0.74
P r e c i p i -tation
m m
0 . 2
5 . 6 3 . 0 0 . 4
0 . 2
14.6
4 . 4
0 . 4 2 . 4
4 . 4
0 . 2
0 . 2 0 . 2 0 . 2
0 . 2
Av. value Min. value Max. value Total p r e c ipit
0.68 0.32 1.20 . 0.68 0.32 1.22 0.66 0.33 1.20 0.60 0.29 0.97 0.63 0.33 1. 04 0.65 0.32 I . 1 0
[image:28.595.80.551.150.738.2]25 Table IO CONCENTRATIONS OF GROSS BETA RADIOACTIVITY
IN AIR AT ISPRA
OCTOBER 1964
D a y
1 2 3 4 5 6 7 8 9 10 11 12 13 14 15 16 17 18 19 20 21 22 23 24 25 26 27 28 29 30 31 Station 1 / 3 p c / m
0.79 0.30 0.27 0.40 0.33 0.31 0.43 0. 16 0.37 0.45 0.36 0.21 0.26 0.29 0.22 0.25 0.23 0.21 0. 15 0.19 0.12 0. 15 0.24 1.34 3.40 2.30 1.08 2. 10 1.58 0.97 1.50 Station 2 / 3 p c / m
0.65 0.32 0.28 0.35 0.29 0.34 0.40 0. 16 0.37 0.41 0.41 0.19 0.26 0.31 0.25 0.25 0.24 0.21 0.14 0. 17 0. 16 0. 16 0.22 1.24 3.20 2 . 2 0 1.01 1.82 1.50 0.86 1.40 Station 3 / 3 p c / m
0.73 0.44 0.23 0.31 0.32 0.27 0.39 0. 15 0.31 0.43 0.40 0.21 0.27 0.32 0.21 0.26 0.21 0.21 0. 16 0. 16 0. 19 0. 16 0.30 1. 10 3.08 2.20 1.02 2.06 1.53 0.86 1.41 Station 4 / 3 p c / m
0.65 0.27 0.25 0.32 0.30 0.27 0.39 0.15 0.33 0.41 0.31 0. 17 0.23 0.32 0.22 0.24 0.23 0.20 0. 13 0. 18 0. 12 0. 15 0.22 1. 16 2.88 2.38 1.00 1.80 1.53 0.78 1.14 Station 5 / 3 p c / m
0.73 0.32 0.25 0.35 0.29 0.28 0.40 0. 15 0.33 0.44 0.39 0. 17 0.22 0.29 0.24 0.25 0.24 0.21 0. 13 0. 18 0. 12 0. 13 0.28 1.28 2.93 2. 16 0.98 1.76 1.60 0.99 1.24
A v e r a g e ' value ' p c / m3 ;
0.71 0.33 0.26 0.35 0.31 0.29
0.40 \
0.15 0.34 0.43 0.37 0 Π 0.24 Π 0.31 D 0.23 j 0.25 D 0.23 0.21 0. 14 0. 18 0.14 0.15 j 0.25 j 1.22 3. 10 2 . 2 5
1.02 1.91 1.55 0.89
1.34 J P r e c i p i
tation
0 . 4
8. o 28.4 13.0
1 . 0
2 3 . 2
©.2
3 4 . 6
3.®
1.8
0.-4
0 . 2 0 . 6
6. 0
6 . 6
12.0
2 . 2 6 . 2
Av. value Min. value Max. value Total p r e c i pit.
[image:29.595.53.532.93.733.2]C O N C E N T R A T I O N S O F GROSS B E T A R A D I O A C T I V I T Y
IN A I R A T I S P R A
N O V E M B E R 1964
Day 1 2 3 4 5 6 7 8 9 10 11 12 13 14 15 16 17 18 19 20 21 22 23 24 25 26 27 28 29 30
S t a t i o n 1 / 3 p c / m
1.37 1.30 0 . 6 2 0 . 5 1 0 . 5 5 0 . 4 4 0 . 6 6 0 . 7 0 0. 13 0 . 0 6 0 . 0 8 0. 10 0. 16 0. 16 0. 35 0 . 2 6 0 . 2 1 0. 18 0 . 2 3 0. 19 0 . 2 5 0 . 2 1 0 . 2 7 0 . 2 4 0. 18 0. 18 0. 19 0. 05 0 . 0 6 0 . 2 1
S t a t i o n 2
/ 3 p c / m
1.26 1.27 0 . 5 7 0 . 4 2 0 . 5 6 0 . 4 6 0 . 6 1 0 . 8 0 0. 10 0 . 0 6 0 . 0 9 0. 13 0. 15 0. 17 0 . 3 7 0 . 2 5
0. 19 0. 19 0 . 2 5 0 . 2 1 0. 23 0. 18 0 . 2 7 0 . 2 8 0. 18 0. 15 0. 19 0 . 0 4 0 . 0 4 0 . 2 1
S t a t i o n 3
/ 3
p c / m
1.36 1.36 0 . 5 5 0 . 4 6 0 . 5 2 0 . 4 2 0. 62 0 . 7 0 0. 13 0. 09 0. 06 0. 14 0. 16 0. 16 0 . 3 5 0. 27
0. 19 0. 14 0. 26 0 . 2 0 0 . 2 4 0. 30 0 . 2 8 0 . 2 7 0. 18 0. 16 0. 16 0. 05 0 . 0 4 0 . 2 2
S t a t i o n 4
/ 3 p c / m
1. 16 1. 12 0. 58 0 . 4 4 0 . 4 8 0 . 3 6 0 . 6 6 0 . 6 2 0. 10 0. 06 0 . 0 6 0. 08 0. 17 0 . 2 0
0. 39 0 . 2 6 0 . 2 1 0. 16 0 . 2 0 0 . 2 1 0 . 2 4 0 . 2 1 0 . 2 5 0. 22 0. 16 0. 18 0. 17 0 . 0 4 0 . 0 3 0 . 2 8
S t a t i o n 5
/ 3 p c / m
1. 20 1.26 0. 58 0 . 4 2 0 . 4 7 0 . 3 8 0. 64 0 . 6 4 0. 10 0. 06 0. 07 0. 12 0. 19 0. 18 0 . 3 6 0. 29 0. 19 0. 15 0 . 2 1 0. 16 0. 22 0. 20 0 . 2 8 0. 25 0. 16 0. 15 0. 19 0. 04 0. 03 0 . 2 4
A v e r a g e v a l u e p c / m 3
1 . 2 7 1.26 0. 58 0 . 4 5 0. 51 0 . 4 1 0. 64
0 . 6 9 0. 11 0. 07 0 . 0 7 0. 11 0. 17 0. 17 0 . 3 6 0 . 2 7 0. 20 0. 16 0 . 2 3 0. 19 0 . 2 4 0. 22 0 . 2 7 0 . 2 5 0. 17 0. 16 0. 18 0. 04 0. 04 0 . 2 3
P r e c i p i -t a -t i o n
0 . 2 6 . 2 1.2 0 . 2
0 . 2 2 . 2
1 3 . 4
0 . 2
0 . 2 0 . 2 0 . 2
0 . 2
0 . 4
0 . 2 0. 4
2 3 . 4 2 1 . 0
A v . v a l u e 0 . 3 4 0 . 3 3 0 . 3 3 0 . 3 1 0 . 3 1 0 . 3 2 M i n . v a l u e 0 . 0 5 0 . 0 4 0 . 0 4 0 . 0 3 0 . 0 3 0 . 0 4 M a x . v a l u e 1.37 1.27 1.36 1.16 1.26 1.27
[image:30.595.80.545.136.733.2]D a y 1 2 3 4 5 6 7 8 9 1 0 ' 11 12 13 14 15 16 17 18 19 20 21 22 23 24 2 5 ! 26 27 ! 28 ! 29 j 30 ! 3 1 ! A v . v a l u e M i n . v a l u e M a x . v a l u e T o t a l p r e c
27
C O N C E N T R A T I O N S O F G R O S S B E T A Ρ
¡ S t a t i o n 1 ! ! p c / m / 3
| 0 . 3 4 0 . 4 6 0. 4 6 0. 17 0. 16 0 . 4 6 0 . 3 3 0 . 3 8 0 . 3 6 0 . 3 8 0 . 3 5 0 . 3 6 0 . 3 1 0 . 3 8 0. 16 0. 05 0. 07 0 . 3 3 0. 18 0 . 3 0 0. 65 0 . 4 8 , 0. 16 0. 18 0 . 2 3 0 . 2 7 0. 18 ! 0. 12 ! 0 . 3 3 \ 0 , 4 6 ! 0 . 4 6 ¡ 0 . 3 1 : 0 . 0 5 : 0. 6 5 i p i t .
J S t a t i o n 2 ! / 3 , p c / m ï 0 . 3 5 ! 0 . 4 2 ! 0 . 4 7 ! 0. 16 0. 16 1 0 . 4 2 0 . 3 2 0 . 3 4 0 . 3 4 0 . 3 4 0 . 3 2 0 . 2 9 0 . 2 8 0 . 3 7 0. 14 0. 06 0. 06 0 . 3 2 0. 23 0 . 3 4 0 . 4 0 0 . 6 6 0. 13 0. 13 0. 19 0 . 2 6 ! 0. 16 ! 0. 14 ! 0. 39 ! 0. 50 ! 0 . 3 7 j 0 . 2 9 0 . 0 6 0 . 6 6
IN A I R Ar Γ I S P R A
D E C E M B E R 1964
! S t a t i o n 3 ! , p c / m / 3
! 0. 30 j 0 . 4 1 j 0 . 4 7 ! 0. 18 0. 16 0 . 4 6 ! 0 . 3 9
0. 36 ; 0 . 3 3 0 . 3 5 0 . 3 5 0 . 3 3 0 . 3 0 0 . 4 0 0. 14 0 . 0 6 0. 05 0 . 3 0 0. 15 0 . 2 8 0 . 4 3 0 . 4 4 0. 13 0. 12 0. 16 i 0. 24 ■ ! 0. 13 \ 0. 13 ! 0 . 3 4 I 0. 52 ¡ 0 . 3 8 ¡ 0 . 2 8 0 . 0 5 0. 52
¡ S t a t i o n 4 ! / 3 ¡ p c / m ! 0. 32 ! 0. 38 ! 0 . 4 6 I 0. 16 j 0. 17 ! 0 . 4 0 ! 0 . 3 1 0 . 2 9 0 . 3 1 0. 30 0. 30 0 . 3 0 0 . 2 8 0 . 3 5 0. 14 0. 04 0. 06 0 . 3 3 0. 16 0 . 2 6 0 . 7 1 0. 39 0. 11
o. ie ;
0. 17 ; 0 . 2 4 ; 0. 15 ; 0. 09 0. 32 ¡ 0 . 5 4 Î 0 . 4 0 j 0 . 2 8 0. 04 0. 71
. A D I O A C T I V I T Y
¡ S t a t i o n 5 ! / 3 ] p c / m ! 0. 37 ! 0 . 3 9 ! 0 . 4 2 ! 0 . 2 0 ! 0. 20 ! 0 . 4 1 ! 0 . 3 2 0 . 4 2 0 . 3 1 0 . 2 7 0 . 3 0 0 . 2 8 0 . 2 7 0 . 4 0 0. 14 0. 04 0. 05 0 . 2 9 0. 11 0 . 2 5 0 . 9 0 ; 0 . 7 2 ; 0. 13 i 0. 17 ! 0 . 2 6 0 . 2 3 ¡ 0. 12 ί
0. 14 j
0. 32 ¡
0. 55 ; 0 . 5 0 j
0 . 3 1 0 . 0 4 0 . 9 0
¡ A v e r a g e ¡ v a l u e
\ p c / m 3
1 0. 34 ! 0 . 4 1 ! 0 . 4 6
0. 17
! 0. 17 ! 0 . 4 3 ! 0. 33
0. 36 0. 33 0. 33 0 . 3 2 0. 31 0. 29 0 . 3 8 0. 14 0. 05 0. 06 0. 31 0. 17 0 . 2 9 0. 62 0. 54 0. 13 0. 16 0 . 2 0
0 . 2 5 ¡ 0. 15 ! 0. 12 ; 0 . 3 4
0 . 5 1 ί 0 . 4 2 j
0 . 2 9 0. 05 0 . 6 2
T a b l e 12
¡ P r e c i p i -¡ t a t i o n
! 0 . 2
9 . 6 2 0 . 6
1.4 2 . 0 1 5 . 6
4 . 6 2 . 2
0 . 6 4 . 4
[image:31.595.46.520.110.755.2]1 9 o 4
M o n t h
J a n u a r y
F e b r u a r y M a r c h
A p r i l
M a y
J u n e
J u l y A u g u s t
S e p t e m b e r
O c t o b e r
N o v e m b e r D e c e m b e r
G r o s s b e t a
1 . 9 0
1 . 2 7
0 . 7 0 1 . 6 2
2 . 0 0 2 . 0 4
1 . 3 9 0 . 8 5
0 . 6 5
0 . 6 3 0 . 3 2
0 . 2 9
Q 9 0
S r
0 . 0 3 7 0 . 0 2 7
0 . 0 1 6 0 . 0 4 2
0 . 0 5 6
0 . 0 6 0 0 . 0 4 7
0 . 0 2 9 0 . 0 2 4
0 . 0 0 9 0 . 0 0 5 0 . 0 0 8
r 1 3 7
Cs
0 . 0 5 6
0 . 0 3 S
0 . 0 2 5 0 . 0 o 3
0 . 0 S 1
0 . 0 9 5
0 . 0 7 0
0 . 0 4 4
0 . 0 3 4
0 . 0 1 5 0 . 0 0 8
0 . 0 1 3
Z r9 5 + N b9 5
0.*15
0 . 0 8 0 0 . 0 3 1
O.OSO 0 . 0 7 2
0 . 0 4 7
0 . 0 2 7 0 . 0 1 2
u .
«g. 0 . 0 1 0 j ^ O . 0 1 0
u .
- 144 Ce
0 . 6 5
0 . 4 2
0 . 2 5 0 . 5 3
0 . 7 4
0 . 7 2
0 . 5 0
0 . 3 0 0 . 1 8
0 . 0 8
0 . 0 4
0 . 0 7
ρ 1 0 6
R u
0 . 2 2
0 . 1 4
0 . 0 3 5 0 . 1 8
0 . 2 2
0 . 2 2
0 . 1 6 0 . 0 9 3
0 . 0 5 5
0 . 0 2 4
0 . 0 1 3
0 . 0 2 0
Μ η5 4
0 . 0 4 9 0 . 0 3 1
0 . 0 1 7 0 . 0 4 1
0 . 0 5 0
0 . 0 5 1
0 . 0 3 6 0 . 0 2 1
0 . 0 1 1 ^ 0 . 0 1 0
«^O.OIO
ssrO.OlO
S b1 2 5
0 . 0 3 8
0 . 0 3 5
0 . 0 3 5 0 . 0 4 2 0 . 0 6 3
0 . 0 6 6
0 . 0 4 1 0 . 0 2 2
0 . 0 1 8
0 . 0 1 0
s £ 0 . 0 1 0
^ 0 . 0 1 0
&
GROSS B E T A RADIOACTIVITY, STRONTIUM90, CESIUM137 IN F A L L O U T
1964
January February March April M a y June July August September October November December Total
Gross be /ν 2(χ)
mc/Km v '
30 22 50 150 8 5 7 5 18 27
4 . 6 3 0
9 . 0 5 . 0
40
ta K equivalent / 2 (xx) m c / K m '
28 2 1 4 9 146 83 73 17 2 5 4 . 2 4
7 .
4·
5
9
7
p c / l «
7 4 0 3 00 2 9 0 9 8 0 1250 6 0 0 1430 2 7 0 130 2 0 0 130 82
Strontium90
m c / K m
1 . 3 Ô.44 1.9 6 . 9 3 . 5 4 . 1 1 . 0 1.6 0.33 1 . 1 0.29 0.16 22.62
p c / l
32.0 5 . 9 11.2 4 5 . 2 51.3 3 2 . 8 79.3 15.8 9 . 2 7 . 4 4 . 1 2 . 6
Cesium137
m c / K m
1.9 0.68 3 . 2 10.3
5 . 2 5 . 7 1 . 5 2 . 7 0.57 1.9 0.48 0.28 34.41
p c / l
46.8 9 . 2 18.9 67.4 76.2 4 5 . 6 119.0 26.6 15.6 13.1 6 . 9 4 . 6
Precipitation j
m m ι
4 0 . 6 !
74.2 \
169.6 ï
152.8 ί
68.2 !
125.2 ¡
12.6 ! 101.2 ; 36.6 : 149.2 I
70.0
61.2 j
Days with
precipitation
5 10 18 15 8 13
9
14 15 18 17
9
1061.4
2 ± ( m c / K m )
1964
Month
J a n u a r y February-M a r c h A p r i l
M a y
June July August S e p t e m b e r October November D e c e m b e r
95 95 Z r + Nb*
4 . 2
1 . 2
4 . 0 8 . 2 2 . 6
2 . 3
0.50 0.50
u .
0.90 0.50
u .
o 106 Ru
6 . 2
2 . 7 9 . 2
26 16
14 3 . 2
4 . 4
1 . 0 3 . 3
0 . 7 0 . 4
54 Mn
1.7
0.52
2 . 1
6 . 9 3 . 3
3 . 2
0.60
1 . 2
0.20 0 . 8 3 0 . 2 1 0.09
S b1 2 5
1 . 2
0.50
1 . 9 6 . 3 3 . 8
3 . 8
0.80
1.5
0.28 0 . 7 2 0 . 2 5 0 . 1 4
_ 144 Ce
20
7
2 4 . 6
81 48
45
11 13
3 . 3
10
2 . 9 1.5
B e7
1.7
0.95
3 . 4
8 . 0 4 . 3
5 . 5
-~
-± = Values a r e extrapolated to l a s t day of collection m o n t h . u . - Undetectable.
- = M e a s u r e m e n t not p e r f o r m e d .
RADIONUCLIDES IN F A L L O U T
( m c / K m )
_i.¿¿; ■ ,«0m
1 9 6 3 1964
M o n t h
J a n u a r y 1963 F e b r u a r y
M a r c h A p r i l M a y J u n e J u l y A u g u s t S e p t e m b e r O c t o b e r N o v e m b e r D e c e m b e r
J a n u a r y 1964 F e b r u a r y
M a r c h A p r i l M a y J u n e J u l y A u g u s t S e p t e m b e r O c t o b e r N o v e m b e r D e c e m b e r
• , 2 2 N a
_ 0 . 0 1 4 0 . 0 4 0 0. 052 0 . 0 7 4 0 . 0 6 4 0 . 0 3 2
0 . 0 3 2
0. 004
0. 052 0. 029 0 . 033
0 . 0 1 1
60 C o _ 0 . 0 2 6 0. 076 0. 100 0. 136 0 . 124 0 . 0 5 7
0 . 0 4 2
0. 006
0. 065 0 . 0 3 6 0. 040
0 . 012
8 8 Y _ 0. 043
0 . 0 8 2 0 . 0 4 2 0. 034
0. 004
™ 124 Sb
_ 0 . 2 5
0 . 3 3 0 . 4 1 0. 10
0. 16
0 . 2 8 0 . 0 9 0. 13 V a l u e s a r e e x t r a p o l a t e d t o l a s t d a y of c o l l e c t i o n m o n t h .
M e a s u r e m e n t n o t p e r f o r m e d . H
;. r ñ ñ N T i U M * J 11 Λ N I ι c ._ι·;:;ιπ"Μ ! VI m 11 κ ; ; Β Ari Κ
1961
gaïiApiin s i t e
ö&cssa « r e b b i » I s p r a M o n v a l l e O s m a t e R o c c o l o T a i n o B a r z a B r e b b i a I s p r a M o n v a l l e Q s m a t e R o c c o l o T a i n o
(*) = (**) =
I
e; t isHinplinj;
j d a t e
ί 1 6 - 4 ; 2 0 - 4
1 6 - 4 ; 1 6 - 4 ; 1 6 - 4 ; 2 0 - 4 ; 1 6 - 4
| 1 4 - 5 ; 1 4 - 5 ! 1 4 - 5 ! 1 4 - 5 ! 1 4 - 5
¡ 1 4 - 5 ' 1 4 - 5 I
V a l u e s a r e g i v e n j W e i g h t r a t i o of fre
5 . 4 6 6 . 9 0 6 . 7 8 7 . 2 0 7 . 4 1 5. 12 6 . 0 6
5 . 5 6 5 . 2 0 6 . 6 6 5 . 0 6 5 . 8 0 3 . 7 3 6 . 0 2
>er w e i g h t s h m a t t e r
Q 90 b r P c / g
6 . 0
1.4 3 . 8 2 . 6 2 . 6 -3 . -3
3 . 2 5 . 5 5 . 7
5 . 1 5 . 2 5 . 0 6 . 2
1
! C a m g / g
6 . 2 1 1 . 8 5 . 4 6 . 2 3 . 8 1 4 . 0 1 1 . 4
4 . 7 5 . 7 7 . 3 8 . 5 5 . 4 1 1 . 6 1 4 . 1
u n i t y of d r y m a t t e r t o d r y m a t t e r .
ς 90 S r p c / g C a
9 7 0 120 7 0 0 4 2 0 680
-2 9 0
680 960 7 8 0 6 0 0 9 6 0 4 3 0 4 4 0
„ 137 C s
p c / g
8 . 8 3 . 7 3 . 8 3 . 8 2 . 1 7 . 3 3 . 5
3 . 6 4 . 7 4 . 6 7 . 3 4 . 3 4 . 2 5 . 0
Κ m g / g
3 0 . 0 3 4 . 0
3 2 . 9 1 7 . 5 4 2 . 0 2 3 . 6 3 4 . 3
2 9 . 6 1 9 . 8 3 0 . 8 1 6 . 3 2 7 . 9 2 3 . 6 2 7 . 7
,. 137 C s p c / g Κ
290 110. 120 220 50 3 1 0 100
120 2 4 0 150 4 5 0 150 180 180
54 M n P c / g
4 . 9 3 . 3 3 . 6 2 . 6 2 . 8 7 . 2 2 . 7
3 . 0 3 , 3 4 . 0
4 . I 5 . 6 -3 . 7
M e a s u r e m e n t n o t p e r f o r m e d .
S T R O N T I U M - 9 0 A N D C E S I U M - 1 3 7 I N H E R B A G E (*)
1 9 6 4
i
S a m p l i n g s i t e
B a r z a
B r e b b i a
I s p r a
M o n v a l l e
O s m a t e
T a i n o
B a r z a
B r e b b i a
I s p r a
O s m a t e
M o n v a l l e
T a i n o
S a m p l i n g d a t e
1 6 - 6
1 6 - 6
1 6 - 6
1 6 - 6
1 6 - 6
1 6 - 6
9 - 7
9 - 7
9 - 7
9 - 7
9 - 7
9 - 7
R<**>
6 . 0 6
5 . 4 1
7 . 4 1
5 . 7 1
5 . 0 0
4 . 4 9
4 . 7 0
5 . 8 0
4 . 7 6
5 . 2 0
6 . 0 6
5 . 9 0
e 9 0 S r P c / g
7 . 4
9 . 5
5 . 9
5 . 2
3 . 0
6 . 1
7 . 9
10
5 . 2
6 . 7
5 . 9
5 . 2
C a m g / g
1 5 . 0
1 8 . 0
1 4 . 0
1 3 . 6
5 . 2
1 0 . 4
1 2 . 2
1 6 . 2
1 6 . 2
2 0 . 0
1 5 . 4
1 6 . 2
c 9 0 S r p c / g C a
4 9 0
5 3 0
4 2 0
3 8 0
580
5 8 0
6 5 0
6 2 0
3 2 0
3 4 0
3 8 0
3 2 0
- 1 3 7
C s p c / g
1 7 . 5
7 . 2
! 5 . 6
! 5 . 2
3 . 0
4 . 9
3 . 7
■ 3 . 6
5 . 4
6 . 0
6 . 0
3 . 5
K m g / g
1 9 . 8
1 7 . 0
3 1 . 0
2 2 . 6
2 2 . 0
2 3 . 2
2 2 . 0
2 0 . 8
1 8 . 0
1 3 . 2
1 0 . 1
2 8 . 6
_ 1 3 7 C s P c / g K
880
4 2 0
180
2 3 0
140
2 1 0
170
1 7 0
3 0 0
4 5 0
5 9 0
120
5 4 M n
p c / g
3 . 7
4 . 9
3 . 7
2 . 7
2 . 6
3 . 7
3 . 3
2 . 0
4 . 3
2 . 1
-2 . 6
(±) - V a l u e s a r e g i v e n p e r w e i g h t u n i t y of d r y m a t t e r .
(±±) = W e i g h t r a t i o of f r e s h m a t t e r t o d r y m a t t e r ,
- = M e a s u r e m e n t n o t p e r f o r m e d .
8
S T R O N T I U M - 9 0 A N D C E S I U M - 1 3 7 IN H E R B A G E
1964
S a m p l i n g s i t e
B a r z a B r e b b i a I s p r a O s m a t e M o n v a l l e T a i n o
B a r z a B r e b b i a I s p r a O s m a t e M o n v a l l e
T a i n o
B a r z a B r e b b i a I s p r a O s m a t e M o n v a l l e
T a i n o
S a m p l i n g d a t e
1 3 - 8 1 3 - 8 1 3 - 8 1 3 - 8 1 3 - 8 1 3 - 8
1 8 - 9 1 8 - 9 1 8 - 9 1 8 - 9 1 8 - 9 1 8 - 9
2 1 - 1 0 2 1 - 1 0 2 1 - 1 0 2 1 - 1 0 2 1 - 1 0 2 1 - 1 0
R<**>
4 . 5 5 7 . 1 5 5 . 3 4 5 . 9 0 4 . 5 0 4 . 4 5
5 . 5 0 5 . 7 0 5 . 7 0 4 . 5 5 4 . 4 0 3 . 5 0
4 . 1 6 4 . 4 0 5 . 4 0 3 . 1 3 5 . 0 0 4 . 0 8
„ 90 S r p c / g
13 3 . 8 4 . 2 3 . 9 3 . 8 3 . 1
3 . 3 3 . 6 4 . 1 2 . 1 3 . 7 3 . 0
4 . 4 6 . 0 3 . 5 3 . 8 3 . 8 5 . 1
Ca m g / g
2 0 . 4 1 6 . 0 1 4 . 4 1 5 . 2 1 4 . 4 1 6 . 8
1 8 . 4 1 7 . 6 1 3 . 6 5 . 2 1 8 . 0 1 0 . 0
1 5 . 6 1 8 . 0 1 3 . 2 1 2 . 4 1 0 . 0 1 6 . 4
^ 90 S r p c / g Ca
6 4 0 2 4 0 290 260 260 180 180 200 3 0 0 4 0 0 2 1 0 300
2 8 0 330 2 7 0 310 3 8 0 3 1 0
„ 137 -C s
p c / g
6 . 5 3 . 6 3 . 8 3 . 4 2 . 7 2 . 1
3 . 5 1 . 9 2 . 2 0 . 9 9 2 . 6 1 . 5
5 . 2 4 . 2 2 . 2 2 . 3 3 . 8 2 . 2
K m g / g
1 4 . 0 2 2 . 5 1 6 . 3 1 1 . 6 1 8 . 0 1 7 . 0
1 3 . 4 1 7 . 6 2 5 . 9 3 1 . 5 1 0 . 0 1 6 . 6
1 1 . 9 8.6, 2 3 . 0 1 5 . 6 1 2 . 0 ! 1 6 . 1
^ 137
C s P c / g K
4 6 0 160 230 290 150 120 260 110 85 31 260 90
4 4 0 4 9 0 96 150 320 140
-ir 5 4
M n p c / g
4 . 3 1 . 6 1 . 5 1.3 1 . 8 1 . 1
0 . 9 7 0 . 7 5 1 . 3 0 . 8 5 1.1 1 . 4
1 . 9 1 . 7 0 . 8 6 1 . 7 1.7 1 . 8
(*) (±±)
V a l u e s a r e g i v e n pe,r w e i g h t u n i t y of d r y m a t t e r . W e i g h t r a t i o of f r e s h m a t t e r t o d r y m a t t e r .
K
ρ
STRONTIUM-90 AND CESIUM-137 IN MILK - BARZA
1964
Month
J a n u a r y
F e b r u a r y
M a r c h
A p r i l
M a y
June
July
August
September
October
November
D e c e m b e r
Sr9° p c / 1
120
113
130
91
98
88
79
74
52
67
113
102
Ca s/i
1.23
1. 10
1. 18
1.08
1.22
1.31
1.27
1.30
1.13
1. 17
1. 15
1.23
ς 90 Sr p c / g Ca
9 8
103
110
84
80
67
62
57
46
57
98
83
n 137
Cs p c / 1
4 5 0
4 4 0
4 8 0
540
3 2 0
3 1 0
210
180
160
140
3 1 0
2 7 0
Κ g / i
1.84
1.85
1.80
1.81
1.75
1.75
1.68
1.57
1.74
1.73
1.79
1.84
„ 137 C s p c / g Κ
2 4 0
2 4 0
2 7 0
3 0 0
180
180
130
110
94
81
170
160
pc Sr / g Ca
η 1 3 7/ π
pc Cs / g Κ
0.400
0.430
0.407
0.280
0.444
0.372
0.477
0.518
0.490
0.704
0.577
0.520
Η
Ρ
1964
Month
J a n u a r y F e b r u a r y M a r c h A p r i l
M a y
June July
August
September
October
November
D e c e m b e r
S r9 0
pc/1
99
102
8 4
97
78
87
83
7 2
61
82
83
62
Ca g / i
1. 15
1. 15
1.23
1. 18
1.20
1.25
1. 15
1.25
1.30
1.33
1.22
1.07
c 90 Sr p c / g Ca
86
89
68
82
6 5
7 0
7 2
58
47
62
68
58
~ 137 Cs
pc/1
8 4 0
8 0 0
8 7 0
6 9 0
5 4 0
5 4 0
5 2 0
4 7 0
3 0 0
4 0 0
3 9 0
3 5 0
K ß/1
1.65
1.60
1.78
1.70
1.72
1.71 1. 56
1. 56
1.53
1.64
1.71
1.67
~ 137 Cs p c / g Κ
510
500
4 9 0
4 1 0
3 1 0
3 2 0
3 3 0
3 0 0
2 0 0
2 4 0
2 3 0
2 1 0
, 9 0 , _ pc Sr / ' Ca
r- 1 3 7/
pc Cs / g K
0. 168
0. 178
0. 139
0 . 2 0 0
0 . 2 1 0
0.219
0.218
0. 193
0 . 2 3 5
0.258
0.296
0 . 2 7 6
Ρ
S T R O N T I U M - 9 0 A N D C E S I U M - 1 3 7 IN M I L K - I S P R A
M o n t h
J a n u a r y
F e b r u a r y
M a r c h
A p r i l
M a y
J u n e
J u l y
A u g u s t
S e p t e m b e r
O c t o b e r
N o v e m b e r
D e c e m b e r
Sr9°
p c / 1
100
85
90
90
81
93
68
68
51
4 8
58
64
C a g / i
1.20
1. 18
1. 13
1.22
1.22
I
1. 17
1.26
1. 17
1. 15
1. 10
I . 17
1.40
1964
Sr9°
p c / g C a
83
72
80
74
66
79
54
58
44
44
4 1
46
n 137
C s P c / 1
890
7 8 0
800
8 0 0
660
660
57 0
4 8 0
4 7 0
3 8 0
43 0
4 4 0
K g / i
1 . 6 6
1.63
1 . 7 5
1 . 6 5
1 . 6 1
1.68
1.70
1.60
1 . 6 5
1.63
1 . 6 1
1.68
_ 137 C s p c / g K
540
4 8 0
4 6 0
4 9 0
4 1 0
3 9 0
3 4 0
300
290
23 0
270
260
Q 90 / _
p c S r / g C a
r- 1 3 7 , v
p c C s / g K
0. 154
0. 150
0. 174
0. 151
0. 161
0 . 2 0 3
0. 159
0. 193
0. 152
0. 192
0. 152
0. 177
ω
Ρ