© 2017, IRJET | Impact Factor value: 5.181 | ISO 9001:2008 Certified Journal
| Page 1970
BOTTOM RIGID BEAM STOREY & INTERMEDIATE SOFT STOREY
HAVING MOMENT TRANSFER BEAMS.
Sujeet Patil
1, Prof. Vishwanath B Patil
2,
1
P G Student
2
Associate Professor
Dept. of civil Engineering, PDACE Kalaburagi-585102
---***---Abstract
Generally RC framed high rise building structures are designed neglecting the effect of masonary infill walls . Whereas the masonary infill walls are used for partition . The masonary infill walls are treated as non-strucutural elements . RC frame structures having open first storey is known as soft storey . The intermediate soft storey is such an element where it is left open as service soft storey without infill . As a result the soft storey located at the lower part of high rise building experience severe seismic forces being acting on them . In satellite bus stop where bottom soft storey height is more than double height , will experience more undesirable impact by the seismic forces . Meanwhile the soft storey located in the upper part of high rise building does not significantly effect the overall performance compared to the performance of the fully infill frame. Due to the complexity and lack of knowledge in performing the P-delta analysis ,Civil designing engineers end up in performing only Linear static analysis which may eventually lead to catastrophic consequences, leading to the collapse of the building . This analysis is performed to discuss the importance of P-delta effect in RC structures.Key Words: Satellite bus stop, seismic analysis of building, Soft storey, moment transfer beams, shear walls. P-delta effect.
1.INTRODUCTION
The designing methodology of the structure, in India has led to the structure being more susceptible to seismic hazards . This has led to the consideration of seismic load into the design to give a safe and durable design to the building. The various lateral load resisting systems used are 1] Bare frame 2] shear wall 3] bracings. In high rise buildings the major matter of concern are the lateral loads , these lateral loads can induce vibrations , stresses and can cause seismic lateral sway of the structure. Due to increase in slenderness , the sway is also dominating, comparatively with high rise building. In the traditional first order analysis of structures,
the effects of change in the structural actions due to structural deformations are ignored. However, when a structure deforms, the applied loads may cause additional actions in the structure that are described as second order or P-Delta effects.
In short, P-Delta is secondary order loading effect in structure directly related to stiffness as it reduces the stiffness of structural.
In satellite bus stops the probability of all the undesirable effects are very severe due to the height of soft storey is double than usual, in order to avoid all undesirable effects various types of shear walls are incorporated in the project.
2. DESCRIPTION OF STRUCTURAL MODEL
The present study has 10 different models of 21 storey having 5 bays of 11 mts in X-direction and 14 bays of 6 mts in Y-direction And a bottom storey height of 10 mts and 2.2 mts of intermediate soft storey( 11th storey) and 3.2 remaining all storeys
.
DATA VALUES
Zone 5TH
soil strength Medium
Response reduction factor 5 Modulus of elasticity of brick
masonary 35X10
5kn/m2
Youngs modulus of M25 concrete,E 25X106 KN/M2 Young’s modulus of M35 concrete,E 35X106 KN/M2 Density of brick masonary 20
GRADE OF CONCRETE
For beams and slabs M25 For columns and Shear walls M35
LOADS
Floor finish 2 kn/m2
© 2017, IRJET | Impact Factor value: 5.181 | ISO 9001:2008 Certified Journal
| Page 1971
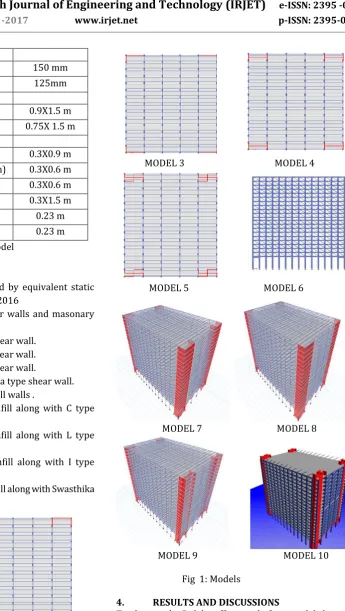
SLAB THICKNESS
storeys 1 to 15 150 mm
storeys 16 to 21 125mm
COLUMN SIZE
storeys 1 to 15 0.9X1.5 m storeys 16 to 21 0.75X 1.5 m
BEAM SIZE
Main beams (y -direction) 0.3X0.9 m Moment transfer beams(x-direction) 0.3X0.6 m
Edge beams 0.3X0.6 m
[image:2.595.192.538.51.663.2]Bottom main beams ( y-direction) 0.3X1.5 m Thickness of masoanry wall 0.23 m Thickness of concrete wall 0.23 m Table 1: Description of structural model
3.
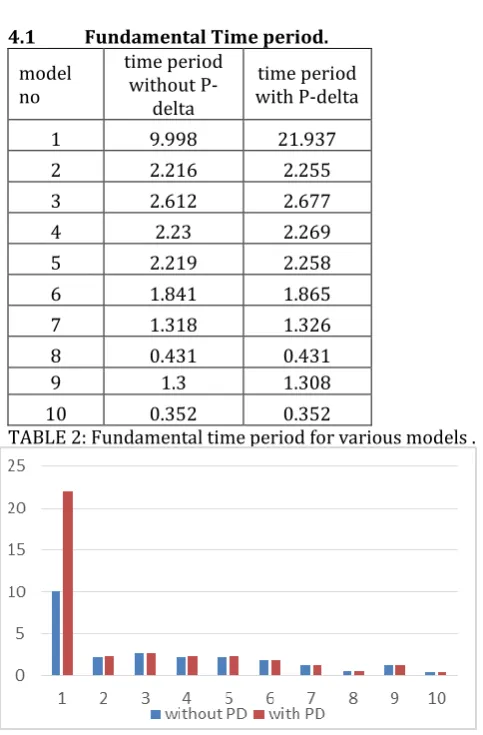
MODELS FOR ANALYSISA total of 10 models being analyzed by equivalent static analysis method(ESA) using ETABS 2016
-MODEL 1:Bare frame without shear walls and masonary infills.
-MODEL 2:Bare frame with C type shear wall. -MODEL 3:Bare frame with L type shear wall. -MODEL 4:Bare frame with I type shear wall.
-MODEL 5:Bare frame with Swasthika type shear wall. -MODEL 6:Frame with masonary infill walls .
-MODEL 7:Frame with masonary infill along with C type shear wall.
-MODEL 8:Frame with masonary infill along with L type shear wall.
-MODEL 9:Frame with masonary infill along with I type shear wall.
-MODEL 10:Frame with masonary infill along with Swasthika type shear wall.
MODEL 1 MODEL 2
MODEL 3 MODEL 4
MODEL 5 MODEL 6
MODEL 7 MODEL 8
MODEL 9 MODEL 10
Fig 1: Models
4. RESULTS AND DISCUSSIONS
© 2017, IRJET | Impact Factor value: 5.181 | ISO 9001:2008 Certified Journal
| Page 1972
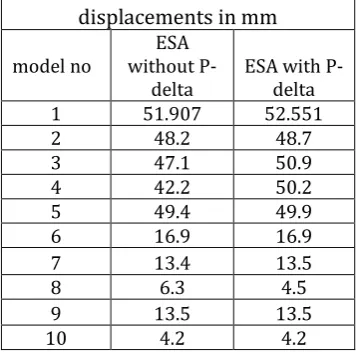
model no
time period without
P-delta
time period with P-delta
1 9.998 21.937
2 2.216 2.255
3 2.612 2.677
4 2.23 2.269
5 2.219 2.258
6 1.841 1.865
7 1.318 1.326
8 0.431 0.431
9 1.3 1.308
10 0.352 0.352
TABLE 2: Fundamental time period for various models .
Fig 2: Time period v/s model no. of all the models.
All objects have natural time period, which means the time taken by the object to move to and fro. We can see when the pendulum is pushed it moves to and fro at its own pace , with its own time period, same way the ground also moves in the same time period. This can become a serious problem if the ground and the building experiences the same time period. Resonance is said to occur if the ground and building oscillates at the same time period. This is the state of time when disasters are said to occur if the time period of ground and building matches and are equal. A smaller building will swing back and froth quickly, and the taller building will move back and froth bit slow comparatively. Therefore less time period will be more catastropic. Therefore height of the building is the important component in time period. From table 1 time period for for model 1 is 9.998, which is very large compared to all other models . For model 2,3,4,5 the time period reduces by 77.83%, 73.87%,77.69%, 77.80% respectively. The time period further reduces for model 6,7,8,9,10, comparing to the model 1 by 81.58%, 86.81%,95.69%, 86.99%, 96.48% respectively( without P-delta).
which is very large compared to all other models . For model 2,3,4,5 the time period reduces by 89.72%, 87.79%, 89.65%, 89.70% respectively. The time period further reduces for model 6,7,8,9,10, comparing to the model 1 by 91.49%, 93.95%, 98.035%, 94.037%, 98.39% respectively. (with P-delta).
From table 1 the time period by ETABS values are differing for different models . Thus it can be concluded that presence of concrete shear wall and brick masonary infill walls considerably reduces the time period of the building.
4.2 Base shear.
Base shear in KN model
[image:3.595.32.274.87.455.2]no ESA without P-delta ESA with P-delta 1 13844.8649 13844.8649 2 25561.5704 25120.4329 3 21587.5508 21062.3241 4 25522.3837 25076.6229 5 26043.8724 25594.2958 6 30671.6416 30276.6992 7 43596.2118 43327.855 8 105108 105108 9 44599.2199 44331.6468 10 106757 106757
Table 3: comparision of highest values of base shear along X-direction among all the models by ESA.
Fig3: base shear v/s model in x-direction.
Base shear in KN model
© 2017, IRJET | Impact Factor value: 5.181 | ISO 9001:2008 Certified Journal
| Page 1973
[image:4.595.299.549.54.267.2]5 29293.4411 28911.087 6 56250.0837 55821.0507 7 76814.6315 76565.9951 8 105108 105108 9 76627.1762 76367.1574 10 106757 106757
Table 4: comparision of highest values of base shear along y-direction among all models by ESA.
Fig4: Base shear v/s model in y-direction.
4. 3 Storey Displacement.
displacements in mm
model no without P-ESA
delta ESA with P-delta 1 721.241 3393.431
2 62.8 63.8
3 76.1 78
4 63.4 64.5
5 64.2 65.3
6 31.3 31.6
7 26.4 26.5
8 10.4 8.6
9 25.5 25.6
[image:4.595.35.276.226.392.2]10 5.7 5.7
[image:4.595.308.488.309.486.2]Table 5: comparision of highest values of displacements in x-direction by ESA.
Fig 5: Displacements v/s model in x-direction.
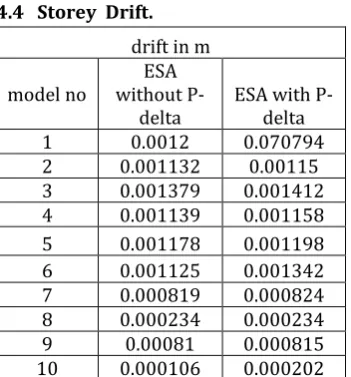
displacements in mm
model no without P-ESA
delta ESA with P-delta 1 51.907 52.551
2 48.2 48.7
3 47.1 50.9
4 42.2 50.2
5 49.4 49.9
6 16.9 16.9
7 13.4 13.5
8 6.3 4.5
9 13.5 13.5
10 4.2 4.2
Table 6: comparision of highest values of displacements Y-direction by ESA.
Fig 6: Displacements v/s models in Y-direction.
The maximum displacements at every storey with respective to the ground storey is given in the tabulated format from ETABS. The graph are also given in the form of charts to understand the behaviour of the building along X & Y direction.
[image:4.595.308.542.310.646.2] [image:4.595.309.552.485.651.2]© 2017, IRJET | Impact Factor value: 5.181 | ISO 9001:2008 Certified Journal
| Page 1974
reduced to 91.29%, 89.44%, 91.2%, 91.09% respectively. Due to the added masoanry infills to the models 6,7,8,9,10 the displacement values are reduced to 95.66%, 96.33%, 98.55%, 96.46%, 99.2% respectively [without P-delta] Along y-direction comparing to the model 1, models 2-10 reduced there values by 7.14%, 9.26%,18.70%, 4.82%, & 67.44%, 74.18%,87.862%,73.99%, 91.90 % respectively [without P-delta].
Model 1 has highest displacements values along X-direction compared to the other models .Due to the added shear walls in model 2,3,4,5 the displacements values are reduced to 98.1%, 97.7%, 98.09%, 98.07%respectively. Due to the added masoanry infills to the models 6,7,8,9,10 the displacement values are reduced to 99.06%, 99.2%, 99.75% 99.24, 99.83%respectively [with P-delta] . The displacements values are not so drastically varying along the Y-direction as in the case of X-direction . This can also reveal that due to higher stiffness along the Y-direction the displacements values are least and varies gradually as per the stiffness of the structure.
Along y-direction compared to the model 1 , all the other models get reduced there displacements values by 7.33%, 3.14%, 3.08%, 5.04%, 67.84%, 74.3%, 91.43%, 74.3%, 92.007% respectively [with P-delta].
Thus it can be concluded that inclusions of shear wall and masonary infills the drift and displacements values can be reduced in Reinforced concrete buildings.
4.4 Storey Drift.
drift in m
model no without P-ESA
delta ESA with P-delta 1 0.0012 0.070794 2 0.001132 0.00115 3 0.001379 0.001412 4 0.001139 0.001158 5 0.001178 0.001198 6 0.001125 0.001342 7 0.000819 0.000824 8 0.000234 0.000234 9 0.00081 0.000815 10 0.000106 0.000202
[image:5.595.305.556.62.263.2]Table 7: Comparision of highest values of Drift along X-direction by ESA.
Fig 7: Drift values v/s models along X-direction.
drift in m
model no ESA without
[image:5.595.308.496.291.493.2]P-delta ESA with P-delta 1 0.001015 0.001048 2 0.000816 0.000848 3 0.000889 0.000904 4 0.000816 0.000886 5 0.000856 0.000869 6 0.001067 0.001078 7 0.000689 0.000689 8 0.000673 0.000674 9 0.000694 0.000695 10 0.000104 0.000574
Table 8: comparision of highest drift values along Y-direction by ESA.
Fig 8: Drift values v/s models in Y-direction.
[image:5.595.38.214.483.672.2] [image:5.595.309.552.525.684.2]© 2017, IRJET | Impact Factor value: 5.181 | ISO 9001:2008 Certified Journal
| Page 1975
and transverse direction obtained by ESA shown in above table.
By comparing all the models, we can say that bare frame model experience more drift than the frame with masonary infill and shear wall. The drift values is more at the bottom soft storey and it goes on reducing as we go up the higher stories, and it dips slightly at the intermediate soft storey . If stiffness is more than the drift values are less. Hence we can conclude that shear wall and masonary infiil will significantly reduces the drift values.
CONCLUSIONS:
1. Fundamental time period decreases when the effect of masonry infill wall and concrete shear wall is considered.
2. The RC frame model 1(bare frame) having highest value of time period compared to masonry infill with soft Story.
3. Fundamental time period decreases when the stiffness of masonry infill and concrete shear wall is considered. 4. The time period of model 10 is least due to increase in
stiffness by both masonary infill and also shear wall. 5. Time period is more for the bare frame with P-delta. 6. The presence of masonry infill and shear wall in the
structure reduces the Story drifts.
7. Story displacements are more for the bare frame model and the inclusion of shear wall reduces the displacements.
8. Providing shear wall at all end corners of the building in X and Y direction significantly improves all parameters in the analysis.
9. Seismic base shear is considerably more for masonry infill and shear wall models as compared with bare frame model.
10. The Story drifts are found within the limit as specified by the code IS 1893 (Part 1):2002 except for model 1 with p-delta effect.
11. By providing shear walls at the corners the P-delta effect can be ignored.
12. Seismic base shear is less in P-delta effect and more without P-delta effect.
13. P-delta effect increases BM and forces.
14. P-delta effect increases the joint displacements when compared to without P-delta effect except model 8. 15. Except displacements values for bare frame model , the
values between with and without P-Delta for any parameters are not varying by much.
REFERENCES
1. Suchita Hirde and Ganga Tepugade “ Seismic Performance of Multistorey Building with Soft Storey at Different Level with RC Shear Wall “International Journal of Current Engineering and Technology Accepted 30 May 2014, Available online 01 June 2014, Vol.4, No.3,June 2014.
2. Mohammed khaja moinuddin and prof Vishwanath B patil ”seismic evaluation of R.C.Framed high rise structural system with the effect of ground and intermediate soft storey” In International Journal of engineering research & technology has accepted volume 3, issue 08, august 2014.
3. Mohammed Tosif Ahmed “Seismic performance evaluation of multi-storeyed r c framed structural system with the influence of ground & top soft storey”, International Journal of Engineering Research and Applications ISSN: 2248-9622, Vol. 4, Issue 8( Version 1), August 2014, pp 133-138 .
4. Shrikanth Bhairagond and Prof. Vishwanath. B. Patil, Seismic Analysis of Multi-Storyed Building with Underneath Satellite Bus Stop and Intermediate Service Soft Story Having Floating Columns. IJSRD - International Journal for Scientific Research & Development| Vol. 3, Issue 05, 2015 | ISSN (online): 2321-0613.
5. Sunil Kumar Kalyani and Vishwanath B Patil, Seismic Analysis of MultiStory Building with Underneath Satellite Bus-Stop having Floating Columns with Top Soft Story. IJSTE - International Journal of Science Technology & Engineering | Volume 2 | Issue 01 | July 2015 ISSN (online): 2349-784X.
6. K. H. Abdelkareem, F. K. Abdel Sayed, M. H. Ahmed” Equivalent strut width for modeling r.c. infilled frames”, N. AL-Mekhlafy et al., Equivalent strut width for modeling R.C. infilled frames, pp. 851 - 866 7. Hiten L. Kheni, Anuj K. Chandiwala” Seismic Response
of RC Building with Soft Stories”, International Journal of Engineering Trends and Technology, Volume 10, Number 12 ,Apr 2014 .
8. Murali Krishna“ Optimum Location of Different Shapes of Shear Walls in Unsymmetrical High Rise Buildings”, International Journal of Engineering Research & Technology, Vol. 3 Issue 9, September- 2014 .
© 2017, IRJET | Impact Factor value: 5.181 | ISO 9001:2008 Certified Journal
| Page 1976
Sciences, Vol.3 , Issue 14,October2012