© 2017, IRJET | Impact Factor value: 6.171 | ISO 9001:2008 Certified Journal | Page 595
Analysis of various cluster algorithms based on flying insect wing beat
sounds and their spatio-temporal features
S.Arif Abdul Rahuman
1, Dr.J.Veerappan
21
Prof/CSE, M.E.T Engineering College, Tamilnadu, India
2
Prof/ECE, Vel Tech High Tech Dr.Rangarajan Dr.Sakunthala Engineering College, Tamilnadu, India
---***---Abstract -
Our lifestyle and ecosystem are directly or indirectly associated with insects. This association results in both beneficial and unfavorable response to human life. Presently, a lot of open issues are there with the impact of insects on ecosystem which need immediate attention. The paper includes process of detecting and monitoring of insect species that threaten biological resources, in both productive and native ecosystems, particularly for pest management and biosecurity, is the issue focused in this paper. A lot of novel and relevant applications have emerged in the field of clustering. However, the researchers feel the task as a very difficult one to digitize the process of clustering. The data relevant to the flying insects often changes over time, and clustering of such data is a central issue. Hence in this research work, a novel classification approach based on the dynamic time warping (DTW) algorithm is proposed and it uses to detect the insects’ sound based on their spatio-temporal features and Hidden Markov Model to cluster the temporal sequence and identify the vector density along with the type of insect. Again this clustering framework includes a comparative study on various clustering algorithms such as Agglomerative Hierarchical clustering, k-means clustering, and Expected Maximization clustering. The same framework also compares the performance against soft computing techniques such as Neural network clustering and Genetic algorithm and shows Hidden Markov Model outperforms other statistical and soft computing techniques.Key Words: Dynamic Time warping, Hidden Markov Model, Agglomerative Hierarchical clustering, k-means clustering, Expected Maximization clustering
1. INTRODUCTION
In data mining, a field of computational entomology, a sub-field of data mining provides efficient algorithms for classification, clustering, spatiotemporal analyses, rule discovery etc. regarding insects exploration and help the researchers [1]. The Entomologists are aiming at reducing the effect of unwanted species. Since certain species are secretive, sensitive to disturbance, it is not easy to observe and catch. There are some blanket methods available and proven to be successful, but they are costly and create environmental problems. The framework includes process of detecting and monitoring of insect species that threaten biological resources, in both productive and native ecosystems, particularly for pest management and biosecurity, is the issue focused in this research work.
Additionally, there is potential for deployment of sensors to obtain detailed spatio-temporal information about insect-density related to environmental conditions, for precision agriculture. Smart sensors are being developed with the aim of protecting the ecosystem just by counting and classifying the insects, so that the automated process enables user to eradicate the harmful insects in the target location but not viable in large areas of time-series data.
The data relevant to the flying insects often changes over time, and classification of such data is a central issue [2]. Hence in this research work, a novel classification approach based on the dynamic time warping (DTW) algorithm is proposed and it uses Hidden Markov Model to cluster the temporal sequence and identify the vector density along with the type of insect.
The clustering framework is evaluated under
(i) Benchmark dataset
(b) www.kaggle.com/heuristicsoft/dataset /for-classification/ (mosquito –male/female)
(ii) With recorded dataset and
(iii) Uploaded dataset on Kaggle
The proposed work includes major process of performing clustering in order to identify the type of insect and quantify the vector density of identified insects.
2. RELATED WORK
In [3], authors uses probabilistic model to Estimates the similarity of two audio signals using a set of features calculated in short intervals. Then probabilistic models are estimated for the feature distributions. When a small amount of signals is retrieved (low recall / high precision) the HMM likelihood test produces the best accuracy. In our proposal Hidden Markov Model uses seven spatio-temporal features. In [4]. Authors used a finite mixture of hidden Markov models (HMMs) is fitted to the motion data using the expectation-maximization (EM) framework. It reduces the number of clusters and consequently the classification accuracy. The clustering-based classifier achieved comparable performance, but without the need for class labeling provided in the supervised learning approach.
© 2017, IRJET | Impact Factor value: 6.171 | ISO 9001:2008 Certified Journal | Page 596 Hidden Markov Model is proposed in our research work and
it needs no class labels for clustering. In [5], authors computes Eigen vectors from affinity matrix and clusters dominant Eigen vectors using k-means clustering. It is a Simple method of clustering. More samples of rare actions are essential to produce better recognition. Here the computed Eigen vectors may sometime lead to bad clustering as it uses the whole affinity matrix. In our work, Clustering is done based on the hidden states too. In [6], using support vector machines (SVMs) five classes are recognized (silence, music, background sound, pure speech, and non-pure speech). Eight features such as zero crossing rates (ZCR), short time energy (STE), sub-band powers distribution, brightness, bandwidth, spectrum flux (SF), band periodicity (BP), and noise frame ratio (NFR) are used for classification. Three classifiers are used to prove the efficiency of features. Baseline classifier with ZCR, STE and bandwidth and next classifier with power distributions and third classifier with BP, SF and NFR. Here high signal to noise ratio is used and shown good accuracy.
3. CLUSTERING ALGORITHMS
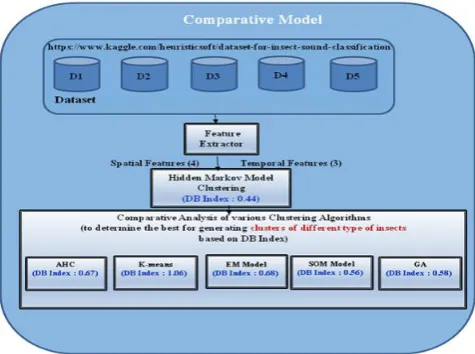
[image:2.595.316.550.444.588.2]Monitoring insects by the sounds they produce is an important and challenging task, whether the application is outdoors in a natural habitat, or in the controlled environment of a laboratory setting. Researchers nowadays implement clustering algorithms on recorded sounds to form disjoint subsets (clusters) based on certain similarities to identify the type of insects and to find their vector density. Clustering algorithms are used for identification of types of insects using acoustical sounds in order to assess population, either for evaluating the population structure, population abundance and density, or for assessing animal seasonal distribution and trends.
Fig -1: Comparative Model of Clustering Algorithms
Clustering techniques are applied on the acoustical sounds based on the type of data being clustered and how much pre knowledge is available. Most of the clustering techniques do not produces accurate results with simple template matching. And even scaled template matching is complex because of decay in certain portions of sound,
variation in frequencies etc. Comparative Model of Clustering Algorithms is shown in Fig. 3.1
3.1 Hidden Markov Model
This model [5] works well with sounds that change in duration as it can sustain portion of the sound in all situations. To find what feature values correspond to which categories – clustering is performed. Many clustering techniques are available depending on the type of data being clustered and how much pre knowledge is available. Most of the sounds put into the same category have wide variation in which simple template matching fails and scaled template matching is complex because of decay in certain portions of sound, variation in frequencies etc.
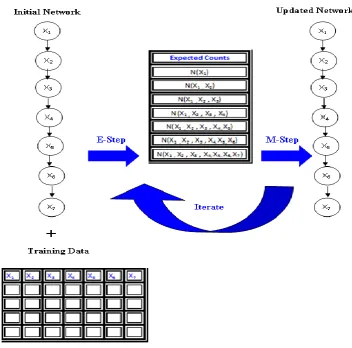
[image:2.595.42.280.495.672.2]Hidden Markov Model shown in fig. 2 works well with sounds that change in duration as it can sustain portion of the sound in all situations mentioned above. Hidden Markov model λ can be viewed as a Markov model whose states are not directly observed: instead, each state is characterized by a probability distribution function, modeling the observations corresponding to that state. The hidden states - valid stages of a dynamic process Learning the HMM parameters - given a set of observed sequences {Oi} determine the parameters maximizing the likelihood P({Oi}|λ). Train one HMM λi for each observed sequence Oi. Compute the distance matrix D = {D(Oi , Oj )} representing a similarity measure between sequences (Euclidean Distance measure).
Fig -2: Hidden Markov Model
Use a pair wise distance-matrix-based method to perform the clustering HMM, a probabilistic graphic model captures the dependencies between consecutive measurements easily. The clustering result is evaluated based on the data that was clustered itself.
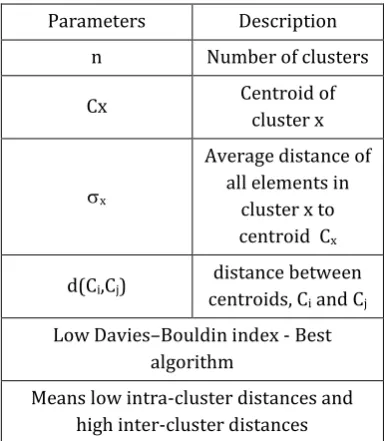
© 2017, IRJET | Impact Factor value: 6.171 | ISO 9001:2008 Certified Journal | Page 597 Table -1: Parameters of Davies–Bouldin index
Parameters Description n Number of clusters
Cx Centroid of
cluster x
x
Average distance of all elements in
cluster x to centroid Cx
d(Ci,Cj) distance between centroids, Ci and Cj Low Davies–Bouldin index - Best
algorithm
Means low intra-cluster distances and high inter-cluster distances
3.2. Agglomerative Hierarchical Clustering
Groups the data one by one on the basis of the nearest distance measure of all the pair wise distance between the data point of the feature vectors of the input audio file. Again distance between the data point is recalculated and ward's method (sum of squared Euclidean distance) is used to find the optimal pair of data point (minimum distance) [7].
Fig -3: Spatio-temporal Features of insects
3.3. K-Means Clustering
Let X = {x1,x2,x3,……..,x7} be the set of data points of the feature vectors and V = {v1,v2,…….,v7} be the set of centers. The main goal of this method is to minimize the sum of the variances within the partitions of the data that are associated with one centroid. Let X = {x1,x2,x3,……..,x7} be the set of data points of the feature vectors and V = {v1,v2,…….,v7} be the set of centers.
The main goal of this method is to minimize the sum of the variances within the partitions of the data that are associated with one centroid [8, 9].
1. Select each cluster center.
2. Calculate the distance each data point of the feature vector and cluster center.
3. Assign the data point to the cluster center whose distance from the cluster center is minimum of all the cluster centers.
4. Recalculate the new cluster center using Vi = (1/Ci) Xi
5. Recalculate the distance between each data point and new obtained cluster centers.
6. If no data point was reassigned then stop, otherwise repeat from step 3
3.4. Expectation-Maximization Clustering
The EM clustering algorithm computes probabilities of cluster memberships based on one or more probability distributions. The goal of the clustering algorithm then is to maximize the overall probability or likelihood of the data, given the (final) clusters [10]. In the Expectation step, for each database record x, compute the membership probability of x in each cluster h = 1,…, k. and in the Maximization step, updates mixture model parameter (probability weight).
3.5. Neural Network Clustering – Self Organizing
Map Algorithm
This clustering methodology follows a output layer network topology (1D or 2D representation) and then assigns weights to input layer, using the Euclidean distance of each node, and from weight vectors (wj ) associated with each output node [11].
Training data: Vectors, X
– Vectors of length n (x1,1, x1,2, ..., x1,i,…, x1,n)
(x2,1, x2,2, ..., x2,i,…, x2,n) …
(xj,1, xj,2, ..., xj,i,…, xj,n) p distinct training vectors …
(xp,1, xp,2, ..., xp,i,…, xp,n)
[image:3.595.47.267.444.560.2]© 2017, IRJET | Impact Factor value: 6.171 | ISO 9001:2008 Certified Journal | Page 598 Fig -4: K-Means Clustering
Cluster Purity = 1/ N(max(no. of objects in each class))
[image:4.595.86.510.85.270.2]Purity = 1/33 (max(20,13) = 0.6060
[image:4.595.119.472.373.721.2]© 2017, IRJET | Impact Factor value: 6.171 | ISO 9001:2008 Certified Journal | Page 599 Fig -6: Neural Network Clustering
Algorithm
1. Select output layer network topology (1D or 2D representation)
– Initialize current neighbourhood distance, D(0), to a positive value.
2. Initialize weights from inputs to outputs to small random values
3. Let t = 1
4. While computational bounds are not exceeded do i. Select an input sample, i1
ii. Compute the square of the Euclidean distance of i1 from weight vectors (wj ) associated with each output node
iii. Select output node j* that has weight vector with minimum value from step (ii)
iv. Update weights to all nodes within a topological distance given by D(t) from j*, using the weight update rule
v. Increment t 5. End while
3.6. Genetic Algorithm Clustering Model
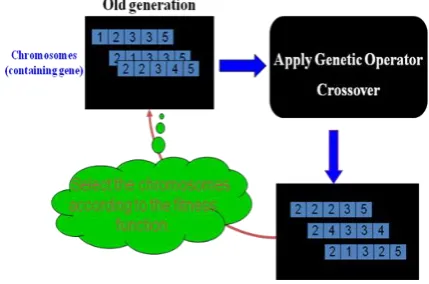
In the clustering problem, the solutions best fitting the data is then chosen according to a suitable criterion. The algorithm starts with initial population and next population is generated by applying genetic operator then the new population with highest fitness score is selected and this process gets repeated until stopping criteria is met [12].
Algorithm
Generate initial population P(t);
//with the activation values and the cluster centroids Evaluate P(t);
//Use Fitness function -Calinski-Harabasz (CH) index
//the quotient between the intra-cluster average squared distance and the inter-cluster average squared distance While stopping criterion not satisfied do
1. Select parent population P0(t) from P(t); // finding the one with the highest fitness
2. Apply genetic operators to P0(t) P(t + 1); // finding the one with the highest fitness
3. Replace random solutions in P(t + 1) with the best B solutions in P(t);
4. Evaluate P(t + 1); // apply fitness function CH index 5. t = t + 1;
[image:5.595.327.542.292.434.2]Result: Best solution (highest fitness value) of the population in the last generation.
Fig -7: Genetic Algorithm Clustering Model
4. COMPARATIVE STUDY: EXPERIMENTAL SET UP AND DISCUSSION OF CLUSTERING MODELS
Hidden Markov Model clustering is used to group the type of insects. Performance analysis model is constructed by comparing the average intra cluster, and inter cluster of HMM clustering against other clustering algorithms on the benchmark dataset and uploaded dataset. Based on intra cluster and inter cluster values, DB index is computer and used as another performance metric for evaluation on the benchmark as well as the uploaded dataset.
HMM : Benefits: Flexible to handle variable-length data (time-series data), Easy handling of similarity distance measure(Euclidean distance measure)
Table 1: Comparison of clustering algorithms
Clustering
Algorithm Benefits Drawbacks
HMM
Flexible to handle variable-length data (time-series data) Easy handling of similarity distance
© 2017, IRJET | Impact Factor value: 6.171 | ISO 9001:2008 Certified Journal | Page 600 measure(Euclidean
distance measure) index)
AHC
No priori information about the number of clusters required. (unknown type of insects)
Not suitable for large dataset. (our dataset is too large)
k-means
Suitable for large data set and produces tighter cluster. (good identification of type of insects)
Presence of noise makes the clustering difficult. (our dataset includes noise)
EM Model
Fast, handles high dimensionality data set
Presence of noise makes the clustering difficult (our dataset includes noise)
SOM
Capable of organizing complex data sets (suitable for our time-series data)
Performance gets decreased as the number of cluster increases. (difficult when the test data contains more insects sound)
GA
It produces optimized result. (optimal among feasible solutions)
Repeated fitness function evaluation (repeated evaluation of CH index)
5. RESULT AND DISCUSSIONS
The Hidden Markov model performs clustering with the best db index of 0.440 on the uploaded dataset, kaggle and 0.495 for benchmark dataset, ESC-50 dataset and identifies the type of insects by approximately estimating their vector density.
Fig -8: Performance Analysis in terms of intra and inter clustering average of various clustering algorithms-
[image:6.595.33.300.87.444.2]Kaggle.com for Recorded Data set
[image:6.595.311.553.313.495.2]Fig -9: Performance Analysis in terms of DB index of various clustering algorithms
Fig -10: Performance Analysis in terms of intra and inter clustering average of various Clustering algorithms- ESC
50 – Bench Mark dataset
[image:6.595.112.543.559.718.2]© 2017, IRJET | Impact Factor value: 6.171 | ISO 9001:2008 Certified Journal | Page 601
6. CONCLUSIONS
Hidden Markov Model is simple and flexible with time-series data of insects sound with any frequency. Agglomerative Hierarchical clustering do not require any priori information for clustering and identifying the type of insects. K-means clustering is best suited for large dataset with any frequency. Expectation Maximization Model works faster with high dimensional dataset and identify the type of insects immediately. Self Organizing Map is manageable with high dimensional and complex dataset even if outliers are present. Genetic Algorithm produces optimal results in identifying types of insects. This framework has used
Dynamic Time Warping (DTW) algorithm for generating the similarity measure between two temporal sequences which may vary in speed. Cluster analysis of unknown acoustic data is a hard problem, yet HMM achieves a mean to group sounds based on spatio-temporal features. The computational cost incurred for HMM Clustering is relatively low and the resulting model is quicker to train. HMM clustering is compared to other clustering algorithms like agglomerative hierarchical clustering, k-means clustering, Expectation Maximization, Self Organizing map and Genetic clustering algorithms and the following conclusions are drawn: As number of clusters increases the performance of k-means and AH increases but, the performance of SOM gets decreased. All the clustering algorithms are ambiguous to noisy data. K-means, EM and AHC are very sensitive to noise. If the dataset is too large, then k-means and EM performs good. AHC and SOM sound good with smaller data set.
REFERENCES
[1] Skyler Seto, Wenyu Zhang, Yichen Zhou, 2015 “Multivariate Time Series Classification Using Dynamic Time Warping Template Selection for Human Activity Recognition.” 978-1-4799-7560-0/15/$31 c IEEE
[2] Yanping Chen, Adena Why, Gustavo Batista, Agenor Mafra-Neto, Eamonn Keogh, 2014, “Flying Insect Classification with Inexpensive Sensors.” Journal of Insect Behavior September, Volume 27, Issue 5, pp 657– 677
[3] Tuomas Virtanen and Marko Helen, “Probabilistic Model Based Similarity Measures For Audio Query-by-example.” in 2007 IEEE Workshop on Applications of Signal Processing to Audio and Acoustics, NY, USA.
[4] Jonathan Alon, Stan Sclaroff, and George Kollios, “Discovering Clusters in Motion Time-Series Data.” Boston University Computer Science Tech. Report No. 2003-008, March 26, 2003
[5] Maryam Moslemi Naeini, Greg Dutton, Kristina Rothley, and Greg Mori , “Action Recognition of Insects Using Spectral Clustering.” Proceedings of the IAPR
Conference on Machine Vision Applications (IAPR MVA 2007), May 16-18, 2007, Tokyo, Japan
[6] L. Lu et al, “Content-based audio classification and segmentation by using support vector machines” Multimedia Systems, vol.8, no.6, pp.482-492, 2003
[7] Enrique Alexandre, Manuel Rosa, Lucas Cuadra, and Roberto Gil-Pita,” Application of Fisher Linear Discriminant Analysis to Speech/Music Classification”, Journal of the Audio Engineering Society, May 2006
[8] Dhiman Mondal, Deepak Kumar Kole,“Detection and Classification Technique of Yellow Vein Mosaic Virus Disease in Okra Leaf Images using Leaf Vein Extraction and Naive Bayesian Classifier”, 2015 International Conference on Soft Computing Techniques and Implementations.
[9] Oyelade, O. J, Oladipupo, O. O, Obagbuwa, I. C “Application of k-Means Clustering algorithm for prediction of Students’ Academic Performance”
[10] Michael I. Mandel, J.Weisis, “Model-Based
Expectation-Maximization Source Separation and Localization”, IEEE Transactions on Audio, Speech, and Language Processing, Vol. 17, No. 8, November 2009
[11] Luqman R. Bachtiar, Charles P. Unsworth,” Using
Artificial Neural Networks to Classify Unknown Volatile Chemicals from the Firings of Insect Olfactory Sensory Neurons ”, 33rd Annual International Conference of the IEEE EMBS, 2011
[12] Masataka Fuchida , Thejus Pathmakumar , Rajesh Elara