© 2017, IRJET | Impact Factor value: 5.181 | ISO 9001:2008 Certified Journal | Page 2781
Financial Evaluation of Solar Powered Absorption Cooling System for
Computer Laboratory
Khagendra Kumar Upman
a*, B.L.Gupta
b, Dhananjay Kumar
cPrashant Kumar Baheti
da,c
Apex Institute of Engineering and Technology Jaipur
302017 India.
b
Department of Mechanical Engineering, Govt. Engineering College Bharatpur 321001 India.
dDepartment of Computer Science and Engineering, Govt. Engineering College Bharatpur 321001 India.
---***---Abstract: In this paper financial evaluation of solarthermal cooling system for a computer laboratory has been carried out. The computer lab has the floor and roof area 198.55 m2 .The peak cooling load is calculated and it is 34.940 kW, accordingly 10TR vapor absorption cooling system was adopted and it is operated by a field of collector area varying from 80-120 m2.. The simulation was carried out on TRANSOL Program for Bharatpur city situated in east of Rajasthan (INDIA). It can be conclude that solar thermal cooling system is technically feasible because it offers good solar fraction in the range of 0.52-0.75. In the solar thermal cooling system as the collector area increases the solar fraction also gets increased but after an optimum collector area it starts decreasing because at elevated temperature heat losses are also higher. Financially with the present cost structure, solar thermal cooling system is not feasible due to high initial cost of vapour absorption chiller, and solar collector. Due to high initial cost it provides only marginal annual savings that result in very high payback periods (67-83 years). Sensitivity analysis shows that in coming future the as the total investment cost decreases and electricity prices increases, the payback period came down.
Keywords: Vapor Absorption system, solar thermal Collector, Solar Fraction, Primary Energy
1. Introduction
To improve the thermal comfort conditions, particularly in the summer season, there is growing demand of conventional vapour compression air conditioners. This growing demand not only increases electricity consumption but also global warming. Building architectural characteristics and trends like increasing ratio of transparent to opaque surfaces in the building envelope to even popular glass buildings has also significantly increased the thermal load on the air conditioners [Henning 2007]. The conventional vapour compression refrigeration cycle driven air conditioner using grid electricity, increases the consumption of electricity and fossil energy. Energy sources based on fossil
fuels such as coal, oil, gas, nuclear, etc., are cause serious environmental hazards and are scarce in nature, location and volume. To reduce environmental pollution and global warming in Balghouthi et al. [2005] suggested the solar power air conditioning in place of conventional vapour compression air conditioning systems. Pongtornkulpanich et al. (2008) share the experience with fully operational solar driven 10 ton LiBr/H2O single effect absorption
cooling system in Thailand. They analyzed the data collected during 2006 and show that 72 m2 evacuated tube
solar collector delivered a yearly average solar fraction of 81%, while LPG –fired backup unit supplied the 19% thermal energy. They show that the initial cost of installation is higher than that of the conventional vapour compression system due to higher cost of solar collector array and chiller. Technology advancement, large production, and increase in price of electricity in future can make it more cost competitive with the conventional system. Eicker et al. (2009) develops a full simulation model for absorption cooling systems, combined with a stratified storage tank, dynamic collector model and hourly building loads. They found that depending on control strategy, location and cooling load time series, between 1.7 and 3.6 m2 vacuum tube collector per kW
cooling load are required to cover 80% of the cooling load. Y Hang et al. (2011) carried out economical and environmental assessment of an optimized solar cooling system for a medium sized benchmark office building in Los Angeles (California) having the floor area 4983 m2. In
this building 150 kW capacity absorption chiller was used with varying collector area of 80-490 m2. The Payback is
calculated as 13.8 years when the 40% subsidy is provided on capital investment.
© 2017, IRJET | Impact Factor value: 5.181 | ISO 9001:2008 Certified Journal | Page 2782
of solar thermal cooling systems has been performed considering the annual solar fraction and relative primary energy savings. In the solar thermal cooling system, three types of collectors (FPC, ETC and CPC) with wide variance of area ranging from 80 m2-120 m2 have been considered.
2 Solar Thermal Cooling Systems
[image:2.612.317.582.116.442.2]This system is simulated using a configuration SCH 601 from the program as shown in the fig 1. This configuration shows the complete heating, cooling and domestic hot water application. In this study only cooling is considered for analysis purpose. The solar thermal cooling system is composed of a solar collector field, solar storage tank, heat exchanger, cold storage tank and vapour absorption chiller. The solar collector field captures energy from the sun and exchanges it with the solar storage tank through an external heat exchanger. Two pumps are used in the solar collector loop, one is from solar collector to heat exchanger and another is from heat exchanger to solar storage tank. These pumps are known as primary and secondary pump respectively and operated by solar loop control depending on solar radiation intensity. The pump flow rate is constant. The system stops the pumps if the temperature in the solar storage tank exceeds the maximum security value. A vapour absorption machine (VAM) is directly connected to the solar storage tank, this machine is turned on when cooling is required and the temperature of the solar tank is over a set point temperature [Bongs, 2009]. The heat coming from the absorber and condenser is released by cooling tower controlled by a variable frequency drive that increases energy efficiency and reduces electrical energy consumption. The cold water coming out from the evaporator of vapour absorption machine is stored in the cold storage tank. An electrically operated compression cooling machine is used as a backup in order to cover complete cooling demand of the building. This compression cooling machine is operated when there is need for cooling and the temperature of the cold storage tank is below than the specified set point temperature.
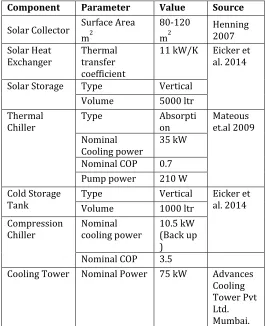
Table 1: Parameters considered for simulation of solar thermal cooling system
3 Specification of building coupled with solar air conditioning.
The building being used in this research work is a computer lab situated in Government engineering college, Bharatpur rectangular shape building with envelope of 15.69 m length and 12.65 m width. The height of the building is 3.64 m and total floor area is 198.55 m2. The
entire building is used for laboratory purpose in day time only and whole area is conditioned .The detail dimension of building is given as follows:
1. Length of building = 15.690 m 2. Width of building = 12.655 m 3. Height of building = 3.64 m
4. Dimensions of 5 south wall glass windows = 1.65 × 1.5 m
5. Dimensions of 5 west wall glass windows = 1.65 × 1.5 m
6. Dimension of north wall door = 2.55 × 1.5 m 7. Dimension of north wall door = 2.52 × 0.92 m
Component Parameter Value Source
Solar Collector Surface Area m2
80-120 m2
Henning 2007 Solar Heat
Exchanger Thermal transfer coefficient
11 kW/K Eicker et al. 2014
Solar Storage Type Vertical Volume 5000 ltr Thermal
Chiller Type Absorption Mateous et.al 2009 Nominal
Cooling power 35 kW Nominal COP 0.7 Pump power 210 W Cold Storage
Tank Type Volume Vertical 1000 ltr Eicker et al. 2014 Compression
Chiller Nominal cooling power 10.5 kW (Back up )
Nominal COP 3.5
© 2017, IRJET | Impact Factor value: 5.181 | ISO 9001:2008 Certified Journal | Page 2783
Fig.1: Schematic of solar thermal cooling system [TRANSOL]
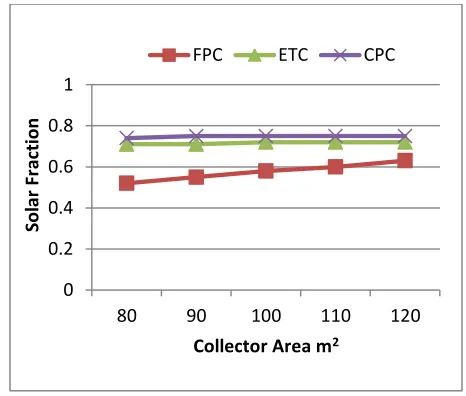
4. Solar Fraction
It is the ratio of the annual cooling effect produced by the solar to the total annual cooling demand of the building.
Fig 2 shows the variation of solar fraction for various collector area of FPC, ETC and CPC. It is clear from the fig 4 that in FPC, as the collector area increases the solar fraction also increases because more heat is collected by the collector and supplied to the solar thermal cooling system that produce the more amount of solar cooling. At small collector area of 80 m2 the annual heat production is
low for Bharatpur city and solar thermal cooling system produce the low amount of cooling If the collector area is increased from 80 m2 to 120 m2 the solar fraction
increases from 52 % to 63 %..In the solar thermal cooling system when ETC type collector is used than as the area of collector is increased then the solar fraction is also increase but after an optimum collector area it starts constant because the elevated temperature heat losses are also higher. If we utilize a high collector area then we have to increase either the capacity of storage tank or the cooling demand of the building otherwise there will be no effect of collector area after an optimum value. The solar fraction has been observed as 0.71, 0.71, 0.72, 0.72, and 0.72 for the area of 80m2, 90 m2, 100 m2, 110 m2 and
120m2 for the Bharatpur city. The solar fraction has been
observed for CPC as 0.74, 0.75, 0.75, 0.75, and 0.75 for the
area of 80m2, 90 m2, 100 m2, 110 m2 and 120m2 for the
[image:3.612.54.258.100.294.2]Bharatpur city.
Fig 2 Solar fraction for different areas
5. Economic Analysis
To plan any energy project such as solar cooling systems, economic consideration form the basis for decision making. All the cost over the entire life cycle can be grouped into three categories: capital costs, which contain the major equipment cost including installation, maintenance cost and operating cost for the cost of energy and other material inputs in the system. It is assumed that in India, there is no demolition cost. Table 2 shows the cost of the components associated with the solar thermal cooling and reference system.
Table 2 Cost and parameters considered in the calculation
S.N
o. Component Size Unit Price Source
1 Solar collector –
FPC 120 80-m2
Rs/m2 6250 Sunwas Energy savings systems Jaipur 2 Solar collector –
ETC 120 80-m2
Rs/m2 9300 Mamta Energy Gujarat 3 Solar collector –
CPC 120 80-m2
Rs/m2 1350
0 Energy Orja Engg services Hyderab
ad 4 Hot Storage Tank
-HST 5 m
3 Rs 4000
00 EngineerMetasis ing Pune
0 0.2 0.4 0.6 0.8 1
80 90 100 110 120
So
lar
Fr
ac
tion
Collector Area m2
[image:3.612.331.564.109.307.2]© 2017, IRJET | Impact Factor value: 5.181 | ISO 9001:2008 Certified Journal | Page 2784
5 Compression
Chiller 10.5kW Rs 280000 TechnoloArh gy Pvt.Ltd 6 Packaged Air
Conditioner 35 kW Rs 500000 h Aircon Climatec Engineer
ing Pvt. Ltd. Jaipur 7 Absorption
Chiller 35 kW Rs 1800000 Mamta Energy Gujarat 8 Cooling tower 90 kW Rs 6580
0 s Cooling Advance Tower Pvt Ltd. Mumbai 9 Electricity
Rate(Average for all considered
cities)
- Rs/kW
h 8.58 Bharatpur electricit
y services
limited 10 Conversion
factor electricity - kWhel/k Wh primar
y energy
0.36 Eicker et al. 2014
6. Pay back Analysis
Payback time for each option is calculated using the following equation [Eicker et al. 2014].
Payback time in the hot and dry climate with 100 m2 flat
plate collector is calculated as
Fig.3 Pay back years with collector area
Fig.3 shows the payback time for the considered simulation cases in this study. It can be easily noticed from the table that all the payback periods are much higher than the system life, thereby meaning practically no payback in
any of the cases. Evacuated tube type collector possesses a lower range of payback time than others.
7. Sensitivity Analysis
With the present cost structure in India the solar thermal cooling system is not feasible. In coming future as the investment cost becomes low and the cost of electrical energy based on fossils fuels increases then this cooling system may be feasible. To see the effect of investment cost on payback sensitivity analysis is carried out on the following parameter.
Parameter Range
1 Total investment cost
sensitivity analysis -50% to +50% 2 Electricity cost sensitivity
analysis -50% to +50%
It is observed from the 4 a that as the cost of total investment is decreased by 50 % the payback period also decreases and comes down to 37 year for FPC, 34 years for ETC and 35 years for CPC . At present costs in India the payback periods is 82 years, 66 years and 67 years for FPC,ETC, and CPC respectively. The effect of change in electricity cost on payback time after consideration the 50 % reduction in the investment cost is carried out. The effect of electricity cost on annual electricity savings and payback time respectively. From the fig 4 b it has been observed that as the electricity cost increases the annual electricity savings also increase thus the payback time decreases. In future, if the electricity prices are increased by 50 % then the payback will come down to 25, 22, 23 years for the FPC, ETC and CPC respectively.
0 20 40 60 80 100
FPC ETC CPC
P
ayb
ac
k
T
im
e
(ye
ar
s)
80 m2 90 m2 100 m2 110 m2 120 m2
0 2000000 4000000 6000000 8000000
-50% -40% -30% -20% -10% 0% 10
%
20
%
30
%
40
%
50
%
Capi
tal c
ost IN
R
Total investment variation
(%)Capital Cost-FPC Capital Cost-ETC
© 2017, IRJET | Impact Factor value: 5.181 | ISO 9001:2008 Certified Journal | Page 2785
[image:5.612.40.285.63.424.2]
Fig 4 Influence of total investment cost variation on (a) Capital cost (b) Annual savings (c) Payback time
8. Conclusions
It can be conclude from the performance analysis of the solar thermal cooling system that it is technically feasible because it offers good solar fraction in the range of 0.52-0.75 in the considered city and collector areas. The primary energy savings reaches up to 52%. Financially with the present cost structure, solar thermal cooling system is not feasible due to high initial cost of vapour absorption chiller, and solar collector. The high initial cost is also linked with high maintenance cost, where as it provides only marginal annual savings that result in very high payback periods (67-83 years). Sensitivity analysis shows that in coming future as the total investment cost decreases and electricity prices increases, the payback period came down. If the total investment fall down to its 50% and electric prices are hike by 50% than the payback period came down within the system life.
9 References
1. Assilzadeh F., Kalogirou S. A., Alia Y.,, Sopiana K., 2005 “Simulation and optimization of a LiBr solar absorption cooling system with evacuated tube collectors” Renewable Energy Vol.30., pp. 1143–1159. 2. Balghouthi M., Chahbani M. H., Guizani A., 2005 “Solar
powered air conditioning as a solution to reduce environmental pollution in Tunisia” Desalination Vol. 185, pp.105-110.
3. Bongs C. 2009 “Benchmarks for comparison of system simulation tools – Absorption chiller simulation comparison” A technical report of subtask C, Task 38 Solar Air-Conditioning and Refrigeration.
4. Eicker U., Colmenar-Santos A., Teran L., Cotrado M. 2014 “Economic evaluation of solar thermal and photovoltaic cooling systems through simulation in different climatic conditions: An analysis in three different cities in Europe” Energy and Buildings, Vol. 70, pp. 207-223.
5. Eicker U., Pietruschka D. 2009 “Design and performance of solar powered absorption cooling systems in office buildings” Energy and Building, Vol. 41, pp. 81-91.
6. Energy Conservation Building Code (ECBC) User Guide, Bureau of Energy Efficiency (2007).
7. Enibe S.O. 1997 “Solar refrigeration for rural applications” J Renew Energy, Vol. 12, pp. 157-67. 8. Fan Y., Luo L., Souyri B. 2007 “Review of solar sorption
refrigeration technologies: Development and applications” Renewable & Sustainable Energy Reviews, Vol. 11, issue 8, pp. 1758-1775.
9. Hammad M.A., Audi M.S.1992 “Performance of a Solar LiBr-Water absorption refrigeration system” Renewable Energy, Vol. 2, No. 3, pp. 275 -282.
10. Hang Y., Qu M., Zhao Fu. 2011 “Economical and environmental assessment of an optimized solar cooling system for a medium-sized benchmark office building in Los Angeles, California” Renewable Energy, Vol. 36, pp. 648-658.
11. Hartmann N., Glueck C. Schmidt F.P 2011 “Solar cooling for small office buildings: Comparison of solar thermal and photovoltaic option for two different European Climates.” Renewable Energy, Vol. 36, pp. 1329-1338.
12. Henning H.M. 2007 “Solar assisted air conditioning of buildings – an overview” Applied Thermal Engineering, vol. 27 pp. 1734–1749.
13. Kim D.S., Infante Ferreira C.A. 2008 “Solar refrigeration options – a state-of-the-art review” Int. Journal of Refrigeration, Vol. 31, pp. 3–15.
14. Lazzarin R.M. 2014 “Solar cooling: PV or thermal? A
0 20000 40000 60000 80000 100000
50
%
40
%
30
%
20
%
10
% 0%
-10% -20% -30% -40% -50%
Ann
u
al
savi
n
gs
Electricity cost variation (%)
Annual Savings-FPCAnnual Savings-ETC Annual Savings-CPC
0 50 100 150 200 250
50
%
40
%
30
%
20
%
10
% 0%
-10% -20% -30% -40% -50%
P
ayb
ac
k
ye
ar
s
Electricity cost variation (%)
Payback-FPC Payback-ETC
© 2017, IRJET | Impact Factor value: 5.181 | ISO 9001:2008 Certified Journal | Page 2786
thermodynamic and economical analysis” Int.Journal of Refrigeration, Vol.39, pp. 38-47.
15. Mateus T., Oliveira A.C. 2009 “Energy and economic analysis of an integrated solar absorption cooling and heating system in different building types and climates” Applied energy, Vol. 86, pp. 949-957.
16. Mazloumi M., Naghashzadegan M., Javaherdeh K. 2008 “Simulation of solar lithium bromide –water absorption cooling system with parabolic trough collector” Energy Conversion and Management, Vol. 49, pp. 2820-2832.
17. Pongtornkulpanich A., Thepa S., Amornkitbamrung M., Butcher C., 2008 “Experience with fully operational solar driven 10-ton LiBr/H2O single effect absorption cooling system in Thailand” Renewable energy Vol. 33, pp. 943-949.
18. TRANSOL, http://aiguasol.coop/en/transol-solar thermal -energy-software/ (accessed June 2017). 19. Tsoutsos T., Aloumpi E., Gkouskos Z., Karagiorgas M.
2010 “Design of a solar absorption cooling system in a Greek hospital” Energy and Building, Vol. 42, pp. 265-272.
20. Advances Cooling Tower Pvt Ltd. Mumbai 2014 “Quotation for supplying the cooling tower” at Government Engineering College Bharatpur (Raj.) India. 21. ARH Technologies Pvt. Ltd. Noida. 2014 “Quotation for
supplying the compression chiller” at Government Engineering College Bharatpur (Raj.) India.
22. Electricity bill of Govt. Engineering College Bharatpur provided by Bharatpur electricity service limited. 23. Metasis Engineering Pune. 2014 “Quotation for
supplying the hot storage and cold storage tank” at Government Engineering College Bharatpur (Raj.) India.