Efficient Road Traffic Noise Model for Generating
Noise Levels in Indian Scenario
V. Tripathi
1, A. Mittal
2and P. Ruwali
312Graphic Era University, Dehradun 3College of Engineering Roorkee
INDIA
ABSTRACT
The rapid increase in the motorization and urbanization to meet the needs of the people has resulted in increasing the number of vehicles in Indian roads during the past few years. With the great ease to public it has also resulted in degrading the environment to the greatest possible extents [5]. Besides gaining control over the air water and land now a new kind of pollution came into existence called noise pollution. Noise is considered variable in its nature and any time for the traffic in the road may depend speed of vehicles, volume of traffic and road conditions [4]. Thus, it becomes necessary to identify its levels by certain mechanism. Thus, in view of the problem been associated with generation of noise our work aims at carrying out the modification in the RTM and carry out comparative analysis of this model with Calixto model for our data set and give inferences on the basis of the study been conducted.
Keywords
Calixto model, Road traffic model (RTM), road traffic, noise.
1.
INTRODUCTION
Noise pollution is excessive, displeasing human, animal or machine-created environmental noise that disrupts the activity or balance of human or animal life. Various problems associated with noise include hearing loss, stress, sleep loss, distraction, lost productivity, masking speeches and a general reduction in the quality of life and opportunities for Tranquillity [6][5]. In addition, there are various studies carried out on road traffic noise pollution, which results in severe health problems such as, physical and psychological, irritation, human performance and actions [2][08], hypertension, heart problems, tiredness, headache and sore throat respectively [09]. India been a developing country is under a constant threat of it.. Migration of people, expanding cities, development of infrastructure, population explosion and urbanization are the factors which played a key role in motorization and thus, increasing the levels of various pollution.
The total urban population of India has increased considerably over the past three decades, rising from 109 million in 1971 to 160 million in 1981 and then 217 million in 1991 and 285 million in 2001[2].Urban traffic noise is one of the most critical types of noise and normally considered more interfering than the other types of noises. The major cause of noise pollution is the sound coming from the horns and sirens of the vehicles
comparison is conducted on the basis of the efficiency and
𝑅2
(coefficient of determination). All the analysis is conducted on the data been obtained from Dehradun Roorkee highway (NH 58). It comprises of the hourly volume of vehicles, percentage of heavy vehicles and observed value of noise which is obtained by the mathematical modelling of road traffic noise prediction [1]. The observed value of noise is obtained using noise analyzer (B & K 2260 sound level meter. This sound meter measures the value of noise in dB A. dB A roughly corresponds to the inverse of the 40 dB (at 1 kHz) equal-loudness curve for the human ear Thus, we carried out the comparative analysis of the rtm and calixto model on the basis of 𝑅2(Coefficient of Determination) and efficiency. Hence found rtm to be much better as compared to the calixto model in accordance with the Indian road conditions.
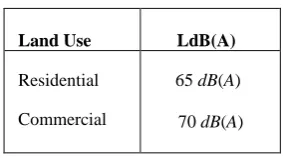
[image:1.595.344.486.452.531.2]Noise impact criteria for different land uses close to highways established by Federal Highway Administration (FHA) are given as:
TABLE 1. Different noise levels at different locations
Land Use LdB(A)
Residential Commercial
65 dB(A)
70 dB(A)
Since traffic conditions and vehicle types are far more different in India from those in Western countries, it becomes necessary to carry out the investigation of the data within the Indian environment.
2.
PROPOSED MODEL
Proposed model is optimized road traffic model according to Indian conditions and found that the model gives good results in these conditions. Road traffic noise model does not only rely on the volume of vehicles and percentage of heavy vehicles alone but also on the mean speed of vehicles and on the several road conditions such as height and width of road as well as road gradient[3]. Thus, more accurate results of measurement can be expected.
Indian traffic and road conditions, the result comes out to be significantly positive. The road traffic model as shown by the given equations 1, 2 and 3 depends on significant number of factors concerning both the road dimensions and road traffic. The main advantage of considering the large number of factors involved in the noise generation process is accuracy. Because of laying emphasis over the large number of aspects the result obtained in the RTM are much more accurate and closer to the actual value of the noise levels.
In order to show the effectiveness of the RTM in Indian scenario we compare it with the Calixto model which is another type of model for the measurement of noise been generated by the running traffic along the roads.
Figure1. Describes the pictorial representation of proposed Road Traffic Model. The process of generation of noise levels is described in three main steps. In the first step we give various road traffic flow factors and road dimension effect as an input to the model. These factors are then put across the function of the road traffic model and the equivalent levels of the noise are generated through this data. The function been used for the calculation in road traffic model first calculates the road traffic flow effect which can be given by equation 1, while road dimension effect is calculated through equation 2, and the equivalent sound pressure levels are calculated from equation 3 and 4.
This model carries out calculation of two factors NV and ∆𝐷 which represents road traffic and speed effect and road dimensions effect respectively. These factors are further used up in a relation to obtain the value of noise levels along the road side for that time interval.
The formula for calculation of these effect can be given as follows:
a). Calculation of traffic flow and traffic speed effect
NV (dbA) = (7.228 log𝑁𝑖) - (0.238* log 𝑉𝑖) + (.208 * P) (1)
Figure1. Graphical representation of Road Traffic Model (RTM)
Where,
𝑁𝑖 = number of vehicles (v/hr)
𝑉𝑖 = mean speed of vehicles (km/hr) P = percent of heavy vehicles (%) b). Calculation of road dimensions effect
∆𝐷 = (5.624 * 10−4L) - (8.13 * 10−2 W ) - ( 3.71 * 10−2 H ) - ( 7.65 * 10−2 𝑆 ) (2)
Where,
L = length of road section (m) W = width of road section (m)
H = height of building around the road (m) S = gradient of road section (%)
c). Calculation of equivalent sound pressure levels along the road side.
𝐿𝐴𝑒𝑞 𝑟𝑒𝑓 𝑑𝑏𝐴 = 27.931 + ∆𝐷 + ∆𝑁𝑉 (3)
d). Calculation of equivalent sound pressure level (𝐿𝐴𝑒𝑞) in other distances from road side:
𝐿𝐴𝑒𝑞 dbA = 𝐿𝐴𝑒𝑞 𝑟𝑒𝑓 − ∆𝑒 (4)
Where,
∆𝑒=effect of distances, surface, foliage, air temperature, humidity, and barriers (dbA)
We have also applied CALIXTO Model to compare with our proposed model.
The Calixto model is basically a statistical technique which is used for carrying out the generation of noise by considering the various road traffic factors and provides us with the levels of noise corresponding to that road traffic conditions. This models as shown in fig.1 takes percentage of heavy vehicles and volume of vehicles i.e number of vehicles passing through the highway at a certain time period as input and provide us with the levels of noise been generated by the vehicles[1]. The calixto model is also based on the fact that heavy vehicles are responsible for greater production of noise in comparison to the lighter vehicles. Taking in view of this concern it also includes a weighting factor in its equation for generation of noise levels [7].
The main advantage of the Calixto model is the compactness of the equations for the measurement of noise. As the model consider very less number of factors for the generation of noise levels, but this may also result in giving higher degree of approximate results in some cases.
Figure2 Here describes the graphical representation of calixto model. The input given to the Calixto model is percentage of heavy vehicles and volume of traffic (which is hourly flow of vehicle across the highway). this input data is put across the Calixto model main equations for the calculation of equivalent value of the traffic flow and thus, the equivalent noise levels are obtained corresponding to each entry of the input been given. The equations used for the calculations of the noise level are described in equation1 and equation 2.
RTM (Road Traffic Model)
(FUNCTION)
Road Traffic Flow
Road Dimension Effects
Figure2. Graphical representation of Calixto Model
The calixto model is calculated in two steps in the first step we carry out the calculation of equivalent value of volume represented by 𝑄𝑒𝑞which is then further been put across another equation for carrying out the calculation of 𝐿𝑒𝑞 which represents the actual value of generated noise.
The calixto model is given by the formula as
𝑄𝑒𝑞 = Q [1+n*VP/100] (5) Where,
Q is total volume of traffic which includes both heavy and light vehicles that passes through the road at a certain time interval. VP is the percentage of heavy vehicles in the road data n is weighting factor
𝑄𝑒𝑞 is the equivalent value of the traffic flow across the area.
n here represents the weighting factors as discussed earlier the heavy vehicles are responsible for the generation of stronger noise under the speed limits been assumed under calixto model[7].
The equation representing the generation of noise is given by:
𝐿𝑒𝑞 = 10 log (𝑄𝑒𝑞) (6) Thus, from the above two equations we can generalise calixto with the following equation.
Thus,
𝐿𝑒𝑞 = 10 log ( Q ( 1 + n * VP / 100 )) (7)
Under the given circumstances and conditions the most adequate value of n is calculated to be equal to 9.5 [7].
3.
RESULTS AND DISCUSSIONS
Our main aim is to propose the model for the generation of levels of noise for Indian traffic conditions and to measure the effectiveness of this model. In order to measure the strength of this model we applied the RTM over the data set been obtained from the Roorkee-Dehradun highway (NH-58). This data set is also been applied over the Calixto model for drawing up a comparison in between the two models on the basis of the result been obtained from the two models. With the available input
between the two models the values obtained from the model are been compared with the observed values of noise.
We carried out the comparison between both on the basis of two factors 𝑅2(coefficient of determination) [1] and the average efficiency whenthe generated noise is compared with the observed value of noise.
The mathematical formula for computing value of 𝑅2is given by
𝑅2 = 1 - 𝑆𝑆
𝑒𝑟𝑟/𝑆𝑆𝑡𝑜𝑡 (8) Where,
𝑆𝑆𝑡𝑜𝑡 = (𝑦𝑖− 𝑦)2
𝑆𝑆𝑟𝑒𝑔 = (𝑓𝑖− 𝑦)2
𝑆𝑆𝑒𝑟𝑟 = (𝑦𝑖− 𝑓𝑖)2
And, 𝑆𝑆𝑡𝑜𝑡 = 𝑆𝑆𝑟𝑒𝑔+ 𝑆𝑆𝑒𝑟𝑟
Here, 𝑦𝑖=observed value, 𝑓𝑖 = calculated value, 𝑦 = mean of observed value
[image:3.595.54.287.76.229.2]The average efficiency of the model is determined by first carrying out the calculation of absolute error, relative error and percentage error and thus obtaining the value of efficiency.
Table 2.Analysis of calixto model
Here, given in the table2, shows the variation in the results of calixto model by different variation in the value of n(weighting factor). The calixto model suggest the value of n to be equals to 9.5, we variate this value till 14 in order to obtain the best possible results for the coefficient of determination and average value of efficiency. As shown in the table above the value of the factors been considered increases as the value of n varies while it start decreasing while considering the value to be 14 and further.
Table3. Analysis of road traffic model
Sno. n(weigh
ting factor)
𝑹𝟐(coefficient of
determination)
Efficiency
1. 2. 3. 4. 5. 6.
9.5 10 11 12 13 14
- 2.80560 - 1.85570 -.43042 .44270 .84290 .83843
97.299 97.644 98.375 99.051 99.571 99.549
S no. R2 (coefficient of
determination)
Efficiency
Volume of vehicles Percentage of heavy vehicles
(CALIXTO Model) (FUNCTION)
Generated Noise
Here, table 3 represents the value of the coefficient of determination and average efficiency for the Road Traffic Model (RTM). Based on the analysis of the two models we obtain the Table4 which shows the comparison in the values been obtained from Table 2 and Table 3. Here we have made a comparison in between the best value of the Coefficient of determination and average efficiency of the Calixto model which is obtained when n is 13 and the value obtained from the RTM.
Table 4. Comparison between the Calixto model and rtm (road traffic model)
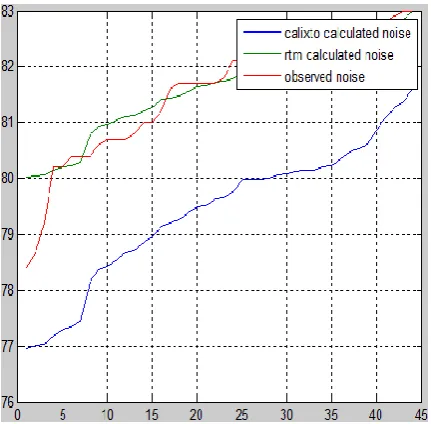
In accordance with the results shown in table and the studies been conducted of the two models we plot a graph for the situation which represents the variation in the value of the noise been obtained for the different hours of traffic flow. The three different curves represents the noise levels calculated from the Calixto model, Road traffic model and the observed levels of noise been obtained from the data set itself. Thus, on the basis of the above studies been done and the data shown from Table 4 and curves obtained from the Figure3.
Figure3. Observed and calculated value of noise for calixto and Road Traffic Model.
It is clear that the RTM (Road Traffic Model) gives sufficiently good results in comparison to the Calixto model according to the dataset used in this paper and considering the Indian road conditions.
4.
CONCLUSION
This paper is an attempt for enhancing the road traffic model so that it could be used up in order to give much accurate results then the other conventional methods which are used until now. It is found that Calixto model mainly relies over the road traffic data in order to generate the levels of noise. But besides this road dimension factors also play a key role in the generation of noise levels. The RTM been discussed takes into account both the road traffic data along with the road dimensions aspects thus, is able to provide much accurate results. Thus, on the basis of the result been discussed above we could easily prefer RTM over Calixto model for the generation of noise levels. Thus, we could use RTM in Indian scenarios for much better results of generation. These results are obtained while carrying comparison on the basis of the value of average efficiency and 𝑅2(Coefficient of Determination).
5.
FUTURE WORKS
The two models been discussed above pay high emphasis over the percentage of heavy vehicles and consider it to be major cause of the generation of noise. Thus, considering this aspect the volume of heavy vehicles should be reduced across the public areas and alternate path should be provided to route them. Besides this while analysing the noise levels along certain silence areas such as schools, hospitals the speed limita should be fixed to minimise the possibility of traffic jams occurring in that area. It could also help in setting up of official buildings along the areas of low traffic noise by prior analysis of the noise levels using the RTM (Road Traffic Model). The most important application of the generation of noise levels is that the generated noise levels can be put up as an input across certain prediction algorithms in order to obtain the values of noise which would get generated in the future. This could prove advantageous as the results of prediction could be used up in analysing the levels of noise in future with the data available at present and take necessary measures to curb it. It could be possible to obtain the levels of noise just by observing the present traffic conditions. This data could be used variety of organizations for generating the noise levels reports for solving variety of purposes.
6.
REFERENCES
[1] K. Kumar, V. K. Katiyar, M. Parida, and K. Rawat, ―Mathematical modelling of road traffic noise pollution‖, Int. J. of Appl. Math and Mech. pp: 21-28, 2011.
[2] R. K. Mishra, M. Parida, S. Rangnekar, ―Evaluation and analysis of traffic noise along bus rapid transit system corridor‖, Int. J. Environ. Sci. Tech., pp:737-750, Autumn 2010.
[3] R. Golmohammadi, M. Abbaspour, P. Nassir, H. Mahjub, ―RoadTrafficNoiseModel‖, J Res Health Sci, Vol 7, No 1, pp: 13-17, 2007.
S no.
Calixto model Road traffic model
R2 Efficiency R2 Efficiency
[4] M. Maruyama, Kazuhiro Kuno, Toshio Sone, ―New Mathematical Model to Estimate Road Traffic Noise in View of the Appearance Rate of Heavy Vehicles‖ , International Journal of Acoustics and Vibration, Vol. 16, No. 2, 2011
[5] I. A. Chandioa, K. M. Brohi, M. Ali Memon, ―Managing Road Traffic Noise Pollution, through Sustainable Planning Approach‖, International Journal of Chemical and Environmental Engineering, vol. 1 no. 2, 2010. [6] K. Rawat, V. K. Katiyar, Pratibha. “Mathematical
Modeling of Environmental Noise Impact‖, Indian Journal of Biomechanics: Special Issue, 2009.
[7] A. Calixto, Fabiano B. Diniz, Paulo H.T. Zannin, ―The statistical modelling of road traffic noise in an urban setting‖, Elsevier Science, Vol. 20, No. 1, pp: 23–29, 2003.
[8] Daniel, G.N, ―Cause and Effects of Noise Pollution. Interdisciplinary Minor in Global Sustainability‖, 1998. [9] Fyhri, A. and Klæboe.R., ―Road traffic noise, sensitivity,
annoyance and self-reported health —A structural equation model exercise‖ Environment International, v.35, pp: 91–97, 2009.