http://dx.doi.org/10.4236/jsea.2015.86029
Single-Phase Velocity Determination
Based in Video and Sub-Images Processing:
An Optical Flow Method Implemented
with Support of a Programmed
MatLab Structured Script
Andreas Nascimento
1, Edson Da Costa Bortoni
2, José Luiz Gonçalves
2,
Pedro Antunes Duarte
2, Mauro Hugo Mathias
11Departamento de Mecânica, Faculdade de Engenharia, Câmpus de Guaratinguetá (FEG),
Universidade Estadual Paulista (UNESP), Guaratinguetá, Brazil 2Universidade Federal de Itajubá (UNIFEI), Itajubá, Brazil
Email: [email protected]
Received 12 May 2015; accepted 7 June 2015; published 10 June 2015
Copyright © 2015 by authors and Scientific Research Publishing Inc.
This work is licensed under the Creative Commons Attribution-NonCommercial International License (CC BY-NC).
http://creativecommons.org/licenses/by-nc/4.0/
Abstract
workstation. Even showing good results, it could be stated that just the end point correlations were actually getting to the final solution. So that, making use of self-learning functions or neural network, one could surely enhance the capability of the application to be run in real-time without getting exhaust by iterative loops.
Keywords
Optical Flow, Single-Phase Velocity, Video and Image Processing, Sensing, MatLab Script
1. Introduction
The industry began to be interested in developing multi-phase-flow-meters, also just called as MPFMs, early in 1980s, since priory, single-phase measurements alone were sufficient to meet the industry’s needs. Since 1994, MPFM installation numbers have been steadily increased as technology in the field, with substantial growth witnessed from 1999 onwards [1]. Moreover, in any extension, a solution for detecting single-phase motions embedded in a multi-phase-flow environment may still have its importance and engineering impact.
Studies have shown that non-intrusive flow meters may be more adequate in activities where intrusive ones may affect the effectiveness of the process itself, or where further effort in terms of system re-engineering may show to be necessary, since situations can lead to metering damaging, more frequent maintenance necessity, etc. [2].
Furthermore, since the treatment of the information of this specific idea can be done and run on top of algo-rithm and media processing, it allows a more reliable real-time data sensing, keeping itself as a very good alter-native to be implemented in complex areas or environment where size and intrusiveness of the measuring me-thod may play a bigger role, being these the main motivation of the experiments carried out and detailed in the presented work.
For the developed experiment and simulation, a two-phase flow pattern (clean water and gas bubbles) was used as main fluid combination together with a high resolution recording camera pointing to a transparent tubing. So that non-intrusively, one could record a video from the stream, and subsequently, get the recorded media treated by the developed MatLab script, yielding with the gas bubbles flowing phase velocity determination.
2. Pixels Correlation Methodology
Considering that after images treatment one can have in a black-white representative matrix some Booleans spe-cifying what actually represents the effective image and what represents the background, it is possible to have a virtual representation of the gas bubbles in terms of mathematical matrixes.
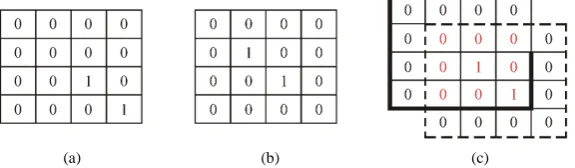
From theFigure 1 presented, it is possible to see in general what the ideas behind all are. Considering that
Figure 1(a)represents one broken-down image from the video media and theFigure 1(b) its subsequent
bro-ken-down image, one can understand that the number 01s (ones) represent the gas bubbles, and so, by trying to accommodate both on top of each other (each matrix position represents one pixel), it is possible to see that Figure 1(b)advanced in 01 (one) pixel position towards, being its displacement for the final match.
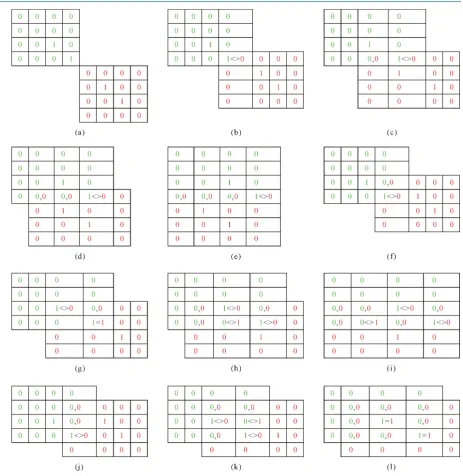
FromFigure 2, it is possible to see how the iterative process was developed in order to accommodate the im-ages and the processing basing in pixel correlations on top of each other. Starting from the lowest edge of the matrix, moving column by column from the right to the left and from the downside to the top side, one can see
[image:2.595.171.459.620.704.2](a) (b) (c)
Figure 2. Example of iterative process from beginning up to the processing end match.
the first match appears byFigure 2(g), and the maximum match with the total superposition at theFigure 2(l), which comes to represent the final correlative position for the displacement accountability for further velocity calculation and determination.
Since velocity is not more than a displacement over a specific time-range, putting this information together with the video recording rate in use, one can come-up with the actual effective gas bubbles single-phase stream velocity. Important to notice is that since the background represents the water, for example, it is estimating the total velocity and not the relative velocity on top of the water flow.
3. MatLab Media Processing Treatments
Sequentially, it was necessary to eliminate isolated pixels in order to allow distinguishing from gas bubbles background using the function “EDGE (image, ‘sobel’)”, and also perform a bordering quality enhancement in order to allow a better delimitation of the bubbles itself (Figure 3(c)).
Finally as a final step, it is always better and necessary to have some pictures boundaries cropped-out, having a better and smoother image to be feeding the script, accomplished using the function IMCROP.
4. Algorithm Script Schematics Summary Flow-Chart
FromFigure 4 shown, it can be seen how the logic behind the developed algorithm is. The source code itself
has been hidden due to specific purposes.
Throughout the analysis and comparison developed with the results, could be verified that this developed me-thodology and source code script can help as a non-intrusive method of measuring gas bubbles stream velocity in a two-phase or even multi-phase flow environment.
There were two main factors affecting the results that could for sure be enhanced in a next research: better de-finition of the bubbles sharpness and processing by eliminating the isolated pixels, and guaranteeing to have just perfect ellipses or circles left to be representative so that just raw bubbles would be compared for the pixel su-perposition matching, allowing a much better accuracy. Furthermore, one can interpret that the matches happens
[image:4.595.90.536.294.461.2](a) (b) (c)
Figure 3. Media processing from raw 3D format (a) [3] up to final enhanced quality before cropping (c).
[image:4.595.121.508.490.713.2]normally on the lasts superposition pixels, so that may not really be necessary to run the correlation code throughout the whole image matrix, but just after a certain specific matrix position. These could lead to source code optimization and results accuracy.
Nevertheless, it allowed an estimation of the stream velocity with an accuracy of around 97% for the tests run, what is considerable in terms of the necessary work-around implied over these studies and processing.
5. Conclusions and Discussion
Throughout the analysis and comparison developed with the results, it could be verified that this developed me-thodology and source code script can help as a non-intrusive method of measuring gas bubbles stream velocity in a two-phase or even multi-phase flow environment.
There were two main factors affecting the results that could for sure be enhanced in a next research: better de-finition of the bubbles sharpness and processing by eliminating the isolated pixels, and guaranteeing to have just perfect ellipses or circles left to be representative so that just raw bubbles would be compared for the pixel su-perposition matching, allowing a much better accuracy. Furthermore, one can interpret that the matches happen normally on the last superposition pixels, so that it may not really be necessary to run the correlation code throughout the whole image matrix, but just after a certain specific matrix position. These could lead to source code optimization and results accuracy.
Nevertheless, it allowed an estimation of the stream velocity with an accuracy of around 97% for the tests run, what was considerable in terms of the necessary work-around implied over these studies and processing.
Acknowledgements
This publication has the financial support from the Brazilian Federal Agency for Support and Evaluation of Graduate Education (Coordenação de Aperfeiçoamento de Pessoal de Nível Superior—CAPES, scholarship pro- cess no BEX 0506/15-0) and the Brazilian National Agency of Petroleum, Natural Gas and Biofuels (Agência Nacional do Petróleo, Gás Natural e Biocombustíveis—ANP), in cooperation with the Brazilian Financier of Studies and Projects (Financiadora de Estudos e Projetos—FINEP) and the Brazilian Ministry of Science, Tech- nology and Innovation (Ministério da Ciência, Tecnologia e Inovação—MCTI) through the ANP’s Human Re-sources Program of the State University of São Paulo (Universidade Estadual Paulista—UNESP) for the Oil and Gas Sector PRH-ANP/MCTI no 48 (PRH48). Thanks also to the Center of Excellence in Energy Efficiency (Centro de Excelência em Eficiência Energética—EXCEN) from the Federal University of Itajuba (Universi-dade Federal de Itajubá—UNIFEI).
References
[1] Mehdizadeh, P. (2006) Worldwide Multiphase and Wet Gas Metering Installations. Production Technology Report 03232007, 2007.
[2] Zuzunaga, A., et al. (2013) A Survey of Non-Invasive and Semi-Invasive Flow Meters for Mining Applications: Un-derstanding and Selecting the Right Technology for the Application. BI0497. International Meeting on Mining Plan Maintenance (MAPLA), Santiago.
![Figure 3. Media processing from raw 3D format (a) [3] up to final enhanced quality before cropping (c)](https://thumb-us.123doks.com/thumbv2/123dok_us/8117177.792960/4.595.121.508.490.713/figure-media-processing-format-final-enhanced-quality-cropping.webp)
