JAVA based Power Trading Simulator in Electricity
Market
Sumit Saroha
Asst. Prof. PIET, Panipat
India
Amit Rathee
Asst. Prof. PIET, Panipat
India
Rohit Verma
Dy. Director NPTI, Faridabad
India
ABSTRACT
The electricity market has been restructuring throughout the world for maximum utilisation of resources and the system is expended to maximise social welfare. Economic gains based on regional cooperation in the energy sector have become a firmly established practice across the world. In this paper we have proposed a JAVA based power trading simulator that will estimate market clearing price. A careful study of the existing models is to be carried out to evolve a model in JAVA, which is easy to adopt, sustain and to take care of existing participants. The demand is fixed and supply side bidding scenarios with case studies are presented in the paper. This simulator having 5 generators will bid for 24 hrs in single sided auction market.
Keywords
Single Side Bidding, Electricity Market, Market Clearing Price
1.
INTRODUCTION
With the introduction of restructuring into the electric power industry, the price of electricity has become the focus of all activities in the power market. In general, the price of a commodity is determined by supply and demand. The most basic pricing concept in the electricity market is market-clearing price (MCP). Generally, when there is no transmission congestion, MCP is the only price for the entire system. The process of determining MCP is as follows. After receiving bids, ISO aggregates the supply bids into a supply curve (S) and aggregates the demand bids into a demand curve (D). The intersection of (S) and (D) is the MCP [1]. In this paper we are presented a MCP & Market Clearing Volume (MCV) simulator on the basis of JAVA.
Zuyi Li [1] presents a mathematical model to find out MCP and locational Marginal Price (LMP), S. N. Singh [2] introduce a mathematical model to find MCP in wind power trading, Hui Zhou [3] & Pathom [5] discuss concept of MCP in day ahed electricity market, J. Contreras [4], Dong-Joo [15] made a mathematical simulator for MCP. The market equilibrium, under strategic interactions among players, can be modeled in terms of Nash equilibrium (NE) in which each player choose a strategy that maximizes his/her payoff, given the strategies of the other players in the game[8]. Zhenglin Yang [10] presents a decision-making Nash Equilibrium analysis method by using Genetic Algorithms. Somgiat [13]
uses a LaGrangian relaxation (LR) is used as an auction method for bidding in a deregulated environment. Fushuan [11] and Cristian [14] also discuss the market equilibrium in electricity market. Andrija [17] made a Two-Stage Stochastic Programming Model for Market Clearing with Contingencies but none of the researcher has been worked on JAVA platform.
This paper presents a successful JAVA base MCP simulator which can be used in Power Exchange to find out MCP and MCV without any problem. Users get familiar with all the steps that a power producer must perform to generate successful bids in an electricity pool. Suppliers and consumers bid in a pool: their interactions and communications are simulated on the JAVA platform. The market clearing algorithm is implemented in JAVA. Section II discusses the concept of MCP and power exchange proposed algorithm of the simulator. Section III discusses the existence methodology and Pseudo codes of simulator. Section IV discusses the simulation and numerical results for calculation of MCP and quantity of power allotted to each customer. Finally Section V concludes the paper.
2.
JAVA BASED ELECTRICITY
MARKET SIMULATOR
In this structure, the PX operates the energy market [5], the considered electricity market is a trading pool made up of groups of generators, demand(s), and a market operator that carries out the matching of bids [7]. In the electricity energy market, suppliers submit monotonically incremental cost curves that describe the energy offered as a function of price. The PX aggregates the curves into aggregated supply curve for each hour. In a single-sided auction, the power exchange (PX) determines the point at which the hourly supply curve intersects the load demanded. This point sets the market clearing price (MCP) or energy clearing price (ECP) for that hour. The objective of the PX auction is to search for prices at which participants are willing to transact. In this paper only single-sided auctions, are considered [1], [2], [5], [7] & [12].
interfaces. The concept of software interfaces, typical to OOP, also allows an easy extension to existing software packages for specific computations [9] such that to find out the MCP at a fixed demand, quantity of power supplied by each bidder after MCP process and total cost of each bidder.
2.1 Concept of MCP
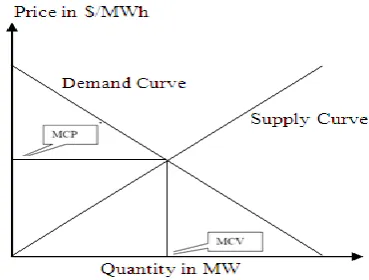
[image:2.595.67.252.386.526.2]The MCP (Market Clearing Price) is the lowest price obtained at the point of intersection of aggregated supply and demand curves and volume of power at the point of intersection is called MCV (Market Clearing Volume). At this price both suppliers of generation and customers are satisfied and would provide enough electricity from accepted sales bids to satisfy all the accepted purchase bids. At MCP, total sales bids in their merit order would be equal to the total purchase bids down to that price in their merit order. That price would be the MCP. Two types of markets exist based on the bidding mechanism. If bidding is done only by the suppliers, it is termed as a single-sided bidding, whereas, if both suppliers and customers are allowed to bid into the market, it is known as a double-sided bidding mechanism. But in this paper we are just consider the single side bidding with fixed load demand. The bidders can be allowed to bid their outputs or demands in the linear form [1], [2], [5], [7] and [12] as shown in Fig.1
Fig: 1 Linear Demand and Supply curve
2.2 Single Side Bidding
In single sided bidding scheme, only the generators or suppliers are allowed to bid in power exchange (PX). Suppose Ns is the no. of supply bidders. For any bidder or supplier ith the incremental cost curve is given by the equation Cit =ait +bit, PGit is submitted to for each hour to Power Exchange [5], [2]. Here PGit is the total power generated by the ith generator and ait & bit are the non negative bidding parameters.
The power exchange determines the MCP and total awarded to each generator based on the following equations:
bit is the slope of incremental cost curve of ith generator. PDt is the power demand of the each hour for the hour t. The quantity of power awarded to each generator is
qit is the quantity of power awarded to each generator. Then the revenue cost of the ith generator for time period tth is calculated by the following equation:
TRit = qit * MCPt --- (3) The total revenude cost of Ns no. of generators is given by:
qi min <= q <= qi max, i = i,--- Ns
When the quantity is exceed from the qi min & qi max then the subsequent bidder or generator is removed from the bidding or market.
2.3 Power Exchange Proposed Algorithm
Fig. 2 shows the flow of activity into the power exchange and these are the steps of algorithms:
Step 1: Initialize the bidding parameters.
Step 2: Each bidder will submit electronically the bid price and quantity to the power exchange.
Step 3: PX check the bidding validation and elimination. Step 4: JAVA simulator into PX calculate the MCP. Step 5: Bid is accepted or rejected depend on qmax & qmin. Step 6: PX will calculate quantity and revenue of power allotted to each generator.
[image:2.595.327.534.414.749.2]Step 7: PX submit the day ahead schedule to ISO for the implementation.
3.
METHODOLOGY & JAVA PSEUDO
CODES
Java Platform is a software platform for running software codes on a computer system, with the special feature of being hardware independent from the point of view of the software to be run: as far as software code is compiled to the Java Platform, it will run on every computer the Platform is present. It is ideal for Internet applications [9]. However, the Pseudo Codes is given as:
3.1
Pseudo codes for the Simulator
On the bases of all above mentioned four equations we are developing the Pseudo Codes for the simulator. Fig. 3 shows the pseudo codes of the simulator.
MCP.java
{ public MCP(int num) { totpart=num;
setTitle("Calculator Frame"); setSize(400,600);
setLocation(100,80);
resultButton.addActionListener(new ActionListener() { public void actionPerformed(ActionEvent ae) { for(int j=0;j<totpart;j++)
{ double
value=Double.parseDouble(valueText[j].getText()); values[j]=value;
temp=1/value; msisum+=temp;} result=dvalue/msisum; });
Quantity.java import javax.swing.*;
public class Quantity extends JFrame { for(int i=0;i<totpart;i++)
{ String str="Quantity for Customer"+(i+1)+" (in MW) ";
double temp=result/values[i]; valText[i].setText(val);
} } Price.java {
for(int i=0;i<totpart;i++) {
String str="Total Revenue for Customer"+(i+1)+" (in $) ";
double temp=result*(result/values[i]); valText[i].setText(val);
} }
Fig: 3 Pseudo Codes for the Simulator adopted in JAVA
3.2
JAVA Simulator
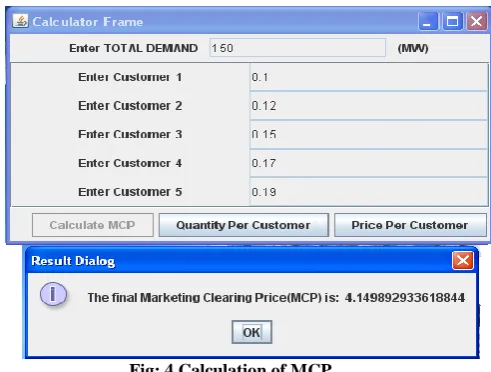
[image:3.595.313.559.69.255.2]JAVA based power trading simulator is simulating software developed for the explicit auction, calculation of MCP, quantity of power allotted to each customer and Total Revenue of each customer for the electricity market.
Fig: 4 Calculation of MCP
[image:3.595.318.543.413.561.2]Therefore, it is very easy to upgrade the application, and to change currently applied rules for the marginal price calculation as well. The access to data is available from any location, 24 h/day by using web browsers. Fig. 4 shows the snapshot of the software in which we are just consider only a single time slot of whole day. There are five supply bidders enter their incremental cost curve data and a fixed demand. The quantity allotted is calculated clicking on the „Quantity Per Customer‟ button on the software as shown in Fig. 4. The Fig. 5 shows the quantity of power allotted to each customer after the calculation of MCP.
Fig: 5 Quantity of Power allotted
Total revenue of each customer is calculated by clicking on the button of „Price per Customer‟ as shown in Fig. 4 and the Fig. 6 shows the Total Revenue of each customer that is calculated by the simulator.
4.
SIMULATION & RESULT
In the simulations, there are 5 generating bidders in single sided power auction with a fixed demand. Each bidder will electronically submit their incremental cost curve bit , iis the ith generator for the time period t and the supply quantity q
it . Each bidder have to specified their maximum and minimum quantity of power if their quantity does not lies in a specified
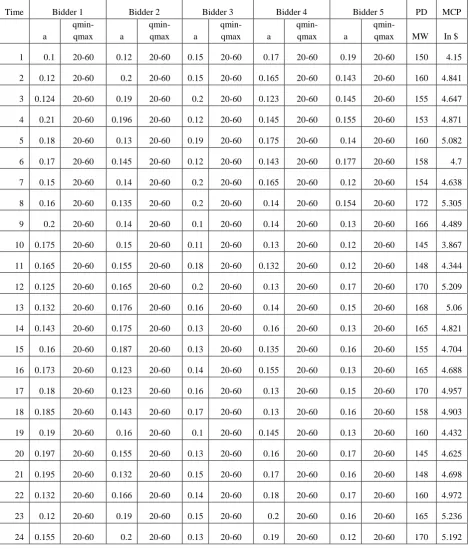
[image:4.595.68.539.197.747.2]range then the particular bidder is rejected from the bidding. In the Table 1 the input data both quantity and incremental cost curve is given and the data is feed into the JAVA simulator it will automatically find out the MCP according to the demand and the data is for the 24 hour.
Table 1. Data and calculated MCP
Time Bidder 1 Bidder 2 Bidder 3 Bidder 4 Bidder 5 PD MCP
a
qmin-qmax a
qmin-qmax a
qmin-qmax a
qmin-qmax a
qmin-qmax MW In $
1 0.1 20-60 0.12 20-60 0.15 20-60 0.17 20-60 0.19 20-60 150 4.15
2 0.12 20-60 0.2 20-60 0.15 20-60 0.165 20-60 0.143 20-60 160 4.841
3 0.124 20-60 0.19 20-60 0.2 20-60 0.123 20-60 0.145 20-60 155 4.647
4 0.21 20-60 0.196 20-60 0.12 20-60 0.145 20-60 0.155 20-60 153 4.871
5 0.18 20-60 0.13 20-60 0.19 20-60 0.175 20-60 0.14 20-60 160 5.082
6 0.17 20-60 0.145 20-60 0.12 20-60 0.143 20-60 0.177 20-60 158 4.7
7 0.15 20-60 0.14 20-60 0.2 20-60 0.165 20-60 0.12 20-60 154 4.638
8 0.16 20-60 0.135 20-60 0.2 20-60 0.14 20-60 0.154 20-60 172 5.305
9 0.2 20-60 0.14 20-60 0.1 20-60 0.14 20-60 0.13 20-60 166 4.489
10 0.175 20-60 0.15 20-60 0.11 20-60 0.13 20-60 0.12 20-60 145 3.867
11 0.165 20-60 0.155 20-60 0.18 20-60 0.132 20-60 0.12 20-60 148 4.344
12 0.125 20-60 0.165 20-60 0.2 20-60 0.13 20-60 0.17 20-60 170 5.209
13 0.132 20-60 0.176 20-60 0.16 20-60 0.14 20-60 0.15 20-60 168 5.06
14 0.143 20-60 0.175 20-60 0.13 20-60 0.16 20-60 0.13 20-60 165 4.821
15 0.16 20-60 0.187 20-60 0.13 20-60 0.135 20-60 0.16 20-60 155 4.704
16 0.173 20-60 0.123 20-60 0.14 20-60 0.155 20-60 0.13 20-60 165 4.688
17 0.18 20-60 0.123 20-60 0.16 20-60 0.13 20-60 0.15 20-60 170 4.957
18 0.185 20-60 0.143 20-60 0.17 20-60 0.13 20-60 0.16 20-60 158 4.903
19 0.19 20-60 0.16 20-60 0.1 20-60 0.145 20-60 0.13 20-60 160 4.432
20 0.197 20-60 0.155 20-60 0.13 20-60 0.16 20-60 0.17 20-60 145 4.625
21 0.195 20-60 0.132 20-60 0.15 20-60 0.17 20-60 0.16 20-60 148 4.698
22 0.132 20-60 0.166 20-60 0.14 20-60 0.18 20-60 0.17 20-60 160 4.972
23 0.12 20-60 0.19 20-60 0.15 20-60 0.2 20-60 0.16 20-60 165 5.236
The Fig. 7 shows the total revenue of the all bidders for the 24 hours according to MCP and electricity demand.
Fig: 7 Shows the Total Revenue of all Bidders
[image:5.595.63.297.110.261.2]The Fig. 8 shows the MCP for the 24 hours according to electricity demand.
Fig:8 Shows the MCP of all Bidders for 24 hrs.
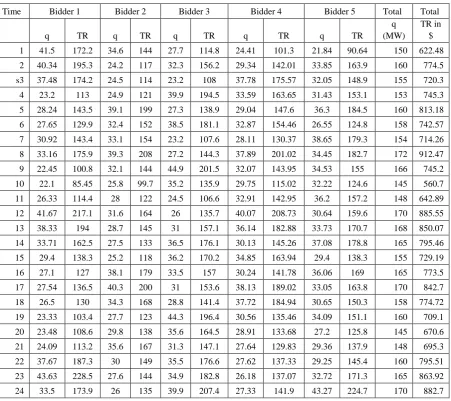
Table 2 shows the quantity of power allotted and total revenue of each bidder according to MCP calculated by JAVA based power trading simulator.
Table 2. Quantity Allotted and Total Revenue to Each Bidder
Time Bidder 1 Bidder 2 Bidder 3 Bidder 4 Bidder 5 Total Total
q TR q TR q TR q TR q TR
q (MW)
TR in $
1 41.5 172.2 34.6 144 27.7 114.8 24.41 101.3 21.84 90.64 150 622.48
2 40.34 195.3 24.2 117 32.3 156.2 29.34 142.01 33.85 163.9 160 774.5
s3 37.48 174.2 24.5 114 23.2 108 37.78 175.57 32.05 148.9 155 720.3
4 23.2 113 24.9 121 39.9 194.5 33.59 163.65 31.43 153.1 153 745.3
5 28.24 143.5 39.1 199 27.3 138.9 29.04 147.6 36.3 184.5 160 813.18
6 27.65 129.9 32.4 152 38.5 181.1 32.87 154.46 26.55 124.8 158 742.57
7 30.92 143.4 33.1 154 23.2 107.6 28.11 130.37 38.65 179.3 154 714.26
8 33.16 175.9 39.3 208 27.2 144.3 37.89 201.02 34.45 182.7 172 912.47
9 22.45 100.8 32.1 144 44.9 201.5 32.07 143.95 34.53 155 166 745.2
10 22.1 85.45 25.8 99.7 35.2 135.9 29.75 115.02 32.22 124.6 145 560.7
11 26.33 114.4 28 122 24.5 106.6 32.91 142.95 36.2 157.2 148 642.89
12 41.67 217.1 31.6 164 26 135.7 40.07 208.73 30.64 159.6 170 885.55
13 38.33 194 28.7 145 31 157.1 36.14 182.88 33.73 170.7 168 850.07
14 33.71 162.5 27.5 133 36.5 176.1 30.13 145.26 37.08 178.8 165 795.46
15 29.4 138.3 25.2 118 36.2 170.2 34.85 163.94 29.4 138.3 155 729.19
16 27.1 127 38.1 179 33.5 157 30.24 141.78 36.06 169 165 773.5
17 27.54 136.5 40.3 200 31 153.6 38.13 189.02 33.05 163.8 170 842.7
18 26.5 130 34.3 168 28.8 141.4 37.72 184.94 30.65 150.3 158 774.72
19 23.33 103.4 27.7 123 44.3 196.4 30.56 135.46 34.09 151.1 160 709.1
20 23.48 108.6 29.8 138 35.6 164.5 28.91 133.68 27.2 125.8 145 670.6
21 24.09 113.2 35.6 167 31.3 147.1 27.64 129.83 29.36 137.9 148 695.3
22 37.67 187.3 30 149 35.5 176.6 27.62 137.33 29.25 145.4 160 795.51
23 43.63 228.5 27.6 144 34.9 182.8 26.18 137.07 32.72 171.3 165 863.92
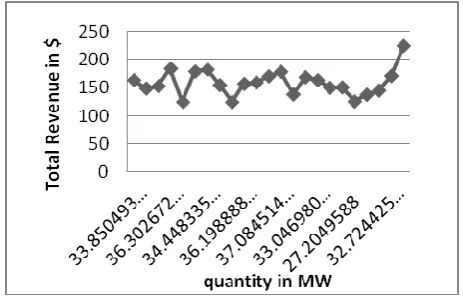
[image:5.595.57.509.336.737.2]Fig. 9 shows the curve drawn between the total revenue of a single generator Bidder 5 the curve is drawn between the quantity allotted and the total revenue of a generator according to the MCP calculated by simulator.
Fig: 9 Between TR of single bidder and Quantity Allotted
5.
CONCLUSION
In this paper, we discussed the JAVA based power trading simulator to find out the market clearing price. This simulator having 5 generators will bid for 24 hrs in single sided auction market. Power Exchange as a market operator will operate the 24 hrs Day Ahead auction market. Power Exchange will provide equal and same-time information to all the market participants through on-line bulletin board. A naive user can work on this simulator easily and modify the rules of electricity market according to requirement of participants and market. On the basis of demand and bid price the MCP is calculated and power is awarded to each generator to full fill the load requirement.
6.
ACKNOWLEDGMENTS
The authors wish to thanks those who helped or simply paid attention to the paper: Er. Preeti Rana and Er. Pradeep Singla.
7.
REFERENCES
[1] Zuyi Li, Hossein Daneshi, “Some Observations on Market Clearing Priceand Locational Marginal Price” IEEE 2005.
[2] S. N. Singh and I. Erlich, “Strategies for Wind Power Trading in Competitive Electricity Markets” IEEE Transactions on Energy Conversion, Vol. 23, No. 1, pp. 249-256, March 2008.
[3] Hui Zhou, Xinhua Wu, Wei Wang, Liping Chen, “Forecast of Next Day Clearing Price in Deregulated Electricity Market”, Proceedings of the 2009 IEEE International Conference on Systems, Man, and Cybernetics San Antonio, TX, USA - October 2009.
[4] J. Contreras, A. J. Conejo, S. de la Torre, and M. G. Muñoz, “Power Engineering Lab: Electricity Market Simulator”, IEEE Transactions on Power Systems, Vol. 17, No. 2, May 2002.
[5] Pathom Attaviriyanupap, Hiroyuki Kita, Eiichi Tanaka, Jun Hasegawa, “New bidding strategy formulation for day-ahead energy and reserve markets based on evolutionary programming”, International Journal of
Electrical Power and Energy Systems Vol. 27 pp. 157– 167, 2005.
[6] D. Moitre, F. Magnago, J. Martinez, M. Galetto, “Application of an experimental design methodology for economic parameter analysis in an open market environment”, International Journal of Electric Power Systems Research Vol. 73 pp. 61–66, 2005.
[7] J. Contreras, Member, A. J. Conejo, S. de la Torre, and M. G. Muñoz, “Power Engineering Lab: Electricity Market Simulator”, IEEE Transactions On Power Systems, Vol. 17, NO. 2,pp.223-28 May 2002.
[8] E. Bompard, Y.C. Ma, R. Napoli, C.W. Jiang, “Assessing the market power due to the network constraints in competitive electricity markets”, International Journal of Electric Power Systems Research Vol. 76 pp. 953–961, 2006.
[9] J. Contreras, A. Losi, M. Russo, “A JAVA/MATLAB Simulator for Power Exchange Markets”, pp 106-111 IEEE 2001.
[10] Zhenglin Yang, and Guoqing Tang, “Application of Genetic on Analysis of Market Equilibrium Strategy with Game Theory”, Nanjing China DRPT pp. 238-241 April 2008.
[11] Fushuan Wen, A.K. David, “Optimal bidding strategies for competitive generators and large consumers”, International Journal of Electrical Power and Energy Systems Vol. 23 pp. 37–43, 2001.
[12] Arup Sinha, A.K.Basu, R.N.Lahiri, MIEEE, S.Chowdhury, S.P.Chowdhury, Peter A. Crossley, “Setting of Market Clearing Price (MCP) in Microgrid Power Scenario”, pp. 1-8 IEEE 2008.
[13] Somgiat Dekrajangpetch, Gerald B. Sheble, “Bidding information to generate bidding strategies for LaGrangian relaxation-based auctions”, International Journal of Electric Power Systems Research Vol. 52 pp. 87–96, 1999.
[14] Cristian A. Díaz, José Villar, Fco. Alberto Campos, Javier Reneses, “Electricity market equilibrium based on conjectural variations”, International Journal of Electric Power Systems Research Vol. 80 pp. 1572–1579, 2010.
[15] Dong-Joo Kang, Balho H. Kim, Don Hur, “Supplier bidding strategy based on non-cooperative game theory concepts in single auction power pools”, International Journal of Electric Power Systems Research Vol. 77 pp. 630–636, 2007.
[16] S. Porkar, A. Abbaspour-Tehrani-fard, P. Poure, S. Saadate, “Distribution system planning considering integration of distributed generation and load curtailment options in a competitive electricity market”, Springer Electrical Engineering Vol. 93, pp. 23–32,2011.