Fuzzy Time Series based Method for Wheat production
Forecasting
Sachin Kumar
Prof. AKG Engineering College, Ghaziabad
,
India -201009Narendra Kumar
(Research Scholor, Mewar University) Asst. Prof. AKG Engineering College, Ghaziabad,
India -201009
ABSTRACT
Present study provides some modified techniques for time series based forecasting for the yield of any crop year. Our study can help in inventory management of wheat yield and for management of storage space. We are using the data of previous years and proposing a new method by using the fuzzy time series forecasting technique
.
General Terms
Fuzzy system and Agriculture.
Keywords
Fuzzy time series, Crop yield forecasting, Higher order time series, time series, Crisp value.1.
INTRODUCTION
India is land of agriculture and there is a great uncertainty about the outcome for any crop year. There are a number of functions which totally depends upon the outcome of crop. We can review the dependencies as follows:
Food Corporation of India (The food bank of nation) procures wheat and rice every year for PDS (public distribution system), under which government distributes wheat at control rate shops. They always face a problem of storage. If they have an idea about the yield of any particular year then they can manage storage capacity according to yield. Government can avoid the misuse of storage by using appropriate storage management technique. Every year a lot of grain is lost due to no storage if right storage management technique is applied then government can also avoid the loss of grain.
The second and most important thing is inventory of food grain. If we have a rough idea of crop yield for next year then we can purchase the wheat from other states in case of shortage and can also sale the excess in case of bumper yield. By this we can minimize the condition of on the spot rush for shortage or excess.
Third thing where forecasting plays key player is the planning of farmer. Farmer is the main player behind the scene. If farmer have an idea about the yield of his crop then according to that outcome he can plan for next crop. He can apply new techniques and precautions timely. Crop forecasting also helps farmers in budget management for the next crop.
Careful study of results can also help in division of land type. Planning department can declare land as fertile or non fertile on the basis of regular studies. By making these type of declarations government can emphasis on most fertile land for agriculture and can use less fertile land for other purposes.
Above is the brief idea about the need of crop forecasting. Above discussion proves the importance of impressive forecasting up to some extent. In this paper we are using the
values for the timeseries to input and after processing these values after de-fuzzyfication outcome is forecasted yield for next year[6].
2.
LITERATURE REVIEW
We have reviewed a number of research articles for our current work. We also have reviewed a number of good books on time series. The main problem in forecasting we have reviewed so far is the accuracy of forecasting. On the basis of accuracy we can rely on that result. There are a good number of papers telling about time series forecasting for the wheat production. Forecasting is also done on the basis of statistical methods like regression, co-relation, median etc, but the problem in center is again accuracy.
Fuzzy time series relies on real time fuzzy values as input hence there is a bit more accuracy in pattern and gives more accurate result.
By reviewing a literature we have concluded following terms to use in application:
2.1
Fuzzy Set
There are two types of variables, one is crisp variable and other is fuzzy variable [7]. Crisp variables have fixed value like normal mathematical variable but on contrary fuzzy variables don’t have fixed values. Fuzzy variables have membership value in different sets rather than having some fixed value.
We can understand the difference between fuzzy and crisp by following example:
If the speed of car is more than 80 then it is fast otherwise it is slow. Now a car running at a speed 81 is fast but a car running at 79.99 is slow in crisp variables. But on other hand fuzzy variables works on range, as car running from 40 to 60 is average speed and 50 to 70 is fast speed. Then we can calculate membership of any input in both sets and on that basis we can determine the result.
2.2
Time series
Very simple form of time series can be termed as a sequence of data taken at different time stamps[3][5]. Another definition can also be termed as “series of data with time stamping on is called something as time series.” Hence in time series we capture data at specific time to get a pattern and by using that pattern we forecast values after next time stamp of future.
fuzzified and then we calculate the result by defuzzyfication[1].
3.
PROPOSED METHODOLOGY
The proposed methodology has been discussed up to some extent in upper portion of paper. The main idea behind the concept is to use fuzzy values as input to time series instead of realtime crisp values. Hence total methodology can be divide into further steps:
1. The first task is to define universal set (universe of discourse) under which complete production history can be covered.
2. The second step is to make the partition of the discourse in to the range of equal length.
3. Define the fuzzy set by defining the membership functions in respective partitions.
4. Now fuzzification of time series data is done for further calculation comes under next step.
5. After fuzzification we realize the nearest series for each year and calculate a dummy production (DP) for each year.
6. Give the result as this dummy production will be the forecasted result for next year.
7. Take an average for two or three years of DP then give that as result for some more accuracy.
Above is the methodology for calculation of forecasted result. Now we will implement above procedure for our data.
4.
IMPLEMENTATION
For the implementation of our proposed methodology we have taken relevant data from a university farm. The data has production details of previous 21 years. This data has records of 1991-92 to 2011-12 of wheat production per unit land as shown in Table 1. Now we will use this data as input to our model. Now our procedure includes following steps:
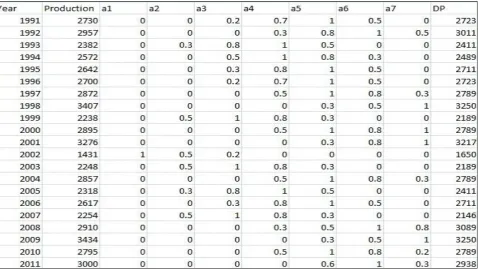
[image:2.595.350.508.330.664.2]Step 1: Our data has least value 1431 kg. and has maximum value as 3407 kg. , hence we will define a universe of discourse which contains both values inside it. Here we are defining a universe of discourse or universal set as [1400-3500].
Step 2: once we have a well defined universal set then we feed this to our fuzzy model for making different memberships. We have defined 7 membership functions (MF’s) here for making fuzzy calculations.
As soon as we feed this data to fuzzy model after giving range [1400-3500] with 7 MF’s it makes 7 different ranges or partitions.
a1= [1400-1700] a2= [1700-2000] a3= [2000-2300] a4= [2300-2600] a5= [2600-2900] a6= [2900-3200] a7= [3200-3500]
Step 3: Now we will define linguistic variables as follows.
a1= [1400-1700] poor production
a2= [1700-2000] below average production
a3= [2000-2300] average production
a4= [2300-2600] good production
a5= [2600-2900] very good production
a6= [2900-3200] excellent production
a7= [3200-3500] bumper production
The aliases which are given to above intervals are the professional agriculture terms. We are using these terms in our application to give it a more realistic look, and for making it easy to learn.
Step 4: in this step we will break the existing data intervals according to their respective memberships in different intervals.
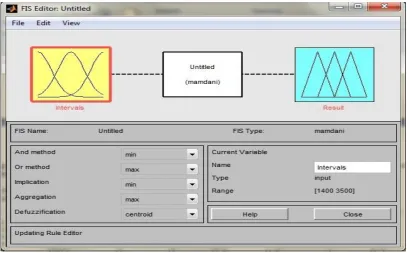
Figure 1. Outline of MATLAB implementation of Fuzzification
Figure 2. Showing the input values
We are using matlab R2011a for finding membership values of different inputs[2][5]. The matlab implementation can be catch by following images.
Figure 1 is showing the outline of matlab implementation of fuzzy. It contains intervals where we have input values and
Figure 2 is demonstrating the input values, we have input these values in 7 intervals namely {a1, a2, a3, ……a7} and have a range between [1400-3500].
Figure 3. Output values having range[0-1] Table 2. Membership values
production value of any year the relative membership in each mf can be calculated as for year 1991 the result values are {0, 0, .2, .7, 1, .5, 0}. Similarly we will find all the values which are shown in table 2[1].
The dummy production DP for year 1991 can be calculated as follows:
Fuzzy vector values for year 1991= {0,0,.2,.7,1,.5,0}. Here for finding the DP we will only consider higher values because they have larger membership in membership function.
For our current calculation we are using values equal to or more than 0.5.
Now for every partition will use the average for calculation as for a1 [1400-1700], value 1550 will be used for calculation and the same will be followed for other too.
In current scenario for year 1991, a4 has value .7, a5 has 1 and a6 has value as .5.
The formula for DP for any specific year can be termed as weighted mean of respective partitions which have membership value more than .5, hence
DP for 1991 =(.7*2450 + 1*2750 + .5*3050)/(.7+1+.5)
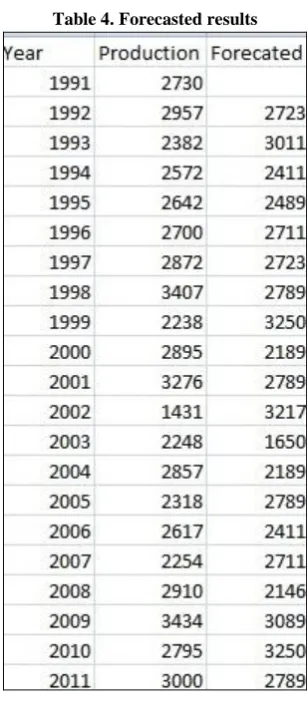
In similar fashion we have find all the DP values for each year which are shown in table 4.
Step 6: Result can be calculated by taking the dummy production as the forecasted result for next year. Figure 4 is the obvious result table which has forecasted values. Hence we can find the forecasted value for next year by identifying the pattern of this year’s production.
Step 7: step 7 is not necessary but it’s something which can be said enhancement to result. We can sum up the dummy production for previous 3-4 years and by averaging them the forecasted value will be generated.
[image:5.595.60.539.379.648.2]By taking average we can minimize the effect of sudden changes. This average method should only be implemented if there is sudden fall or sudden hike in production for some previous year’s production. For example year 2001 has sudden hike and 2002 has sudden fall so this average method can give some near forecasted values.
Table 4. Forecasted results
5.
RESULT & FUTURE SCOPE
The result shown in last step was remarkably near to actual production for every year. The time series is working almost perfectly if there is no such sudden hike or fall in production. The limitation can be minimized by using average method.But this functioning has a great future scope by using more than
one parameter. Here we are just using a parameter called production. If we can use a number of parameters as Rain Fall, Humidity, Average Growth of plant after different time intervals, Average Temperature during year and many more[8]. Then we can choose most efficient parameters and can make a vector for each year[7].
For example for any year X:
Xv= {p1,p2,p3,p4,p5,p6,p7}
By making clusters[4] for each year and by calculating relative distance among clusters we can find more efficient production details.
6.
REFERENCES
[1] A unified approach to c-Means clustering models. Laszlo Szilagyi, Sandor M. Szilagyi and Zoltan Benyo. [2009]. [2] Traffic Pattern Forecasting using time series analysis
between spatially adjacent clusters. Li Liu, Mohammad Khalilia, Huchun Tan, Peng Zhuang.[2009].
[3] Research on IT Resources Fuzzy c-Mean Clustering based on Resource based View. Yuntao YANG, Runxiao WANG, Junting LI, [2010].
[4] Fractal Based Digital Image Watermarking using Fuzzy c-Mean Clustering. Soheila Kiani, Mohsen Ebrahimi Moghaddam. [2009].
[5] Search for Additive Nonlinear Time Series Casual Models. Tianjiao Chu, Clark Glymour. [2008].
[6] Adaptive Time- Variant models for Fuzzy Time Series forecasting. Wai-Keung Wong, Enjian Bai and Alice Wai-Ching Chu. [2010].
[7] Applying Time Series Regression to load Forecasting Using Neuro Fuzzy Techniques. M.Ghanbarian, F.Kavehnia, M.R.Askari, A.Mohammadi, H.Keivani [2007].
![Figure 3. Output values having range[0-1]](https://thumb-us.123doks.com/thumbv2/123dok_us/8117811.793194/4.595.99.496.68.372/figure-output-values-having-range.webp)