© 2016, IRJET ISO 9001:2008 Certified Journal
Page 506
Robust Cell Detection Using Adaptive Fuzzy C- Means Clustering and
Classification
Akshara A.R
1, Divya Subhash
2PG Student, Department of Electronics, Applied Electronics and Instrumentation, Lourdes Matha College of Science and Technology, Kerala, India 1
Assistant Professor, Department of Electronics, Lourdes Matha College of Science and Technology, Kerala, India2
---***---Abstract -
Neuro endocrine tumor (NET) is one of themost common cancers leading to death worldwide. Many studies has emphasized the importance of Ki-67 as the proliferation marker in the neuro endocrine tumor. Automatic Ki-67 assessment is very challenging due to complex variations of cell characteristics. In this paper, we propose an integrated learning based framework using Fuzzy C means clustering (FCM) for accurate automatic Ki-67 counting for NET and to localize both tumor and non-tumor cells. Unlike the non-fuzzy clustering algorithms, FCM is less sensitive to noise and give better results for overlapped data sets. For feature selection t-test algorithm is used. The t-test has been used to rank features for microarray data. For multi-class problems, t – statistics value for each gene of each class is calculated by evaluating the difference between the mean of all the classes, where the difference is standardized by the within class standard deviation. The automatic Ki-67 counting is quite accurate compared with pathologists’ manual annotations. This is much more accurate than existing methods.
Key Words: Neuro endocrine tumor, cell detection,
classification, Ki-67, segmentation
1.INTRODUCTION
Neuro endocrine tumor (NET) is one of the most common cancers leading to death worldwide. Personalized diagnosis and treatment have significant influences on the survival of the NET patients. Recently, Ki-67 proliferation index, which is represented as the ratio between the numbers of immunopositive tumor cells and all tumor cells, is increasingly considered as a valid biomarker to evaluate tumor cell progression and predicting therapy responses [1]. Manual Ki-67 assessment is subject to a low throughput processing rate and pathologist-dependent bias. Computer-aided pathological image analysis is a promising approach to improve the objectivity and reproducibility. However, it is difficult to access automatic and accurate Ki-67 counting in
digitized NET images, since the complex nature of histopathological images, such as variations of image texture, color, size, and shape, presents significant challenges for accurate automatic Ki-67 counting. In addition, tumor and nontumor cells are usually clustered such that the nontumor cells are also counted using many traditional methods, which lead to large counting errors.
In Ki-67 staining for NET, the color of immunonegative to immunopositive tumor cells ranges from blue to brown in terms of the stage of Ki-67 proliferation. Many computerized methods rely on the color feature to detect and classify cells for Ki-67 scoring. Al-Lahham et al. [1] first applied K-means clustering to a transformed color space, and subsequently used mathematical morphology and connected component analysis to segment and count cells on Ki-67 stained histology images. However, it is difficult for these methods to differentiate tumor from non-tumor and to handle touching cells. Recently, Nielsen et al. [2] first used a MART1 verification strategy to select tumor areas, and calculated cell areas and irregularity to classify positive and negative tumor cells that are obtained by using intensity-based thresholding functions. In order to handle touching cells, Loukas et al. [3] detected all cells using a Laplacian-of-Gaussian (LoG) filter followed by a distance map transformation for cancer cell counting, and then applied principal component analysis to a transformed color space for immunopositive and immunonegative cells. Markiewicz
et al. [4], [5] employed the watershed algorithm to separate
© 2016, IRJET ISO 9001:2008 Certified Journal
Page 507
completely automatic. Besides the aforesaid methods, moregeneral and sophisticated cell detection algorithms can also be used to estimate Ki- 67 proliferation index. A K-nearest neighbor-based graph is proposed in [9] for Ki-67 hot spots detection on glioblastoma. Watershed and its variants are another popular group of cell detection and segmentation methods. For cells that usually exhibit circular or approximately circular shapes, radial voting has been widely used. Parvin et al. [10] proposed an iterative radial voting (IRV) algorithm based on oriented kernels to localize cell nuclei, in which the voting direction and areas are dynamically updated within each consecutive iteration. A computationally efficient single-pass voting (SPV) for cell detection is reported in [11], which applies mean shift clustering instead of iterative voting to final seed localization.
The aforementioned general cell detection and segmentation algorithms are not specifically designed to calculate Ki-67 proliferation index. The non-tumor cells such as lymphocytes, stromal, and/or epithelial cells thus often need to be excluded manually. Meanwhile, additional steps need to be designed to separate immunonegative and immuopositive tumor cells. In this paper, we propose an integrated learning-based algorithm (see Fig. 1) for automatic scoring of Ki-67 proliferation index of NET, with addressing the problems earlier simultaneously. In order to accurately and simultaneously localize a large number of cells, we propose a robust and efficient fuzzy C means algorithm to detect cell seeds (geometric centers). Then, an efficient online sparse dictionary learning algorithm is applied to select a set of representative training samples. Finally, tumor and non-tumor cells are separated by a trained SVM classifier with both the cellular features and regional structure information. The Ki-67 proliferation index is calculated based on the classification results of immunopositive (brown cells) and immunonegative (blue cells) tumor cells.
II.METHODS
Our novel integrated learning-based algorithm for automatic Ki-67 scoring of NET contains the following steps: 1) Robust cell detection and boundary delineation followed by cellular features extraction. 2) A learning-based region segmentation algorithm is used to generate a probability map to differentiate tumor and non-tumor regions. 3) Both the cellular features and regional structure information are combined to provide accurate tumor cell detection. 4) The
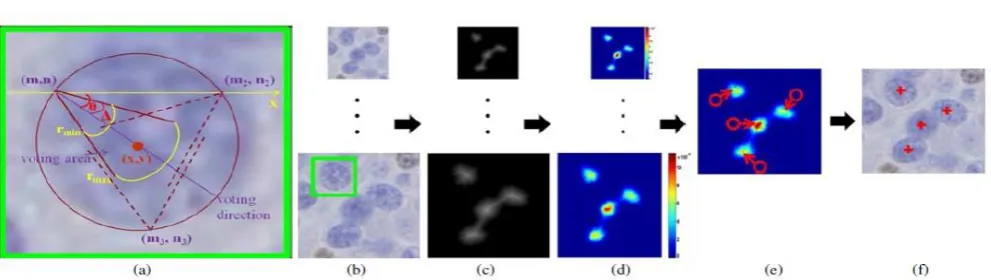
Ki-67 proliferation index is finally calculated using a classifier with color histograms to separate immunopositive (brown cells in Ki-67 staining) and immunonegative (blue cells in Ki 67 staining) tumor cells. The whole algorithm flowchart is shown in Fig. 1.
Fig.1. Workflow of the proposed automatic Ki-67 proliferation index scoring system
A. Automatic Cell Detection
Robust cell detection is achieved by finding the geometric centers (seeds) of the cells. SPV in [11] localizes the seeds by performing a gradient magnitude-weighted majority vote, but it is not able to efficiently handle cell size and shape variations, since its single voting area and mean shift clustering with a unit bandwidth are not appropriate for different types of cells in one image. For a specific pixel, SPV only sums its own votes without counting those votes from its neighbors, which are important in localizing cell seeds.
© 2016, IRJET ISO 9001:2008 Certified Journal
Page 508
on these observations, we introduce a region-basedhierarchical voting in a distance transform map, which applies a Gaussian pyramid to the voting procedure to handle scale variations.
Let T(x, y) denote the original image, and ∇T(x, y) be the gradient, for each pixel (x, y) at layer l the proposed cell detection algorithm defines its cone-shape voting areas Al with vertex at (x, y) and votes along the negative gradient direction:
where θ represents the angle of the gradient direction with respect to x-axis. A confidence map V (x, y) is calculated by weighting the distance transform map with a Gaussian kernel g(m, n, μx, μy, σ)
where S represents the set of all voting pixels, Al(m, n) denotes the cone-shape voting area with vertex (m, n) at layer l, and it is defined by the radial range (rmin, rmax) and angular range Δ, Fig. 2(a). I(x) = I[(x, y) ϵ Al(m, n)] is the indicator function, and Cl (x, y) represents the distance transformation map at layer l, which can be the Euclidean distance transform. The isotropic Gaussian kernel is parametrically defined with
and scalar σ, which is used to encourage the voting toward the cell central regions. Fig. 2(c) shows that pixels with higher Cl(x, y) values near the geometric center of a cell will enhance their contributions in (1). For each pixel (x, y), (1) provides a weighted sum of all the voting values created by its neighboring pixels whose voting areas contain (x, y) [Fig. 2(a)], instead of only counting those votes created by its own. After the confidence map is generated [Fig. 2(e)], fuzzy C means clustering is employed to calculate the final seed for each individual cell and segmentation, Fig. 2(f).
B. Fuzzy C means clustering
Fuzzy c-means (FCM) is a method of clustering which
allows one piece of data to belong to two or more clusters.Thismethod is frequently used in pattern recognition. It is based on minimization of the following objective function
, (2)
where m is any real number greater than 1, uij is the degree of membership of xi in the cluster j, xi is the ith of d-dimensional measured data, cj is the d-dimension center of the cluster, and ||*|| is any norm expressing the similarity between any measured data and the center. Fuzzy partitioning is carried out through an iterative optimization of the objective function shown above, with the update of membership uij and the cluster centers cj by:
,
This iteration will stop when ,
where ε is a termination criterion between 0 and 1, whereas k is the iteration steps. This procedure converges to a local minimum or a saddle point of Jm. The algorithm is composed of the following step:
1. Initialize U=[uij] matrix, U(0)
2. At k-step: calculate the centers vectors C(k)=[cj] with U(k)
(3)
3. Update U(k), U(k+1)
(4)
© 2016, IRJET ISO 9001:2008 Certified Journal
Page 509
Fig. 2. Procedure of hierarchical voting-based seed detection. (a) Illustration of voting area and direction, (b) original image, (c) distancemap, (d) confidence map, (e) mean-shift clustering (the circle represents one point and the arrow denotes the mean-shift vector) on the final confidence map, (f) final seeds.
Compared to mean shift clustering, fuzzy C means gives best result for overlapped data set and comparatively better than mean shift algorithm and unlike mean shift where data point must exclusively belong to one cluster center here data point is assigned membership to each cluster center as a result of which data point may belong to more than one cluster center.
C. Training Sample Selection and Online Dictionary
Learning
Based on the results of cellular segmentation, a classifier can be trained to determine the segmented cell category (tumor or non-tumor cells) with the following cellular features in (listed in Table I Stage I): geometric descriptors, color intensity, and cell shapes that are represented by Fourier shape descriptor [12]. In total, we have extracted p = 5 + 9 × 3 + 80 = 112 features, where 3 represents R,G, and B
color channels, and 80 denotes the first 20 harmonics (each corresponds to four coefficients) that are chosen in the Elliptical Fourier transformation.
For more efficient and robust training, we propose to choose a set of representative samples that can approximate the entire training set. This is a data summary problem that can help to reduce the number of training samples, improve the computational efficiency, and more important, to increase the robustness by removing outliers from the original training set.
A K-selection dictionary learning algorithm is chosen to select
K representatives {φk∈ RWx1} to form a dictionary Φ ∈ RWxK from the original dataset
© 2016, IRJET ISO 9001:2008 Certified Journal
Page 510
The training data often do not come in one batch. Instead,they are often collected from different pathologists in different institutes in a sequential mode. It is not only time consuming but also impractical to retrain the dictionary whenever new training samples arrive. To deal with training in a sequential mode, the dictionary Φ is required to be online updated for classification. Recreation of the dictionary using the whole dataset including the old { fi }, i = 1, 2, . . .,N and new { finew}, i = 1, 2, . . .,M data are neither efficient nor feasible. Because the selected K representatives can efficiently describe the old dataset, it is sufficient to evaluate whether or not Φ are good representatives for { finew}. Thus, we can solve the optimization problem on a reduced dataset
where { finew}, i = 1, 2, . . .,M are the new data, and{ finew}, i = M + 1,M + 2, . . . , M + K are the previously selected representatives Φ.K’ denotes the number of the representativesneed to be selected for the new dataset that
contains bothold and new training samples. The data size in (6) is M + Kwhich is much smaller than M + N (N represents the size of the original training dataset), and hence the optimization problem in(6) can be solved more efficiently. The online learning strategyenables the dictionary to be properly scaled up to represent a dynamic set of samples while still keeping the efficiency.
D. Three-Stage Learning Based Classification
After an accurate segmentation and dictionary learning of all the cells in NET, a three-stage learning-based scheme combining cellular features and regional structure information is designed to differentiate tumor from non-tumor cells, and immunopositive from immunonegative tumor cells for accurate Ki-67 counting. The reasons why we use multiple stages to calculate Ki-67 proliferation index are: 1) Speed: first, it is much easier and faster to compute cellular features in Stage I than the texture in Stage II. Second, many typical non-tumor cells will achieve relatively low-category probabilities using the simple cellular feature-based classifier in Stage I and can then be removed to avoid further processing. The subsequent classifiers will only need to focus on difficult cases. This cascade pipeline structure can dramatically improve the speed. 2) Flexibility: the feature computation in Stages I and II are independent and either one can be replaced with other methods without
changing the whole framework. 3) Evaluability and clinical purpose: in this pipeline framework, all intermediate results can be easily exported and presented to doctors for evaluation and clinical purpose. 4) Scalability: we have specifically designed these three-stage pipeline structure instead of an integrated module like classification tree considering future parallel implementation using grid and/or cloud.
Stage I: As shown in Table I, 112 features are extracted for
each sample. In order to select the most discriminative features for cell classification, a sparse representation model is applied to the original feature space
where N = N+ + N- represents the number of training samples containing N+ tumor and N- non-tumor cells, and φi
∈
RWx1 is the extracted feature with W = 112 denoting the original dimension. b0 is the intercept and η represents the sparsity parameter. The binary vector a ∈R(N + +N −)×1 representsthe labels of cells used for training: ai = +1 for tumor andai= −1 for nontumor. Due to the l1 norm constraint, the solutionb*∈
RW ×1 to (7) is sparse with nonzero elements corresponding to the selected discriminative features. Based on b∗with Lnonzero elements, we can project all the features ontoa low-dimensional discriminative subspace. An SVM classifier is learned to predict the cell category in this transformed sparse feature space. We remove those cells with low probabilities that often correspond to typical non-tumor cells before the cell classification, such that the second classifier would focus on a reduced dataset.
Stage II: In Stage I, only cellular features are considered, and
some non-tumor cells (like lymphocytes) can be classified as tumor cells by mistake. The lymphocytes usually exhibit certain structural pattern on the specimens, which can be described with local structural features. To improve the classification accuracy, texton [13] feature is utilized to model the different structural level features between non-tumor and non-tumor regions. A multiple scale Schmid filter bank [14] is used for image filtering
© 2016, IRJET ISO 9001:2008 Certified Journal
Page 511
r = . A texton library is constructed using
K-means on 20 randomly selected NET specimens using the image filtering results with Schmid filter bank. Considering computational efficiency, an integral histogram [15] is utilized to calculate the multiscale windowed texton histogram. Using the texture classification-based probability map, each individual cell will obtain a score to evaluate its probability belonging to tumor or non-tumor cells (see Table I). In addition, the ratio between the probability of one cell and the probability average for all its neighboring cells provides a measurement of cell category distribution. As one can expect, the lymphocyte regions will exhibit higher probability to be classified as non-tumor patterns, which can be discarded before Stage II. In this way, the classifier in Stage II will focus more on the challenging cases. This improves both computational efficiency and classification accuracy.
In Stage II, the mean/standard deviations of pixel probabilities in each cell, and the percentage of probability summation of one cell over the probability average for all cells in its local region are calculated. These statistical features are concatenated with the previously predicted cellular probabilities in Stage I to train a second SVM classifier. The output will produce the labels to differentiate tumor from non-tumor cells.
Stage III: Based on the classification in Stage II, the final step is to separate immunopositive from immunonegative tumor cells. This is achieved by training a final classifier for all the Ki-67 positive staining cells using the features listed in Stage I in Table I, and cellular intensity histogram (a 16-bin intensity histogram separately for each channel, as shown in Stage III in Table I) to differentiate the immunopositive and immunonegative tumor cells.
III. EXPERIMENTAL RESULTS AND DISCUSSION
A. Cell Detection
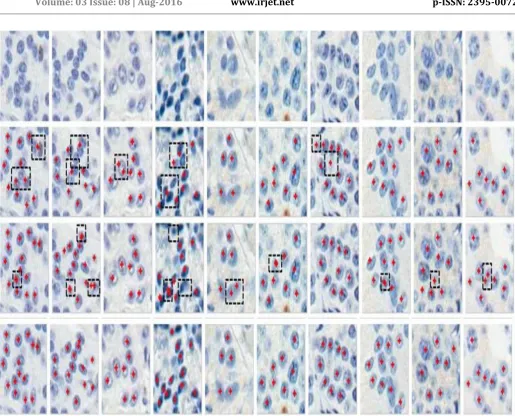
Both qualitative and quantitative analyses are conducted for the proposed cell detection algorithm. In Fig. 4, thousands of cells are correctly detected and segmented on several randomly selected image patches, which contains both tumor and non-tumor cells.
IRV and SPV may fail on elongated cells due to the assumption of approximate circular objects. In addition, it is not easy for IRV and SPV to create a general rule for
parameter selection on one single image containing cells with different sizes and shapes. The proposed method is compared with four recent state of the arts: IRV [10], SPV[11] and the results are shown in Fig.5. The proposed algorithm is more robust with respect to the variations of cell scale and intensity. This can be attributed to the region-based hierarchical voting on the distance map.
[image:6.595.305.555.210.560.2]© 2016, IRJET ISO 9001:2008 Certified Journal
Page 512
Fig. 5. Geometric centers of cells (seeds) detection on several randomly selected image patches. Row 1 is the original image patches. Rows 2, 3 and 4 correspond to the automatic detection results produced by IRV [10], SPV [11], and the proposed algorithm, respectively. The missing or false seeds are highlighted with black dashed rectangle.B. Ki-67 scoring
In the experiments at Stage I, circularity ratio, axis ratio, color mean, standard deviation, kurtosis, contrast, correlation, and homogeneity are selected by the sparse representation mode as the most discriminative features to separate tumor from non-tumor cells. This indicates that for Ki-67 staining, tumor cells intend to exhibit more circular shapes than non-tumor cells. Non-tumors cells often have
© 2016, IRJET ISO 9001:2008 Certified Journal
Page 513
C. Performance Analysis
The proposed system is compared with an existing
system [16] and a graph is plotted showing the accuracy of the proposed system, Fig. 6. Our method produces best performance in terms of mean values, gives smaller variance, which demonstrates the strong robustness of the proposed automatic Ki-67 counting algorithm. Proposed method can reliably separate touching cells, and many lymphocytes are not discriminated from the true immunopositive tumor cells in existing methods, while in proposed algorithm these lymphocytes are correctly recognized based on accurate cellular level segmentation and classification.
Fig.6. Performance Analysis
IV. SIMULATION RESULTS
Fig.8. GRAYSCALE IMAGE
Fig.9. SMOOTHENED IMAGE
Fig.10. CLUSTERING INDEX
© 2016, IRJET ISO 9001:2008 Certified Journal
Page 514
Fig.11. ENHANCED IMAGEFig.12. SEGMENTED IMAGE
Fig.13. CLASSIFIED IMAGE
Fig.13. IMMUNOPOSITIVE REGION
V. CONCLUSION
In this paper, we have introduced an automatic
algorithm for Ki-67 scoring of digitized NET images. The
novel cell detection algorithm can efficiently and
accurately detect thousands of cells on a digitized NET
image with Ki-67 staining. Furthermore, a three-stage
learning-based approach is designed to differentiate tumor
cells from non-tumor cells and immunopositive and
immunonegative tumor cells for an automatic, accurate,
and robust quantification of Ki-67 proliferation index.
REFERENCES
[1] H. Z. Al-Lahham, R. S. Alomari, H. Hiary, and V. Chaudhary, “Automating proliferation rate estimation from Ki-67 histology images,” SPIE, vol. 8315, 2012.
[2] P. S. Nielsen, R. Riber-Hansen, J. Raundahl, and T. Steiniche, “Automated quantification of mart1-verified Ki67 indices by digital image analysis in melanocytic lesions,”
Arch. Pathol. Lab. Med., vol. 136, no. 6, pp. 627– 634, 2012.
© 2016, IRJET ISO 9001:2008 Certified Journal
Page 515
[4] T. Markiewicz, C. Jochymski, R. Koktysz, and W.Kozlowski, “Automatic cell recognition in immune histochemical gastritis stains using sequential thresholding and svm network,” in IEEE Int. Symp. Biomed. Imag. (ISBI), 2008, pp. 971- 974.
[5] T. Mariewicz, P. Wisniewski, S. Osowski, J. Patera, W. Kozlowski, and R. Koktysz, “Comparative analysis of methods for accurate recognition of cells through nuclei
staining of Ki-67 in neuroblastoma and
estrogen/progesterone status staining in breast cancer,”
Anal. Quant. Cytol. Histol., vol. 31 , no. 1, pp, 49-62, 2009.
[6] B. Grala, T. Markiewicz, W. Kozlowski, S. Osowski, J. Slodkowska, and W. Papierz, “New automated image analysis method for the assessment of Ki-67 labeling index in meningiomas,” BMC Clin. Pathol., vol. 47, no. 4, pp. 587–592, 2009.
[7] J. Słodkowska, T. Markiewicz, B. Grala, W. Kozłowski, and W. Papierz, “Accuracy of a remote quantitative image analysis in the whole slide images,” Diagn. Pathol., vol. 6, no. Suppl. 1, 2011.
[8] S. Fasanella, E. Leonardi, C. Cantaloni, C. Eccher, I. Bazzanella, D. Aldovini, E. Bragantini, L. Morelli, L. V. Cuorvo, A. Ferro, F. Gasperetti, Berlanda, P. D. Palma, and M. Barbareschi, “Proliferative Activity in human breast cancer: Ki-67 automated evaluation and the influence of different Ki-67 equivalent antibodies,” Diagn. Pathol., vol. 6, no. S1, 2011.
[9] M. X. Lopez, O. Debeir, C. Maris, I. Roland, I. Salmon, and C. Decaestecker, “Ki-67 hot-spots detection on glioblastoma tissue sections,” in IEEE Int. Symp. Biomed. Imag. (ISBI), 2010, pp. 149–152.
[10] B. Parvin, Q. Yang, J. Han, H. Chang, B. Rydberg, and M. H.Barcellos Hoff, “Iterative voting for interference of structural saliency and characterization of subcellular events,” IEEE Trans. Image Process. (TIP),vol.16, pp. 615-623, 2007.
[11] X. Qi, F. Xing, D. J. Foran, and L. Yang, “Robust segmentation of overlapping cells in histopathology specimen using parallel seed detec tion and repulsive level set,” IEEE Trans. Biomed. Eng. (TBME), vol.59, no. 3, pp. 754-765, 2012.
[12] F. Kuhl and C. Giardina, “Elliptic fourier features of a closed contour,” Comp. Graph. Image Process, vol. 18, no. 3, pp. 236–258, 1982.
[13] B. Julesz, “Texton, the elements of texture preception, and their interaction,” Nature, vol. 290, no. 5802, pp. 91–97, 1981.
[14] C. Schmid, “Constructing models for content-based image retrieval,” in Proc. IEEE Conf. Comput. Vis. Pattern Recognit. (CVPR), 200, pp.39-45.
[15] F. M. Porikli, “Integral histogram: A fast way to extract histograms in cartesian spaces,” in Proc. IEEE Conf. Comput. Vis. Pattern Recognit. (CVPR), 2005, pp. 829–836.
[16] Fuyong Xing, Hai Su, Janna Neltner, and Lin Yang, “Automatic Ki-67 Counting Using Robust Cell Detection and Online Dictionary Learning,” IEEE Trans. Biome., Eng.(TBME), vol. 61, no. 3,859- 870, 2014.
BIOGRAPHIES
AKSHARA A.R has completed her Bachelor’s degree in engineering in Electronics and Communication from Baselios Mathews II College of Engineering, Kollam, Kerala, India (2014) and presently pursuing Master of Technology in the department of Applied Electronics and Instrumentation Engineering in Lourdes Matha College of Science and Technology, Kerala, India.
DIVYA SUBHASH has graduated in Electronics and