© 2016, IRJET | Impact Factor value: 4.45 | ISO 9001:2008 Certified Journal | Page 1279
FLOOD PLAIN MAPPING AND DAM BREAK ANALYSIS FOR NEERASAGAR
RESERVIOR
Sujaykumar S Hajeri
1, Dr.A.V.Shivapur
2, Dr.B.Venkatesh
31
PG Student, Department of Water and Land Management, Visvesvaraya Technological University, Belagavi
2Prof. and Head of the department, Department of Water and Land Management, VTU, Belagavi
3
Scientist F, National Institute of Hydrology, Belagavi
---***---Abstract -
In the present study, the flood plain zone, at the downstream end of NEERASAGAR Reservoir Near Dharwad, has been mapped, using DEM in ARC-GIS after selecting output location in SWAT which is at 15 Km from dam & River attributes were digitized in HEC GeoRAS, Digitized geometric file ie River attributes were transferred to HECRAS to obtain water surface elevations for different scenarios like steady flow, unsteady flow, DAM BREAK ANALYSIS for steady flow, unsteady flow, unsteady flow with reservoir, water surface elevations were checked with particular flow value for steady flow, & water surface elevations were also checked for unsteady flow using Probable maximum flood obtained from KUWSDB (Karnataka urban water supply & drainage board, Dharwad) Using water surface elevations obtained from HECRAS for different scenarios as above, inundation map was obtained in ARC-GIS using IDW method of interpolation. Later IDW map was displayed on Google earth for identifying area of flooding.Key Words: ARC-GIS, HEC-RAS, HEC-GeoRAS, Water surface elevation.
1. INTRODUCTION
Floods are one among the most periodic and shocking natural perils, effecting human lives and causing stark economic damage all over the world. It is assumed that flood risks will not wane in the imminent if it is not addressed properly, and with the arrival of weather change, flood strength and occurrence will lurk many parts of the India. Surge disturbs individuals' live, harm places and street systems in urban zones.
The process of flood inundation mapping is an essential component of flood risk management because flood inundation maps do not only provide accurate geospatial information about the extent of floods, but also, when coupled with a geographical information system, can help decision makers extract other useful information to assess the risk related to floods such as human loss, financial damages, and environmental degradation. For these reasons, flood maps have been widely used in practice to assess the potential risk of floods.
Flooding is a consequence of overwhelming or constant precipitation surpassing the absorptive limit of soils or because of the substantial arrival of streams from the dam or in case of break in the huge stockpiling tanks/dams, which regularly surpasses the stream limit of waterways or streams channel.
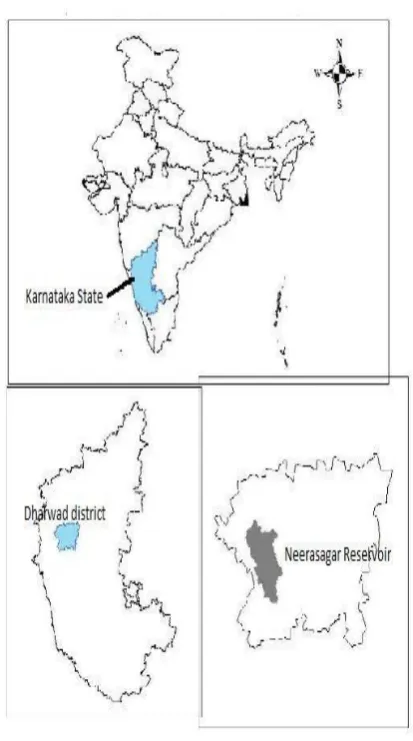
2. STUDY AREA AND DATA
[image:1.595.324.531.326.697.2]© 2016, IRJET | Impact Factor value: 4.45 | ISO 9001:2008 Certified Journal | Page 1280
3. Data used for Analysis
3.1 Cross sections of Dam
The HEC-RAS simulations and routing of the flood uses the cross-section of dam and the downstream of the dam also. Since, there were no cross-sectional details available for the downstream section of the dam upto the point of our interest. The Digital Elevation Model and HEC-GeoRAS has been used to obtain the cross-sectional details (which is presented in detail in this Chapter. However, the cross-section at the dam site was collected from the project authorities).
3.2 PMF. (For unsteady flow) Probable Maximum
Flood (PMF)
The PMF is the biggest surge that could possibly happen at a specific area, as a rule evaluated from likely most extreme precipitation, and where relevant, snow melt, combined with the most noticeably awful surge creating catchment conditions. For the most part, it is not physically or monetarily conceivable to give complete security against this occasion. The PMF characterizes the degree of surge inclined area, that is, the floodplain. The degree, nature and potential outcomes of flooding connected with a scope of occasions rarer than the surge utilized for outlining alleviation works and controlling advancement, up to and including the PMF occasion ought to be tended to in a floodplain hazard administration study.
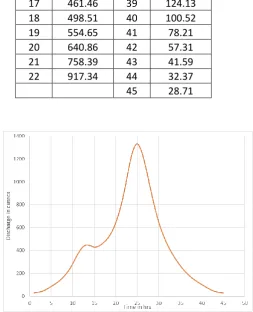
In the present study, the PMF estimates carried out by the project authorities were used to map the inundation caused due to the failure of the Dam. The estimated PMF for the Neerasagar project is presented in the Table 1 and Figure 2. Table -1: PMF Hydrograph ordinates at Neerasagar reservoir.
Time
(hrs)
Discharge
(m
3/sec)
Time
(hrs)
Discharge
(m
3/sec)
1
28.95
23
1110.11
2
33.71
24
1269.36
3
42.93
25
1331.42
4
60.99
26
1265.08
5
83.6
27
1124.12
6
107.68
28
950.74
7
135.95
29
786.11
8
173.32
30
648.01
9
220.51
31
539.06
10
281.55
32
451.04
11
353.88
33
380.04
12
413.76
34
318.59
13
445.45
35
265.72
14
442.46
36
220.47
15
429.22
37
182.27
16
436.29
38
150.57
17
461.46
39
124.13
18
498.51
40
100.52
19
554.65
41
78.21
20
640.86
42
57.31
21
758.39
43
41.59
22
917.34
44
32.37
[image:2.595.320.574.104.417.2]45
28.71
Fig 2 Flood hydrograph corresponding to PMF
4. METHODOLOGY
HEC-RAS is a water powered model created by the hydrologic building focus armed force corps of architects USA. It was discharged to help water powered designers in stream channel examination and floodplain distinguishing proof. Before long, it got to be standard stream pressure driven investigation program, later its capacities were extended for extension, weir, and duct examination. Initially it was developed for main frame computer use, currently it can work on PC & work stations.
The capabilities of HEC-RAS are
Modeling of one dimensional steady flow. Modeling of unsteady flow simulation.
Movable boundary sediment transport calculations. Modeling subcritical, supercritical, & mixed flow
regimes.
4.1 Preparation of Data for use in HEC-RAS
© 2016, IRJET | Impact Factor value: 4.45 | ISO 9001:2008 Certified Journal | Page 1281 the use of HEC-GeoRAS. The software can derive most of the
information required for the HEC-RAS program.
4.2 HEC-GeoRAS Development
HEC-GeoRAS is an arrangement of instruments particularly intended to handle geospatial information to bolster pressure driven model improvement and investigation of water surface profile results (HEC, 2005). GeoRAS helps engineers in making datasets (alluded to all in all as RAS Layers) in ArcGIS to concentrate data vital for pressure driven displaying. The most recent arrival of HEC-GeoRAS bolsters the extraction of rise information from DTMs in either the TIN or framework position.
GeoRAS requires that the client have a DTM. The DTM must be anticipated into a direction system–the coordinate arrangement of the DTM is utilized as the premise for building up each of the RAS Layers. GeoRAS likewise requires the Stream Centerline layer and Cross-Sectional Cut Line layer be made. The advancement of every other RAS Layers is discretionary taking into account the information requirements for the waterway power through pressure model.
4.3 Creating the required layer using HEC-GeoRAS
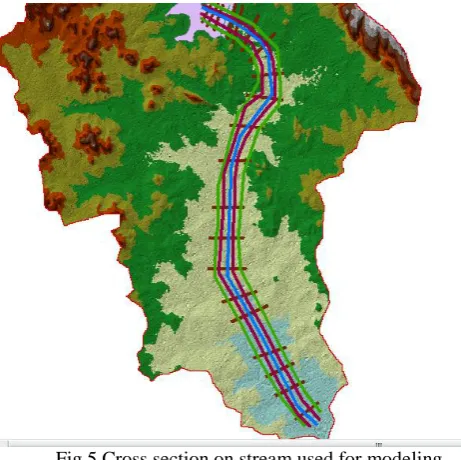
[image:3.595.327.490.154.410.2]The Stream Centerline layer is used to identify the connectivity of the river system. It is created in the downstream direction and is used to assign river stations to the cross-sections, bridges, and other structures to order computational nodes in the HEC-RAS model. The Cross-Sectional Cut Lines layer is the principal data constructed using HEC-GeoRAS. Cut lines are digitized across the flood plain area to capture the profile of the land surface. Cross-sections should be digitized perpendicular to the path of flow in the channel and overbank are as to be consistent with one- dimensional flow characteristics. Having created the bank lines and flow path centerlines prior to laying out cut line locations is advantageous.
Fig -3: Digital Elevation Model (DEM) for Neerasagar Watershed
Once the RAS Layers have been created, GeoRAS tools and menus are available to assign and populate attributed at Lastly, the data are written out to the HEC-RAS geo-spatial data exchange format and can be imported into HEC-RAS.
[image:3.595.309.540.462.692.2]Fig -4:
Triangulated Irregular Network (TIN) for
Neerasagar Watershed
Fig 5 Cross section on stream used for modeling
5. DAM BREAK ANALYSIS
5.1 Dam Break Phenomenon
[image:3.595.111.216.526.710.2]© 2016, IRJET | Impact Factor value: 4.45 | ISO 9001:2008 Certified Journal | Page 1282 which would bring about the occasion of their
disappointment could be calamitous. They change significantly relying upon the degree of the immersion zone, the measure of the populace at danger, and the measure of caution time accessible.
5.2 Dam Break Modeling
By and large, dam break demonstrating can be done by it is possible that i) scaled physical water driven models, or ii) scientific recreation utilizing PC. A current apparatus to manage this issue is the numerical model, which is most savvy and sensibly tackles the representing stream conditions of coherence and energy by PC reenactment.
Mathematical demonstrating of dam break surges can be done by possibly one dimensional examination or two dimensional investigation. In one dimensional examination, the data about the extent of surge, i.e., release and water levels, variety of these with time and speed of course through break can be had toward stream. On account of two dimensional examination, the extra data about the immersed region, variety of surface rise and speeds in two measurement can likewise be evaluated.
One dimensional examination is by and large acknowledged, when valley is long and limit and the surge wave attributes over a substantial separation from the dam are of fundamental interest. Then again, when the valley augments extensively downstream of dam and huge region is liable to be overflowed, two dimensional examination is essential.
5.3 Dam-Breach Parameters
The steady-state modeling has been done using the single flood value with a return of interest. In order to facilitate the analysis. The regional flood formulate developed by Mujumdar et al., (2008) has been used and the flood quantities has been computed and are shown in the Table 2
10
.
...
...
1
1
ln
ln
960
.
10
173
.
29
A
0.465t
Q
T
Where T= Return period, A=catchment area.
Hence for our study area of catchment 181 Sq Km and for different return period ‘RT’, QT is determined.
Table -2: Flood magnitude for different return periods based on regional flood formula.
RT
(Years)
Flood Discharge
(m
3/sec)
200
680.3049
500
793.1498
1000
878.4353
Table -3: Output profile Table for 200 year return period flood.
River
station
Q
m
3/
sec
W.S.
Elevation
(m)
Top
width
(m)
Froude
Number
14773.78 680 500.14
765
0.63
13966.04 680 498.58
899
0.4
12953
680 493.26
390
0.97
12114.62 680 490.69
1116
0.37
11282.67 680 490.12
1494
0.41
10341.5
680 486.08
747
0.91
9489.52
680 484.64
1143
0.45
8630.04
680 481.31
716
0.78
7535.11
680 476.98
639
0.64
6634.97
680 475.76
937
0.52
5988.36
680 472.57
1332
0.66
5252.07
680 469.27
860
0.53
4491.7
680 468.32
727
0.4
3834.21
680 467.98
1551
0.39
3291.66
680 464.84
1106
0.9
2271.58
680 460.79
1216
0.42
1441.72
680 459.01
1533
0.35
© 2016, IRJET | Impact Factor value: 4.45 | ISO 9001:2008 Certified Journal | Page 1283 Fig -7 cross sectional view
5.4 Un-Steady flow Modeling
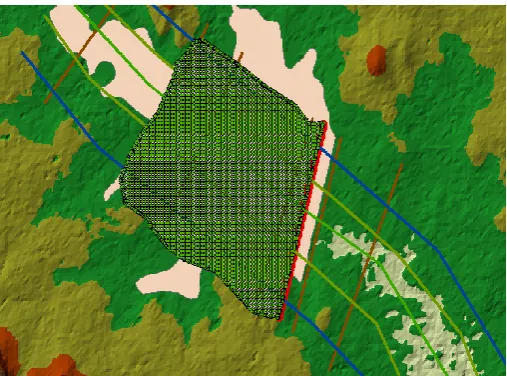
[image:5.595.322.588.447.588.2]In the present study, the un-steady flow modeling has been carried out using the PMF generated for the catchment as shown in Figure 5.8 In this case, we have studied the two cases, (i) Reservoir empty and (ii) Reservoir full conditions. The dam and the reservoir as represented in the HEC-RAS is given in Figure 8. However, before we simulate the flood inundation for these conditions, it has to be conceptualized how the dam would be breaching and the time taken for breaching after the PMF enters into the reservoir. The conceptualization is done by providing the details of dam breach and the boundary conditions.
Fig -8: The water storage area for the Neerasagar dam
5.5 Dam Breach Parameters
The assumptions regarding dam breach parameters are critical for dam break modelling. Thus, reasonable values for the breach size and development time along with feasible breach geometry are needed to make a realistic estimate of the outflow hydrographs. Nonetheless, determining the size and growth rate for breaches is an inexact science while they are key parameters in dam break models. Therefore, the
estimation of the breach parameters yield a significant source of uncertainty in the results and inturn downstream inundation extends. The proposed dam breach parameters are tabulated in Table 4.
Table -4: Dam breach parameters
5.6 Boundary Conditions
The assumptions regarding boundary conditions are also critical for dam break modelling as they could directly affect extend of downstream flood waters. Initial flows and water level values, input hydrographs, and downstream boundary conditions, were specified to initialize and run the dam break model.
Fig -9: inline structure data
These boundary conditions must be properly selected and they must best represent the site conditions. In this study the following conditions were considered; (i) the inflow hydrographs for the upstream boundary; four extreme input hydrographs of Probable Maximum Flood (PMF) flood was considered for the flood simulations; (ii) downstream boundary conditions were established as the normal depth at the last cross-section on the river.
Case (i): For Reservoir Empty Condition
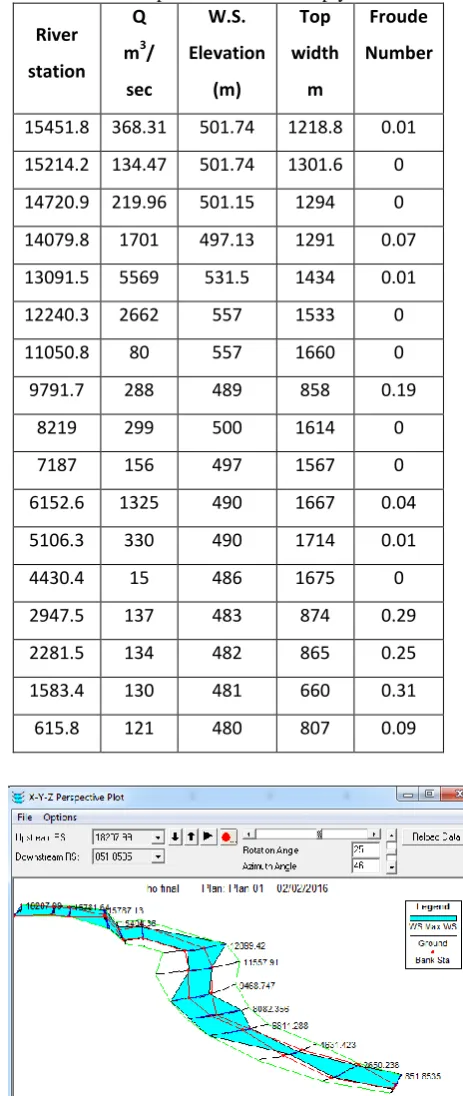
In this case, it is assumed that, the reservoir empty (no live storage) and PMF is approaching the Dam. In order to simulate the situation. The HEC-RAS requires to be given the various details of the DAM and EAC details as shown in Table 5. These information are fed to the software and the program
Sl.
No.
Parameter
Neerasagar
dam
1
Dam Crest Elevation (m)
590.7
2
Reservoir Level at time of
breach (m)
588
3
Effective Height (m)
16.58
4
Breach top width (m)
111
5
Breach width at bottom (m)*
100
6
Time to failure (h)
1
[image:5.595.37.291.456.644.2]© 2016, IRJET | Impact Factor value: 4.45 | ISO 9001:2008 Certified Journal | Page 1284 was executed for simulating the flood situation. The
[image:6.595.305.566.85.265.2]simulated results are tabulated in Table 5.
Table -5
Detailed output for Reservoir empty condition
River
station Q
m3/
sec
W.S.
Elevation
(m)
Top
width
m
Froude
Number
15451.8 368.31 501.74 1218.8 0.01
15214.2 134.47 501.74 1301.6 0
14720.9 219.96 501.15 1294 0
14079.8 1701 497.13 1291 0.07
13091.5 5569 531.5 1434 0.01
12240.3 2662 557 1533 0
11050.8 80 557 1660 0
9791.7 288 489 858 0.19
8219 299 500 1614 0
7187 156 497 1567 0
6152.6 1325 490 1667 0.04
5106.3 330 490 1714 0.01
4430.4 15 486 1675 0
2947.5 137 483 874 0.29
2281.5 134 482 865 0.25
1583.4 130 481 660 0.31
[image:6.595.51.288.129.690.2]615.8 121 480 807 0.09
[image:6.595.47.279.138.687.2]Fig -10: XYZ perspective profile for unsteady flow
Fig -11: cross sectional view for unsteady flow
Case (ii) For Reservoir Full Condition
In this case, it is assumed that, the reservoir is completely filled and PMF is approaching the reservoir. As it is conceptualized that, the PMF will be routed on the first instance by using the reservoir pool method and once the dam is breached, using the Muskingum method. The results obtained are tabulated in Table 6.
Table -6: Details of simulating for Reservoir Full condition
River
station
Q
m
3/
sec
W.S.
Elevation
(m)
Top
width
(m)
Froude
Number
15404 12080
504
733
0.57
14823 10097
502
696
0.48
12899
9544
495
747
0.95
11557
8856
489
625
0.3
9468
7536
484
873
0.72
8082
6615
483
1474
0.56
6811
7687
477
844
0.13
4631
7258
467
312
0.91
2650
5647
462
748
0.49
851
4600
461
1081
0.13
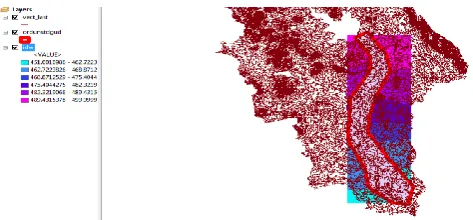
6. FLOOD INUNDATION MAPPING
[image:6.595.317.548.397.582.2]© 2016, IRJET | Impact Factor value: 4.45 | ISO 9001:2008 Certified Journal | Page 1285 Fig -12: Inundation mapping for 200 year RT flow value.
Fig -13: Inundation mapping for unsteady flow.
7. CONCLUSION
Various techniques and assumptions are available for developing the key components of dam breach model in HEC-RAS. The reservoir routing method, breach parameters, model used to develop the breach hydrograph, inclusion or exclusion of bridges, method of modeling storage in tributaries, and flow level in the receiving stream are just some of the factors that must be considered in the analysis. Each of these affects the results to varying degrees and the impact on one model may be different than on another.
In the present study, an attempt was made to simulate the flood inundation due to the breach of the Neerasagar dam. The simulations were done for various scenarios to understand the dynamics of the dam breach and to minimize the uncertainty in mapping the flood inundation. The results obtained show that, the conceptualization with which the model was set-up looked appropriate to the condition prevailing at the site. However, looking at the results obtained and the discussion, following are some of the major conclusions drawn;
The HEC-RAS provides the flood profile for the worst flood intensity. This profile will facilitate to adopt appropriate flood disaster mitigation measures.
The flood profiles for different flood intensities with different return periods can be plotted at any given cross section of river. Also, such flood profile can be plotted for entire length of river reach.
The major conclusion drawn from steady and unsteady flow analysis without dam, that the inundated area for steady flow state is 20 % more than unsteady flow. Whereas, for steady & unsteady flow analysis when dam breaks, area of inundation for steady flow state is 8 % more than unsteady flow case.
REFERENCES
[1] Apel, H., Thieken, A., Merz, B., and Blöschl, G. (2004). “Flood risk assessment and associated uncertainty.” National. Hazards Earth System. Sci., vol. 4(2), pp. 295–308.
[2] Apel, H., Thieken, A., Merz, B., and Blöschl, G. (2006). “A probabilistic modelling system for assessing flood risks.” National. Hazards, vol 38(1–2), pp.79–100.
[3] Arcement, G. J., and Schneider, V. R. (1989). “Guide for selecting Manning’s roughness coefficients for natural channels and flood plains.” U.S. Government Printing Office, Washington, DC, vol 6(3), pp.78-92.
[4] ASCE. (2007). The New Orleans hurricane protection system: What went wrong and why: A report, Reston, VA. Assistant Commissioner Engineering and Research (ACER). (1988). “Downstream hazard classification guidelines.” Technical Memorandum No. 11, U.S. Dept. of the Interior, Denver, vol 28(2), pp.86-105.
[5] Aureli, F., and Mignosa, P. (2004). “Flooding scenarios due to the levee breaking in the Po River.” Proc. Inst. Civ. Eng. Water Manage., vol 157(1), pp. 3–12.
BIOGRAPHIES
Sujay Kumar Hajeri: He is pursuing his M.tech studies at Dept. of Water and Land Mgmt. CPGS, VTU, Belagavi. His research areas are Water Resources.
Dr. Anand V Shivapur: He is currently working as Professor and HOD of Water and Land Management dept., Centre for PG Studies, VTU, Belagavi. He has total experience of 31 years in teaching, His research areas are Watershed Mgmt., Hydrology, Use of RS and GIS for Irrigation and watershed.
[image:7.595.40.277.235.345.2]