ISSN: 1992-8645 www.jatit.org E-ISSN: 1817-3195
257
SCALE TO COMPOSITION FAULT INCLINED (SCFI) &SCALE
TO COMPOSITION HALENESS (SCH): DESIGN OF HEURISTIC
METRICS TO ASSESS SERVICE COMPOSITION IS FAULT
INCLINED OR HALE
V.SUJATHA1, Dr.G.APPA RAO2
1
Asst. Professor, Dept. of CSE, GITAM School of Technology, Hyderabad
2
Professor, Dept. of CSE, GITAM University, Visakhapatnam
1
Email:[email protected]
ABSTRACT
One of the considerable research objective of the current decade is developing applications by composing individual services for web and cloud environment. The majority of research in this context is aimed to optimize the service composition, which is in the raise quality. Many of existing models are heuristic scales defined by machine learning approaches. The constraint of these existing models is that they are centric to one or two de-facto factors of the quality of service such as response time and reliability. This practice of optimizing service composition is not robust and scalable in order to achieve the optimal service composition towards the raise of quality. The other significant issue of research is many of existing models are not linear towards computational complexity, which is due to the compliment of evolutions against the raise in available services count. In this con-text here we devised a two QoS metrics called Scale to Composition Fault Inclined and Scale to Composition Haleness, which enables to assess the services based on multiple number of QoS metrics and also should stabilize the computational complexity to linear. The experiment results are indicating the significance of the proposed model towards scalable and robust QoS- aware service composition.
Keywords:Web Service Compositions, Composition Support, Service Composition Impact Scale, Service Descriptor Impact Scale, Web Service Composition Fault Proneness.
1 INTRODUCTION
Web service composition in a service oriented computation discovers and connects several web services for a QoS based optimal solution of the services. The web services are web based software belonging to a service oriented architecture which may be immediately executed for a composite service delivery over the web. A service composition involves the function of first determining the tasks for the client provided business process. Next in the service composition suitable web services are searched for implementing the allotted tasks. The selected services are then combined into a loosely joined single component and the order of priority for executing the services is determined. Finally the web services based on the established priority are executed according to the service requirements.
The tasks implemented in the business process are first identified and these complex tasks are
ISSN: 1992-8645 www.jatit.org E-ISSN: 1817-3195
258 factors of QoS and the context of the composition for an optimal solution.
The optimality achievable from a service composition is defined in terms of Availability, Accessibility, cost, integrity, throughput, round-trip time, reliability, regulatory and Security factors. The optimality achieved differs for different service compositions with different contexts of compositions. For example a service independently may show good throughput but in a composition of services the same service could be a total failure in accommodating and performing in the composition [1][2][3][4][5]. Another example is a context of a service composition may place a higher demand for a QoS factor over another such as a cost optimized service composition where reliability is not the main criteria or a context where a balance of the QoS factors like cost, reliability may be required without compromising security.
The services involved in the previously implemented web service compositions would assist in the fault prone impact assessment before implementing newer web services. The existing State-of-the-art composition techniques [2] [3] [4] [5] [6] [7] [8] are error prone and lacking maturity for guaranteeing totally fault free operations. In the strategies if we may find error prone behavior subsequent to the deployment of these strategies it may result in unimportant solutions, further cost escalations, and severe vulnerabilities. All this makes estimation of the fault proneness in the composition scope necessary. Our approach devised in this paper is a statistical approach introduced for estimating the service composition to determine if it is fault inclined or hale. This proposed strategy is capable of assessing any current approach of web service composition.
2 ASSOCIATED WORK
The contemporary research work has given literature substantially in the strategies for service composition devised using the metaheuristic algorithm and based on QoS awareness. In these research studies towards devising services based on composite offerings the method by Yu et al. [4] uses a greedy strategy integrated to the features of QoS together with a strategy of applied adaptiveness. In least search time the approach effectively determines a solution. An approach for web service composition called WSMO (web service modeling ontology) in [5] by Xiangbing et al. is devised for a composition with QoS service offering using a genetic algorithm to determine an
effective optimal solution in the least search time. A chaos PSO based approach introduced in [11] by Li et al is devised for selecting optimality based web services. An approach devised in [12] by Xiangwei et al. is introduced for composing web services with QoS using two strategies of, algorithm of discrete PSO strategy and CPN (color Petri nets). The CPN scheme models among candidate services the relations of multi-attribute, and the multi-constraint, and next the discrete PSO algorithmic approach implements sequentially legal firing to determine an optimal solution [13]. An approach which is a performance efficient composition of web services in [14] by Mao et al. is devised with three metaheuristics based algorithms (PSO, EDA, GA). In the method devised by Zhao et al. [15] has a QoS awareness devised web service composition based on enhancing the improved discrete PSO based immune optimization approach. In this devised approach the local best strategy is enhanced with the IO (immune optimization) algorithm whereas the PSO algorithm is used to determine the global optimization value and to minimize the search capability for a scalable model. The approach based on a hybrid strategy of GRASP and path re-linking algorithm in [16] by Parejo et al. is devised for web service composition offering QoS aware runtime quality optimized services.The above proposed models have considerable importance for their service quality delivered however the limitation of these approaches is that they restrict themselves to only a single or a couple of QoS factors. This hinders the accuracy of determining the scalable factor of the composition. Also in the service composition the associated complexity of computation is O(n2) where for every task the services associated increase in increments and in evaluating the services composition the related complexity becomes higher.
ISSN: 1992-8645 www.jatit.org E-ISSN: 1817-3195
259 globally in [10] uses a model of mixed integers based on linear programming. A services selection strategy models the complex rucksack problem of multi-choice multi-dimension in [7] by assigning to the services various levels of quality for the selection of a best service.
These approaches are mostly based on the user rating given to the models and its various parameters. The QoS solutions are defined by a ranking mechanism/ However the possibility of a scalable ordering of the different models with the ranking mechanism is however rather impossible. The strategies devised for a QoS web service composition are many where the presence of fault proneness is also the same in the composition of the services. Hence there is need for devising a model with a mechanism which evaluates the fault proliferation and resurgence especially in service compositions based on highly complex dynamically coupled architectures.
The models for benchmark service quality assessment are mostly either based on the attributes or dependent on the rating given by the users or further have both the strategies included in their approach. If we consider the attributes specific composition, the relevance of a composition to a specific set of attributes would differ when compared with the attributes associated with another composition. Also in a user ratings based composition the rating importance varies with contextual factors. Further most of the models of benchmarking assess the services by their performance independently. In reality however the performance of a service may influence the functionality of another service. The approach proposed by us is a statistics based impact scale estimation towards service composition under fault proneness. The approach is devised with a metric
introduced and termed by us as composition support of service compositions and service descriptors. The heuristic metrics developed in this paper are based on our previously devised statistical assessment models which are strategies based on predictive accuracy and scalable factor called Web Service Composition Impact Scale towards Fault Proneness [12] and QoS metrics for robust service composition [13]. The heuristic metrics devised here in this paper are termed as, Scale to Composition Fault Inclined (SCFI) and Scale to Composition Haleness (SCH). The devised metaheuristic model is not dependent on specific QoS factors or quantity of factors. The model makes impact assessment of every service based on a measurement of their Composition Fault Inclined Scope in terms of multiple factors of QoS.
3 DEFINING A HEURISTIC SCALE TO
COMPOSITION FAULT INCLINED
(SCFI) AND SCALE TO COMPOSITION HALENESS (SCH)
3.1 Dataset Preprocessing
ISSN: 1992-8645 www.jatit.org E-ISSN: 1817-3195
260
Table1: Description Of Dataset Attributes
Attribute ID Attribute of Complete Record Description
1 Associability Services from the single WSDL
2 Cyclic Number of services in cyclic execution
3 Dependent No of services dependent of other services
4 Parallel No of services involved in parallel execution
5 Repetitive No of execution attempts due to failure
6 Uptime Service uninterrupted available time
7 Services count No of services involved in composition
8 Diversity Services from number of service providers
9 Roundtrip time Composition execution time
10 Cost Sum of the services cost involved in composition
11 Reliability Service accuracy towards response
12 response time Composition response time
13 versioning ratio No of times composition is updated
14 Status Label that indicates the composition is successful or failed
3.2 Attribute Optimization for Defining Scale to Composition Fault Inclined
Let partition the preprocessed set of records based on their labels, such that the records labeled as hale is one set, records labeled as fault inclined is other set. Consider the unique values of each attribute values set f v NRSi ( ) in the resultant records-set
(
NRS
)
with records labeled as hale and theircoverage percentage as
1 1 2 2 3 3 4 4
{ ( , ), ( , ), ( , ), ( , ),..., ( , )}
i i i i i i j j
f v= f v c f v c f v c f v c f v c
. Further the attribute optimization for fault inclined records is done as follows:
• Let consider the records set rs NRS( ) contains records those labeled as normal.
• Let f FPSi( )be the attribute
f
i ofFPS
and
f FPS
i(
)
vsbe the set of values assigned to that attribute inFPS
• Create an empty set f NRSi( )vsof size | f FPSi( ) |vs , then fill it with values from
( )
i
f v NRS according to their coverage
percentage such that
| f FPSi( ) | vs ≅ | f NRSi( ) |vs .
• This process is opted to prepare the attribute values vector f NRSi( )vs of each attribute
f
iof theNRS,• This process should be applied for all attributes of the record-set and refer that resultant attributes with values as a set
NRS
.• The canonical correlation (see section 3.4) will be done further, which is between each attribute values set
f FPS
i(
)
vsand(
)
i vs
f NRS
ofFPS
andNRS
respectively.
• Further, the attributes of the
FPS
can be considered as optimal, which are having canonical correlation is less than given threshold or zero. Further we form a record setOFPS
, which is having records with values of only attributes that are assessed as optimal through canonical correlation, and this record setOFPS
is used further to define the scale to Composition Fault Inclined (SCFI).3.3 Attribute Optimization for Defining Scale to Composition Haleness
As like as the process explored in section 3.2, consider the unique values of each attribute values setf v FPSi ( ) in the resultant records-set
(
FPS
)
with records labeled as normal and their coveragepercentage as
1 1 2 2 3 3 4 4
( ) { ( , ), ( , ), ( , ), ( , ), ..., ( , )}
i i i i i
i j j
f v FPS f v c f v c f v c f v c f v c
ISSN: 1992-8645 www.jatit.org E-ISSN: 1817-3195
261 . Further, the attribute optimization for Fault Inclined records is done as follows:
• Let consider the records set rs FPS( ) contains records those labeled as fault inclined.
• Let f NRSi( )be the attribute
f
i ofNRS
and
f NRS
i(
)
vsbe the set of values assigned to that attribute inNRS
• Create an empty set f FPSi( )vsof size | f NRSi( ) |vs , then fill it with values from
( )
i
f v FPS according to their coverage
percentage such that
| f NRSi( ) | vs ≅ | f FPSi( ) |vs .
• This process is opted to prepare the attribute values vector f FPSi( )vs of each attribute
f
i theFPS,• This process should be applied for all attributes of the record-set and refer that resultant attributes with values as a set
FPS
.• The canonical correlation analysis (see section 3.4) will be done further, which is between each attribute values set
(
)
i vs
f NRS
andf FPS
i(
)
vs ofNRS
and
FPS
respectively.Further, the attributes of the
NRS
can be considered as optimal, which are having canonical correlation is less than given threshold or zero. Further we form a record setONRS
, which is having records with values of only attributes that are assessed as optimal through canonical correlation, and this record setONRS
is used further to define the Scale to Composition Haleness (SCH).3.4 Canonical Correlation Analysis
The multidimensional datasets
X
andY
are two data sets considered and the in-between linear relationships are established with the auto covariance’s and cross-covariance’s matrices of second-order with standard statistical technique CCA and the results offered are creditable and comprehendible results. The technique is based on finding 2 bases one each for the datasets ‘X
’and ‘Y
’, where the ‘X
’and ‘Y
’datasets matrix ofcross-correlation becomes diagonal whereas, correlations of the diagonal is maximized.
The parameters for implementing the canonical correlations in CCA are studied in the paper [19], [20] where,
X
andY
data vectors should be of equal number; however the data vectorsx
∈
X
andy Y
∈
may have varying dimensions assuming the mean is zero. The canonical correlations computation is solved using the equations of eigenvector.1 1 2
xx xy yy yx x x
C C C C w
− −=
ρ
w
1 1 2
yy yx xx xy y y
C C C C w
− −=
ρ
w
(1)
Here
C
yx=
E yx
{
T}
whereρ
2or Eigen values are square of canonical correlations and ‘w
x’and ‘x
w
’ or the Eigen vectors are normalized CCA basis vectors. The solutions to the equations which are considered are those equivalents to non-zero value whose number is equivalent tox
andy
vectors lesser dimensional value.The method followed in various ICA and BSS techniques is also used here where,
x
andy
data vectors if prewhitened the solution (1) could be simplified [21]. Following the process of prewhitening, the canonical correlationsC
xx andyy
C
are both converted to unit matrices. AsT yx xy
C
=
C
, Eq (1) is converted to,2
T
xy xy x x
C C w
=
ρ
w
2
T
yx yx y y
C C w
=
ρ
w
(2)
As these equations are however really equations depicting the singular value decomposition (SVD) [22] of the cross-covariance matrix
C
xy:
1
L
T T
xy i i i
i
C
U V
ρ
u v
=
= Σ
=
∑
ISSN: 1992-8645 www.jatit.org E-ISSN: 1817-3195
262 Here
U
andV
represent orthogonal squarematrices
(
U U
T=
I
, V
TV
=
I
)
comprising ofi
u
andv
i representing singular vectors. In our approach, the singular vectors considered above arexi
w
andw
yi representing basis vectors deliveringcanonical correlations. The matrices
U
andV
, andthe subsequent
u
i andv
i singular vectors dimensionalities usually vary according to the varied dimensionsx
andy
data vectors. The pseudo diagonal matrix0
0 0
D
Σ =
(4)
includes a diagonal matrix
D
comprising of singular values equal to non-zero and attached with zero matrices which makes the matrixΣ
to be compatible with various dimensions ofx
andy
. The non-zero singular values are basically the nonzero canonical correlations whose number is lesser than any ofx
andy
data vectors dimensionsif
C
xyor the cross-covariance matrix has full rank.3.5 Defining the Scale to Composition Fault Inclined (SCFI)
Let consider the compositions set
OFPS
that formed due to canonical correlation analysis (see section 3.2).Further, form a set
F OFPS
(
)
such that( ) { ( ) { }
( ) { }
1 11 12 13 1a 2 21 22 23 2b F OFPS = f OFPS = v ,v ,v ,...v , f OFPS = v ,v ,v ,...v , .
. . . .,
f OFPS = v ,v ,v ,...vi( ) { i1 i2 i3 ic}}
Here in the above description
( ) { }
i i1 i2 i3
f OFPS = v ,v ,v ,...∀i = 1..n represents the optimal attribute
f
i and the unique values{v ,v ,v ,...i1 i2 i3 }assigned to that attribute of all the records in set
OFPS
.Rank the each value vijof optimal attribute fi,
which is based on their coverage in the f OFPSi( ).
Further represent each composition
{r ii∀ =1... |OFPS|∧ ∈ri OFPS}as a setrs r( )i with
the respective rank of the value of each optimal attribute as follows:
1 1
2 2
3 3
{ ( {1.. | |}), ( {1.. | |}), ( {1.. | |}), ...,
( {1.. | |})}
i j
j j
i j i
r f v j f f v j f f v j f
f v j f
= ∀ ∈
∀ ∈ ∀ ∈
∀ ∈
1 1 2 2 3 3
( ) { ( (i j {1..| |})), ( (j {1..| |})), ( (j {1..| |})),..., ( (i j {1..| |}))}i
rs r =r f v j∀∈ f r f v j∀∈ f r f v j∀∈ f r f v j∀∈ f
Here in this description riis a record that belongs
to the
OFPS
, which is representing the set of respective values of the optimal attributes. The representation f vi( j∀ ∈j {1.. | fi|})is the value vjof optimal attribute fi, and | fi|represents the size of all possible values to the attribute fi. And the set
( )i
rs r is representing compositionriby the respective ranks of the values of the optimal
attributes. The representation
( (i j {1.. | i |}))
r f v∀ ∈j f is the rank of the value vjof
the attribute fi.
Further, for eachrs r( )i , find the aggregate rank ( )i
ar r as follows, which is an average of ranks representing the respective values of the optimal attributes of the compositionri
1
( (
{1... |
|})
( )
n
i j i
i i
r f v
j
f
ar r
n
=
∀ ∈
=
∑
The standards defined by ANOVA [23],
(i) The measure average reflects the centrality of the distribution, but not significant to consider it alone as representation of the distribution, since it is not considering the uniform distribution.
ISSN: 1992-8645 www.jatit.org E-ISSN: 1817-3195
263 each other, which is also not confirming the distribution status. (iii) The kurtosis [23] represents the state
of uniform distribution. If kurtosis found to be platy-kurtic (kurtosis value less than three), then it is representing the uniform distribution. (iv) Henceforth, the distribution with
platy-kurtic value is significant to consider as uniform distribution. Henceforth, we measure the kurtosis of each distribution and order them by their kurtosis from minimal to maximal. The kurtosis of the ranks of each compositiontiis measured as follows:
2 1
( )
( ( (
{1... |
|})
( ))
i
n
i j i i
i ar r
r f v
j
f
ar r
n
σ
=∀ ∈
−
=
∑
4 1( ( (
{1... |
|})
( ))
4
ni j i i
i
r f v
j
f
ar r
m
n
=∀ ∈
−
=
∑
( ) ( )4
i i r ar rm
g
σ
=
Here in these equations σar r( )i represents the variation observed between ranks of optimal attributes of a compositionrtand ( )
i
r
g represents the kurtosis observed between the ranks of the optimal attributes of the compositionri
Further we consider the compositions with platy-kurtic distribution of the ranks, and then mean of the ranks of these records will be considered as a scale to assess the composition fault Inclined.
1
( )
(
)
n i iar r
OFPS
n
µ
=
∑
=Here µ(OFPS) represents the mean of the aggregate ranks of ncompositions of
OFPS
Here in the above equation SCFI represents the scale to composition fault Inclined, m represents the number of records with platy-kurtic rank distribution ( ( )
3
i
r
g
<
) and having the rank greater thanµ(OFPS).The lower and upper bounds of the scale will be assessed as follows:
(
)
21 ( ) 1 m i i OFPS
ar r SCFI stdv m = − = −
∑
Here in above equation the standard deviation of the aggregate ranks of all record in ODRSis measured
low OFPS
SCFI
=
SCFI
−
stdv
upr OFPS
SCFI
=
SCFI
+
stdv
3.6 Scale to Composition Haleness (SCH).
The scale that devised here in this section is aimed to assess the Haleness state of the composition. The Strategy that explored on compositions set
OFPS
to define SCFI (see section 3.5) is also applied on compositions setONRSto devise Scale to Composition Haleness (SCH). The process applied on ONRSis briefed here:Form a set
F ONRS
(
)
such that(
)
{ (
)
{
}
(
)
{
}
1 11 12 13 1a
2 21 22 23 2b
F ONRS = f ONRS = v ,v ,v ,...v
,
f ONRS = v ,v ,v ,...v
,
.
.
.
.
.,
f ONRS = v ,v ,v ,...v
i(
)
{
i1 i2 i3 ic}}
Here in the above description
( ) { }
i i1 i2 i3
f ONRS = v ,v ,v ,...∀i = 1..n represents the optimal attribute
f
i and the unique values{v ,v ,v ,...i1 i2 i3 }assigned to that attribute of all the
records in set
ONRS
.Rank the each value vijof optimal attribute fi,
which is based on their coverage in the f ONRSi( ).
Further represent each composition
{r ii∀ =1... |ONRS|∧ ∈ri ONRS}as a setrs r( )i with
the respective rank of the value of each optimal attribute as follows:
ISSN: 1992-8645 www.jatit.org E-ISSN: 1817-3195
264
1 1
2 2
3 3
{ ( {1.. | |}), ( {1.. | |}), ( {1.. | |}), ...,
( {1.. | |})}
i j
j j
i j i
r f v j f f v j f f v j f
f v j f
= ∀ ∈ ∀ ∈ ∀ ∈ ∀ ∈ 1 1 2 2 3 3
( ) { ( ( {1.. | |})), ( ( {1.. | |})), ( ( {1.. | |})), ...,
( ( {1.. | |}))}
i j
j j
i j i
rs r r f v j f r f v j f r f v j f
r f v j f
= ∀ ∈
∀ ∈ ∀ ∈
∀ ∈
For eachrs r( )i , find the aggregate rank ar r( )i as
follows, which is an average of ranks representing the respective values of the optimal attributes of the compositionri
1
( (
{1... |
|})
( )
ni j i
i i
r f v
j
f
ar r
n
=
∀ ∈
=
∑
According to the ANOVA [23] standards (explored in section 3.5), we measure the kurtosis of each distribution and order them by their kurtosis from minimal to maximal. The kurtosis of the ranks of each compositiontiis measured as follows:
2 1
( )
( ( (
{1... |
|})
( ))
i
n
i j i i
i ar r
r f v
j
f
ar r
n
σ
=∀ ∈
−
=
∑
4 1( ( (
{1... |
|})
( ))
4
n
i j i i
i
r f v
j
f
ar r
m
n
=∀ ∈
−
=
∑
( ) ( )4
i i r ar rm
g
σ
=
Here in these equations ( ) i
ar r
σ represents the variation observed between ranks of optimal attributes of a compositionrtand g( )ri represents the kurtosis observed between the ranks of the optimal attributes of the compositionri
Further we consider the compositions with platy-kurtic distribution of the ranks, and then mean of the ranks of these records will be considered as a scale to assess the Composition Fault Inclined.
1
( )
(
)
n i iar r
ONRS
n
µ
=
∑
=Here µ(ONRS) represents the mean of the aggregate ranks of ncompositions of ONRS
1
( )
m i iar r
SCH
m
==
∑
Here in the above equation SCH represents the scale to Composition haleness, m represents the number of records with platy-kurtic rank distribution ( ( )
3
i
r
g
<
) and having the aggregate rank greater thanµ(ONRS).The lower and upper bounds of the scale will be assessed as follows:
( ) 1
{ ( )
3}
i
m
i r i
ar r
g
m
µ
=∃
<
=
∑
The above equation is finding the mean
µ
of the aggregate rank of the records with platy-kurtic feature rank distribution.(
)
21
( )
1
m i i ONRSar r
stdv
m
µ
=−
=
−
∑
Here in above equation the standard deviation of the aggregate ranks of all record in ONRSis measured
low ONRS
SCH
=
SCH
−
stdv
upr ONRS
SCH
=
SCH
+
stdv
The Scale to Composition Fault Inclined (SDP) and Scale to Composition Haleness (SCH) that are assessed from the given compositions set for training will be used further to assess the scope of Composition Fault Inclined or haleness of a given composition.
ISSN: 1992-8645 www.jatit.org E-ISSN: 1817-3195
265
• Preprocess the given composition and reform it as record mrSCFIwith only values of optimal attributes of the SCFI and similarly reform it as record mrSCHwith only values of optimal attributes of the
SCH.
• To assess the Fault Inclined of the compositionmrSCFI, form rs mr( SCFI)with the respective rank of the value of each optimal attribute ofSCFI.
• To assess the Composition Haleness of the compositionmrSCH, form rs mr( SCH)with the respective rank of the value of each optimal attribute ofSCH.
• Find the aggregate rank of the mrSCFIas
( SCFI)
ar mr and also find the aggregate rank of the mrSCHas ar mr( SCH)
[image:9.612.86.532.235.496.2]Further the state of given composition mris assessed as follows:
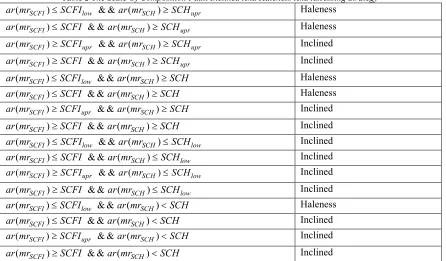
Table 2 The Scale Of Composition Fault Inclined And Haleness And Assessing Strategy
( SCFI) low & & ( SCH) upr
ar mr ≤SCFI ar mr ≥SCH Haleness ( SCFI) & & ( SCH) upr
ar mr ≤SCFI ar mr ≥SCH Haleness
( SCFI) upr & & ( SCH) upr
ar mr ≥SCFI ar mr ≥SCH Inclined ( SCFI) & & ( SCH) upr
ar mr ≥SCFI ar mr ≥SCH Inclined
( SCFI) low & & ( SCH)
ar mr ≤SCFI ar mr ≥SCH Haleness
( SCFI) & & ( SCH)
ar mr ≤SCFI ar mr ≥SCH Haleness
( SCFI) upr & & ( SCH)
ar mr ≥SCFI ar mr ≥SCH Inclined
( SCFI) & & ( SCH)
ar mr ≥SCFI ar mr ≥SCH Inclined
( SCFI) low & & ( SCH) low
ar mr ≤SCFI ar mr ≤SCH Inclined
( SCFI) & & ( SCH) low
ar mr ≤SCFI ar mr ≤SCH Inclined ( SCFI) upr & & ( SCH) low
ar mr ≥SCFI ar mr ≤SCH Inclined
( SCFI) & & ( SCH) low
ar mr ≥SCFI ar mr ≤SCH Inclined
( SCFI) low & & ( SCH)
ar mr ≤SCFI ar mr <SCH Haleness
( SCFI) & & ( SCH)
ar mr ≤SCFI ar mr <SCH Inclined ( SCFI) upr & & ( SCH)
ar mr ≥SCFI ar mr <SCH Inclined
( SCFI) & & ( SCH)
ar mr ≥SCFI ar mr <SCH Inclined Here in the table 2, all possible combinations of
SCFI and SCH and the impact of those combinations explored. Regardless of themrSCH, if
SCFI
mr is greater than SCFIthen the record confirmed to be Composition Fault Inclined. But in contrast, the Composition Haleness is dependent of
SCFI, which is indicating that though the composition mrSCHis more than the value ofSCH, it’s mrSCFImust be less than the SCFI to conclude that the given composition mris scaled as Haleness. This may leads to slight increase in false positives in prediction but strictly avoids false negatives, which is an accuracy measurement of fault Inclined.
4 EXPERIMENTAL RESULTS AND
PERFORMANCE ANALYSIS
The experiments were carried out on dataset that explored in section 3.1. Initially partitioned the
ISSN: 1992-8645 www.jatit.org E-ISSN: 1817-3195
[image:10.612.84.528.113.254.2]266
Table 1 Statistics Of The Experiment Results
Total Number of Compositions 303
Range of QoS attributes of a composition 13
Compositions used for defining scale 80% (242 records)
Compositions used for performance analysis 20% (61 records)
Scale of Composition Fault Inclined SCFI observed 7.11324
low
SCFI observed 5.575204
upr
SCFI observed 8.651277
Scale of Composition Haleness SCHobserved 2.982372
low
SCH observed 2.35923
upr
[image:10.612.90.528.278.697.2]SCH observed 3.605513
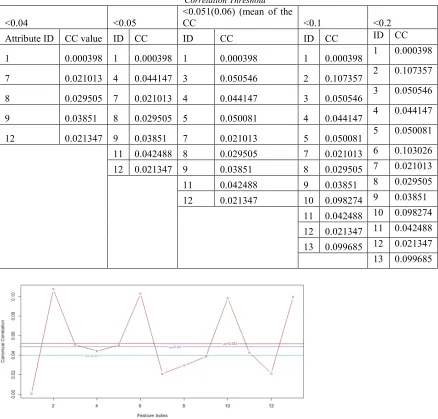
Table 2 Selected Qos Attributes Of The Compositions Labeled As Fault Inclined Under Different Canonical Correlation Threshold
<0.04 <0.05
<0.051(0.06) (mean of the
CC <0.1 <0.2
Attribute ID CC value ID CC ID CC ID CC ID CC
1 0.000398 1 0.000398 1 0.000398 1 0.000398 1 0.000398
7 0.021013 4 0.044147 3 0.050546 2 0.107357 2 0.107357
8 0.029505 7 0.021013 4 0.044147 3 0.050546 3 0.050546
9 0.03851 8 0.029505 5 0.050081 4 0.044147 4 0.044147
12 0.021347 9 0.03851 7 0.021013 5 0.050081 5 0.050081
11 0.042488 8 0.029505 7 0.021013 6 0.103026
12 0.021347 9 0.03851 8 0.029505 7 0.021013
11 0.042488 9 0.03851 8 0.029505
12 0.021347 10 0.098274 9 0.03851
11 0.042488 10 0.098274
12 0.021347 11 0.042488 13 0.099685 12 0.021347 13 0.099685
[image:10.612.90.530.280.693.2]ISSN: 1992-8645 www.jatit.org E-ISSN: 1817-3195
[image:11.612.86.528.122.645.2]267
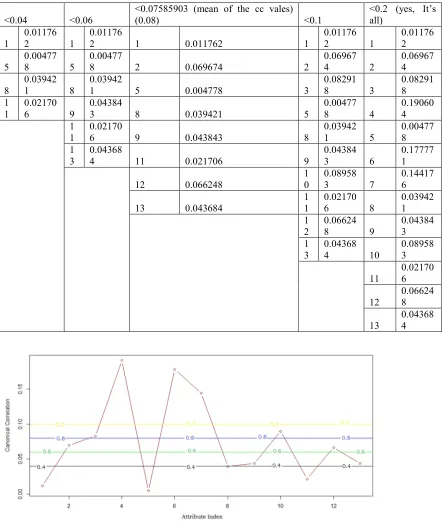
Table 3 Selected Qos Attributes Of The Compositions Labeled As Hale Under Different Canonical Correlation Thresholds
<0.04 <0.06
<0.07585903 (mean of the cc vales)
(0.08) <0.1
<0.2 (yes, It’s all)
1
0.01176
2 1
0.01176
2 1 0.011762 1
0.01176
2 1
0.01176 2
5
0.00477
8 5
0.00477
8 2 0.069674 2
0.06967
4 2
0.06967 4
8
0.03942
1 8
0.03942
1 5 0.004778 3
0.08291
8 3
0.08291 8 1
1
0.02170
6 9
0.04384
3 8 0.039421 5
0.00477
8 4
0.19060 4 1
1
0.02170
6 9 0.043843 8
0.03942
1 5
0.00477 8 1
3
0.04368
4 11 0.021706 9
0.04384
3 6
0.17777 1
12 0.066248
1 0
0.08958
3 7
0.14417 6
13 0.043684
1 1
0.02170
6 8
0.03942 1 1
2
0.06624
8 9
0.04384 3 1
3
0.04368
4 10
0.08958 3
11
0.02170 6
12
0.06624 8
13
0.04368 4
Figure 2: Qos Attributes Of The Compositions Labeled As Hale And Their Optimality Under Divergent CC Thresholds
4.1 Performance Analysis
The robustness and prediction accuracy of the scales SCFIand SCHare assessed through 62
records, which are of the combination of 40 fault inclined and 22 hale compositions.
ISSN: 1992-8645 www.jatit.org E-ISSN: 1817-3195
268 The count of true positives are (records predicted as truly fault inclined) 40, the count of true negatives are (records predicted as truly hale) 20, the count of false positives are (records predicted as falsely fault inclined) 2 and the count of false negatives are (the records predicted as falsely hale) 0.
[image:12.612.91.288.334.428.2]Since the experimental results indicating that fault inclined composition prediction is 40 out of given 40 compositions, hence prediction error towards fault inclined compositions are 0.0. The prediction accuracy of normal compositions is observed as 20 among the given 22 compositions, hence the prediction error ratio is approx. 0.09, which is to be negligible as in the track of sensitive service composition needs, the composition actually fault inclined should not be diagnosed as hale, in contrast a hale composition can be suspected falsely as fault inclined and may recommend to further assessment strategies.
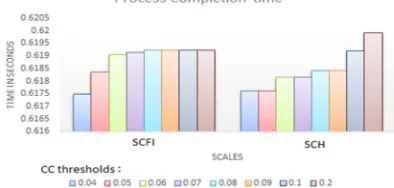
Figure 3: Process completion time of SCFI and SCH under divergent optimal attributes selected through
various canonical correlation thresholds
The prediction accuracy of the model devised here in this manuscript is explored through statistical assessment metrics called precision, recall and f-measure (see table 5). The value obtained for metric recall indicating that the devised model is highly robust and scalable towards assessing fault prone scope, and the precision also indicating that the prediction accuracy of the model is high and approximately it is 97%.
Table 4: The precision, recall and the f-measure of the predictions
Precision 0.952381
Recall 1
F-Measure 0.97561
The process time of the application is stable since the increase in number of optimal attributes is not influencing the process complexity (see fig 3)
5 CONCLUSION
This manuscript introduced a novel heuristic scale to assess the fault Inclined scope of the given service composition. In regard to this, two heuristic metrics called Scale to Composition Fault Inclined (SCFI) and Scale to Composition Haleness (SCH) is devised. In contrast to the existing benchmarking models, the proposed metrics are assessing the composition fault Inclined scope and haleness referred as SCFI and SCH respectively. Further the combinations of these SCFI and SCH values of the given service compositions are used to assess the state of that composition. The process opted to devise these metrics is initially finding the optimal attributes of the given fault inclined and hale composition records that represented by QoS attributes, which is done through the canonical correlation analysis. Further the service compositions of fault inclined and hale with optimal attributes are used to assess the metrics SCFI and SCH. The experimental results are optimistic and concluding the prediction accuracy and robustness. The future work can be the definition of fuzzy model to estimate the combination of SCFI and SCH values.
REFERENCES:
[1] R. Anane, K.-M. Chao, Y. Li, Hybrid composition of web services and grid services,in: Technology, Commerce and e-Service, 2005. EEE '05. Proceedings. The 2005 IEEE Inter-national Conference on, 2005, pp. 426-431.
[2] J. El Hadad, M. Manouvrier, M. Rukoz, Tqos: Transactional and qos-aware selection algo-rithm for automatic web service composition, Services Computing, IEEE Transactions on 3 (1) (2010) 73-85.
[3] Strunk, Qos-aware service composition: A survey, in: Web Services (ECOWS), 2010 IEEE 8th European Conference on, 2010, pp. 67-74.
[4] Y. Yu, H. Ma, M. Zhang, An adaptive genetic programming approach to qos-aware web services composition, in: Evolutionary Computation (CEC), 2013 IEEE Congress on, 2013, pp. 1740-1747.
[image:12.612.117.273.624.674.2]ISSN: 1992-8645 www.jatit.org E-ISSN: 1817-3195
269 [6] Ardagna, D., &Pernici, B. (2007). Adaptive
service composition in flexible processes; IEEE Transactions on Software Engineering, 33(6), 369–384.
[7] Zheng, H., Zhao, W., Yang, J., &Bouguettaya, A. (2012). QoS analysis for web service compositions with complex structures. IEEE Transactions on Services Computing,
1939-1374, PP(99), 1.
http://dx.doi.org/10.1109/TSC.2012.7
[8] Strunk, A. (2010). QoS-aware service composition: A Survey. In 2010 IEEE 8th European conference on web services (ECOWS) (pp. 67–74).
[9] Bonatti, P. A., Festa, P. (2005). On optimal service selection. In WWW ’05: 14th interna-tional conference on world wide web (pp. 530– 538)
[10]Ardagna, D., Pernici, B. (2005). Global and local QoS guarantee in web service selection. In BPM Workshops (pp. 32–46)
[11]W. Li, H. Yan-xiang, Web service composition based on qos with chaos particle swarm optimization, in: Wireless Communications Networking and Mobile Computing (WiCOM), 2010 6th International Conference on, 2010, pp. 1-4.
[12]L. Xiangwei, Z. Yin, Web service composition with global constraint based on discrete particle swarm optimization, in: Web Mining and Web-based Application, 2009. Second Pacific-Asia Conference on, 2009, pp. 183-186.
[13]W. Li, H. Yan-xiang, A web service composition algorithm based on global qos optimizing with mocaco, in: Algorithms and Architectures for Parallel Processing, Vol. 6082 of Lec-ture Notes in Computer Science, Springer Berlin Heidelberg, 2010, pp. 218-224. [14]C. Mao, J. Chen, X. Yu, An empirical study on meta-heuristic search-based web service composition, in: e-Business Engineering (ICEBE), 2012 IEEE Ninth International Confer-ence on, 2012, pp. 117-122.
[15]X. Zhao, B. Song, P. Huang, Z. Wen, J. Weng, Y. Fan, An improved discrete immune opti-mization algorithm based on pso for qos-driven web service composition, Applied Soft Computing 12 (8) (2012) 2208-2216.
[16]Parejo, José Antonio, Sergio Segura, Pablo Fernandez, and Antonio Ruiz-Cortés. "QoS-aware web services composition using GRASP with Path Relinking." Expert Systems with Applications 41, no. 9 (2014): 4211-4223.
[17]Sujatha Varadi, G Appa Rao; "Quality of Service Centric Web Service Composition: Assessing Composition Impact Scale towards Fault Proneness"; Vol 14, No 9-C (2014): Global Journal of Computer Science and Technology
[18]V.Sujatha, Dr.G.Appa Rao and T. Tharun; "QoS Discrepancy Impact (qdi) and Cohesion Between Services (cbs): QoS metrics for robust service composition", ICMEET-2015, Department of Electronics and Communication
Engineering, GITAM University,
Visakhapatnam, Andhra Pradesh, India, proceedings in Springer LNEE series
[19]A. Rencher, Methods of Multivariate Analysis, 2nd ed., Wiley, 2002.
[20]M. Borga, “Canonical correlation: a tutorial”, Linkoping University, Linkoping, Sweden,
2001, 12 pages. Available at
http://www.imt.liu.se/∼magnus/cca/tutorial/. [21]A. Hyv¨arinen, J. Karhunen, and E. Oja,
Independent Component Analysis. Wiley, 2001 [22]S. Haykin, Modern Filters. MacMillan, 1989. [23]