AUTOMATIC SEGMENTATION AND CLASSIFICATION OF
HARD EXUDATES TO DETECT MACULAR EDEMA IN
FUNDUS IMAGES
1S.VASANTHI, 2Dr.R.S.D WAHIDA BANU
1
Associate Professor, Department of Electronics and Communication Engineering, K.S.Rangasamy College of Technology, Tiruchengode, Tamilnadu, India
2
Principal, Government College of Engineering, Salem, Tamilnadu, India E-mail: [email protected], [email protected]
ABSTRACT
Detection of the presence of hard exudates in fundus images of diabetic patients is very important. If hard exudates are present in the macular region of retina, it will lead to Diabetic macular edema. Diabetic Macular Edema disease leads to vision loss problem in Diabetic patients. Early detection of Macular Edema in diabetic patients paves a path for prevention from blindness. Diabetic Macular Edema (DME) occurs when blood vessels in the retina of patients with diabetes begin to leak into the macula region of eye. These leakages cause the macula to thicken and swell, progressively leads to vision loss. The automatic detection of Diabetic Macular Edema and classification of DME severity is done in this paper. The Hard Exudates (HE) presence in macula region is detected and the features are extracted. The extracted features are fed as input to Adaptive Neuro Fuzzy Inference System (ANFIS) and Extreme Learning Machine (ELM) classifier to classify the images as normal and abnormal. ANFIS and ELM classifiers performances are evaluated in terms of the parameters such as Sensitivity, Specificity and Accuracy whose values are 100%, 90% and 96.49% for ANFIS classifier and 94.28%, 100% and 96.49% for ELM classifier respectively.
Keywords: Diabetic Macular Edema, ELM classifier, Hard Exudates, Features, Severity level
1. INTRODUCTION
In recent years, diabetes has become common disease in the world. Diabetes affects the retina of the eye and leads to Diabetic Retinopathy, which cause blindness. Diabetic Macular Edema comes under Diabetic Retinopathy category. Diabetic Retinopathy (DR) is a disease that causes damage to the retina of human eye, which is caused by complications of diabetes. DR is one of the main causes of vision loss and its prevalence keeps rising [1]. Hard Exudates (HEs) have been known as the specific marker of DR [2]. It is an important disease which affects nearly 80% of the patients who have diabetes nearly 10 years or more. Statistics shows that at least 90% of the disease is reduced by proper initial treatment and consulting the ophthalmologist at an early stage itself. If a person has diabetes for longer period, the chances of developing diabetic retinopathy are higher.
Diabetic Retinopathy, a frequent diabetic retinal disease is caused due to the blood vessels in the retina get changes from its original shape. At the
center part of the retina there is a very small area called as macula. The macula region is responsible for the pinpoint vision, allowing the human to view or recognize something. The retinal surrounding part is called the peripheral retina, which is responsible for side or peripheral vision. Diabetic Retinopathy generally affects both the human eyes.
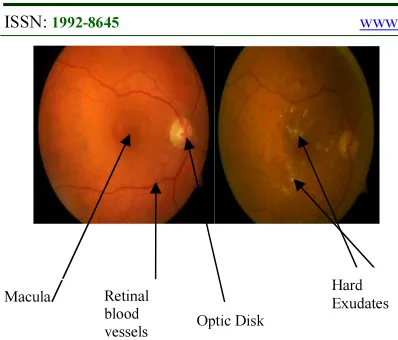
Figure 1 illustrates the normal retina and retina affected by Diabetic Retinopathy which includes the presence of Hard Exudates. Clinical examination can be carried out either manually on examining stereoscopy or Optical Computed Tomography images or by detection of Hard Exudates (HE) in the retinal region of human eye. The severity of the disease is evaluated by the Hard Exudates presence. If HE present near the macula means the severity is moderate and if HE present inside the macula region means the severity is high. At the initial stage of this disease, the ability of vision starts to decrease. At this stage itself patients should consult their problems in vision with the
Figure 1 Normal Retina and DR affected retina
ophthalmologist. Then the ophthalmologist proceeds their screening tests to know the level of severity. Thus, the clinical examination of HEs is essential to the early diagnosis and treatment of DR.
2. RELATED WORK
Macular edema is an advance stage of diabetic retinopathy which affects central vision of diabetes patients. The main cause of edema is the appearance of exudates near or on macular region in human retina. An automated system for early detection of macular edema should identify all possible exudates present on the surface of retina.
A method for the identification of exudates in color retinal images is presented [3] which will help in building a computer aided diagnostic system for macular edema. The proposed system consists of three stages: candidate exudate detection, feature extraction and classification.
Exudates also known as bright lesions, appear as bright spots and patches in fundus image with highest contrast in the green plane of the color image [4]. An automated system for detection of exudates should enhance the contrast of bright regions with smoothing of dark regions. For exudate detection, morphological closing is used to smooth dark regions such as haemorrhages and blood vessels. The objective of contrast enhancement is to improve the contrast of lesions for easy detection [5].
Gabor filter bank is used for detection of all possible bright regions. They are appropriate for texture representation and discrimination [6]. The binary candidate regions for exudates are extracted by applying a low adaptive threshold value T [7]. The regions segmented by thresholding of filter bank based enhanced image also contain OD region
and pixels due to their similarity with exudates. For accurate detection exudates, these false and spurious pixels should be removed before the classification stage. The proposed system locates and segments optic disc using image averaging and Hough transformation respectively.
In another method [8], green component of the RGB image is extracted. Morphological closing operation was performed using an octagon-shaped structuring element of size 9. This results in a good contrast image between the exudates and the background. Column wise neighborhood operation was performed leaving only the exudates and the optical disc.
Thresholding is useful to remove unnecessary details from an image to concentrate on essentials [9]. A novel method to automatically detect HEs in color retinal images is proposed [10]. First extract HEs candidate regions by combining histogram segmentation with morphological reconstruction. The significant features for each candidate region are defined. A supervised support vector machine (SVM) is finally trained based on these features to classify the candidate regions for HEs.
The techniques for HEs detection can be roughly divided into four categories: thresholding-based, region growing-based, morphology-based and classification-based.
Thresholding-based techniques focus on a global or adaptive grey level analysis [11], but the automatic selection of proper threshold is difficult due to the uneven illumination of the image. Region growing-based techniques segment retinal images based on the spatial continuity and illumination homogeneity of the HEs [12] which are computationally expensive. To enhance the computational efficiency, the edge detection is employed to limit the size of regions [13]. Morphology-based techniques apply greyscale morphological operators to remove vessels and then identify HEs effectively [14, 15]. Classification based techniques such as clustering algorithms [16], supervised approaches [17], statistical classification [18] and neural network [19, 20] attempt to extract different features (illumination, color, contrast, size etc.) and then use a classifier to classify HEs.
An automatic system to detect pathologies on the macula such as hard exudates, microaneurysms, and haemorrhages is proposed [21]. This technique starts by eliminating the non-uniform illumination thereby enhancing the contrast of red lesions in the images. Possible DR lesion (hard exudates and red lesions) candidates on the macula are extracted by using Amplitude Modulation Frequency Modulation (AM-FM) features.
Macula Retinal blood vessels
An algorithm for exudates detection is proposed [22] which is based on the combination of active contours obtained for the image after different preprocessing algorithms. In order to classify the candidate regions into Exudate or non- Exudate classes [23], a set of significant features was extracted from each region. It focused on those characteristics that help ophthalmologists to visually distinguish Exudates.
The automated solutions can be categorized as local schemes and global schemes. Local schemes performs localization of HE clusters. Given the relatively high contrast between the HE and retinal structures (except optic disc), the most common approach has been to process green channel of the color fundus image and thresholding (fixed or adaptive/dynamic) the intensity histogram [23]. Background suppression is another approach that has been used for finding HE candidates [24]. Global schemes are used for detecting the presence/absence of HE in images. Features such as visual word/group using a dictionary have been used to represent color fundus images to help classify them as normal or abnormal [25]. The statistical features like area, mean, standard deviation, entropy etc are extracted using the candidate extractor algorithm [26]. Dataset is formed by using these features and various stages of abnormalities are classified.
This paper deals with the automatic detection of DME and classification of DME level using ANFIS and ELM classifier. Methodology of the proposed system is explained in section 3. Simulation results of the proposed system are demonstrated in section 4 and section 5 includes the conclusion of the proposed work.
3. METHODOLOGY
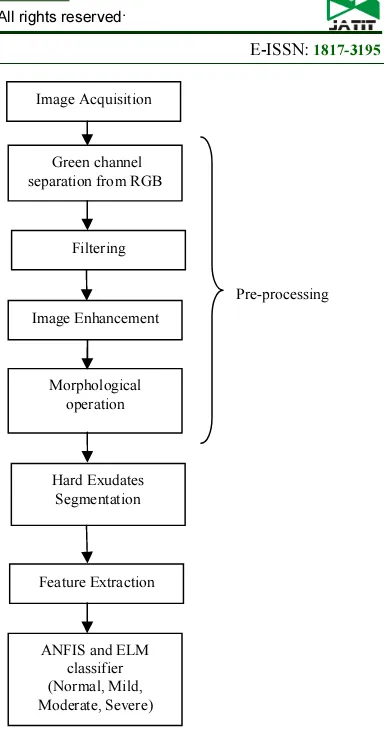
The flowchart of the proposed work is shown in figure 2. In this work, Diabetic Macular Edema (DME) is detected by Hard Exudates (HE) presence. The Hard Exudates portion is segmented and from the segmented portion features are extracted. The extracted features are trained in ANFIS and ELM classifiers. Then the classification of color fundus images as normal, mild, moderate or severe is done by ANFIS and ELM classifiers.
3.1 Image Acquisition and Preprocessing
[image:3.595.317.509.90.455.2]Diabetic Macular Edema is detected by the Hard Exudates presence. In this paper initially the
Figure 2 Flowchart of the proposed method
color fundus images are acquired then preprocessed which includes green channel separation from RGB image, filtering by median filter to remove the presence of noise, image enhancement by row interpolation and column interpolation, then the fundus images are standardized to a size of 576 x 720 and the morphological closing operation is performed. Since the Optic Disk shares the brightness characteristics of HE, it should be masked. To segment the HE portion, OD and HE regions are detected then the regions are segmented and in the segmented image the Optic Disk region is masked.
3.2 Feature Extraction
The features are to be extracted from the color fundus images for classification purpose. Gray level Co-occurence Matrix (GLCM) is created and its parameters are evaluated for classifications which are considered as features. Area of Hard Exudates (HE) is also included as feature. The GLCM parameters are :
Pre-processing Image Acquisition
Image Enhancement
Morphological operation Green channel separation from RGB
Hard Exudates Segmentation
Feature Extraction
ANFIS and ELM classifier (Normal, Mild, Moderate, Severe)
3.2.1 Contrast
It is a measurement of intensity contrast between a pixel and its neighbourhood pixels in the whole image. The range of contrast feature is (0 (size (GLCM, 1) -1) ^ 2). Contrast of an image is found by
( )
i
j
p
j
i
j i
,
|
|
Contrast
,
2
∑
−
=
(1)
3.2.2 Correlation
It is a measure of how a pixel is correlated to its neighbourhood pixel in whole image. Its range is from -1 to +1. Correlation is given by
(
)(
) ( )
∑
−
−
=
ji i j
j
i
p
j
j
i
i
,
,
n
Correlatio
σ
σ
µ
µ
(2)
3.2.3 Energy
It is the sum of squared elements in GLCM. It ranges from 0 to 1. For constant image, energy value is 1. Energy of an image is
( )
2 ,,
Energy
=
∑
j i
j
i
p
(3)3.2.4 Homogeneity
The closeness measurement of the elements distribution in GLCM to GLCM diagonal. It ranges from 0 to 1. For diagonal GLCM Homogeneity value is 1. Expression for homogeneity is given by
( )
∑
−
+
=
j
i
i
i
j
j
i
p
,
|
|
,
y
Homogeneit
(4)
Where,
p(i,j) - intensity value of the pixel that corresponds to ith row and jth column
µ - mean value of the image σ - standard deviation of the image
3.3 Classification
Dataset is formed by using the features such as contrast, correlation, energy, homogeneity and various stages of abnormalities are classified. ANFIS and ELM classifiers are used to classify the retinal images as normal, mild, moderate and severe depending on their severity. Adaptive Neuro Fuzzy Inference System (ANFIS) is one type of neural network which is based on Takagi–Sugeno fuzzy inference system. The FIS is generated using grid partitioning. Inference system of ANFIS corresponds to a set of fuzzy IF–THEN rules. These rules have learning capability to approximate nonlinear functions. ANFIS is an adaptive network. An adaptive network is a network of nodes and directional links. This network is called adaptive because output node is affected by parameters of
some nodes in the network. These networks are also learns the relationship between inputs and outputs. Hybrid learning is used as a optimization method to train the FIS which combines the pattern and batch learning rules. Adaptive Neural Fuzzy Inference System approach learns the rules and membership functions from data. ANFIS structure depends on the training set and testing set.
ELM meant for Single Hidden Layer Feed-Forward Neural Networks (SLFNs) will randomly select the input weights and analytically determines the output weights of SLFNs. This algorithm tends to afford the best generalization performance at extremely fast learning speed. The structure of ELM network contains an input layer, hidden layer and an output layer. In this paper training and testing set are formed from the features like area, contrast, correlation, energy, and homogeneity are given as input to ANFIS and ELM classifier. To train the network, 89 retinal images were taken from the database then the system is loaded with the features such as area, contrast, correlation, energy and homogeneity of these retinal images and classify the images as normal, mild, moderate or severe using ANFIS and ELM classifier.
4. RESULTS
4.1 Input Image
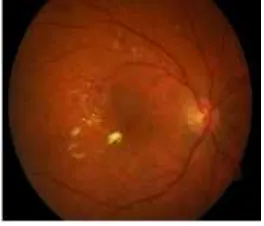
[image:4.595.341.473.525.638.2]The input color fundus image in figure 3 is acquired from the database of 57 retinal images (35 normal and 22 abnormal) and subjected for further classification as normal, mild, moderate or severe cases of Diabetic Macular Edema.
Figure 3 Input Color Fundus Image
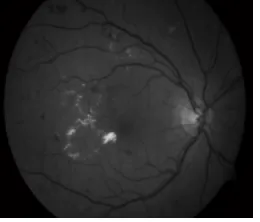
4.2 Green Channel Separation
Figure 4 Green channel separation
4.3 Filtering
The presence of noise in the separated green channel image should be removed. Hence, the green channel image is filtered using Median filter and it is shown in figure 5. The median filter is a non-linear digital filtering technique. It proves to be best in removing salt and pepper noise and impulse noise. Median filter erases black dots called the pepper and fills in white holes in the image, called salt. It better works than mean filter by preserving sharp edges. It simply replaces each pixel value by the median of the intensity level in the neighborhood of that pixel.
Figure 5 Filtered image
4.4 Image Enhancement
Image enhancement involves the development or improvement of the filtered image so that the result is more suitable for subsequent use. Improvements may mean the image is more acceptable for viewing, processing or analysis. This might involve processes, such as improving contrast or brightening an image. The enhanced image is shown in figure 6.
4.5 Morphological Operation
Morphological closing operation is done in enhanced image and the retinal blood vessels are removed which is shown in figure 7. Morphological closing operation is a dilation followed by erosion. It can be used to fill the holes and small gaps.
[image:5.595.340.473.284.400.2]Figure 6 Enhanced image
Figure 7 Image after Morphological operation
4.6 Hard Exudate Segmentation
The classification of DME is done by evaluating the presence of Hard Exudates. For that the Hard Exudates are to be segment out first. The brightness characteristics of OD and Hard Exudates are similar. So OD region should be masked. The segmentation of Hard Exudates includes three steps: first step is detection of OD and Hard Exudates region, second step is segmentation of detected OD and Hard Exudates region and third step is removal of OD region from the segmented image. The segmented Hard Exudates are shown in figure 8.
Figure 8 Hard Exudates Segmentation
4.7 Feature Extraction
[image:5.595.126.256.419.530.2]mild, moderate and severe stages and the sample value of each feature is tabulated in table 1.
Table 1 Feature Values of Input images
Feature Normal Mild Moderate Severe
Area 30 452 2473 3324
Contrast 0.02 0.02 0.02 0.02
Correlation 0.98 0.99 0.98 0.98
Energy 0.35 0.36 0.35 0.33
Homogeneity 0.99 0.99 0.99 0.99
4.8 Classification and Performance Measures
ANFIS and ELM classifiers are finally trained based on the extracted features from the segmented Hard Exudates region of 57 input color fundus images (35 normal and 22 abnormal images) to classify the image as normal, mild, moderate and severe level of DME.
ANFIS and ELM classifiers performances are evaluated in terms of Sensitivity, Specificity and Accuracy in % are as follows:
100
)
(
TP
FN
X
TP
y
Sensitivit
+
=
(5)100
)
(
TN
FP
X
TN
y
Specificit
+
=
(6)100
X
FP
TN
FN
TP
TN
TP
Accuracy
+
+
+
+
=
(7)True Positive (TP) means the normal retinal image is detected as normal. True Negative (TN) means the abnormal retinal image is detected as abnormal. False Positive (FP) means the abnormal image is detected as normal. False Negative (FN) means the normal retinal image is detected as abnormal. Sensitivity is 100%, Specificity is 90% and Accuracy is 96.49% for ANFIS classifier. Sensitivity is 94.28%, Specificity is 100% and Accuracy is 96.49% for ELM classifier.
5. CONCLUSION
The proposed methodology involves DME detection and severity classification in retinal images. The important contribution of this work includes: 1) Significant representation for preprocessing stages and the removal of OD region. 2) Adaptive Neuro Fuzzy Inference System (ANFIS) and Extreme Learning Machine (ELM) classifiers are used for detecting the severity of DME in retinal images. The image characteristics are assessed for the classification of the normal and the severity level of the abnormality in the macular
region of human eye. Finally the classifiers performances are evaluated in terms of sensitivity, specificity and accuracy. The proposed technique helps for automatic detection and abnormality classification of DME in reliable manner.
REFERENCES:
[1] J.A Olson, P.M Strachan, J.H Hipwell, K.A Goatman, K.C McHardy, J.V Forrester, and P.F Sharp, “A comparative evaluation of digital imaging, retinal photography and optometrist examination in screening for diabetic retinopathy”, Diabetic Medicine, Vol. 20, No. 7, 2003, pp. 528-534.
[2] S. Bjorvis, M.A Johansen, and K. Fossen, “An economic analysis of screening for diabetic retinopathy”, Journal of Telemedicine and Telecare, Vol. 8, No. 1, 2002, pp. 32-35. [3] U. Aftab and M. Usman Akram, “Automated
Identification of Exudates for Detection of Macular Edema”, Proceedings of 6th IEEE International Conference on Biomedical Engineering, Cairo, 2012, pp. 27-34.
[4] M. U. Akram, A. Tariq, M. A. Anjum, M. Y. Javed, “Automated Detection of Exudates in Colored Retinal Images for Diagnosis of Diabetic Retinopathy”, OSA Journal of Applied Optics, Vol. 51, No. 20, 2012, pp. 4858- 4866. [5] A. Osareh., B. Shadgar and R. Markham, “A Computational-Intelligence- Based Approach for Detection of Exudates in Diabetic Retinopathy Images”, IEEE Trans on Information Tech in Biomedicine, Vol. 13, No.4, 2009, pp. 535-545.
[6] J. Sung, S. Y. Bang, S. Choi, “A Bayesian Network Classifier and Hierarchical Gabor Features for Handwritten Numeral Recognition”, Pattern Recognition Letters, Vol. 27, No. 1, 2006, pp. 66-75.
[7] R. C. Gonzalez and R. E. Woods, “Digital Image Processing”, Prentice Hall, Second edition, 2002.
[8] Eman M.Shahin, Taha E. Taha, W. Al-Nuaimy, S. El Rabaie, Osama F.Zahran and Fathi E. Abd El-Samie, “Automated detection of Diabetic Retinopathy in Blurred digital fundus images” Proceedings of International Conference on Computer Engineering (ICENCO 2012), Cairo, Egypt, 2012.
[9] A. McAndrew, “Introduction to Digital Image Processing With Matlab”, Course Technology, 1st edition, 2004.
Detection in Color Retinal Images”,
Proceedings of 2012 International Conference on Machine Learning and Cybernetics, Vol. 3, 2012, pp. 1175-1181.
[11]C.I Sanchez, M. Garcia, A. Mayo, M.I Lopez, and R. Homero, “Retinal Image Analysis Based on Mixture Models to Detect Hard Exudates”, Medical Image Analysis, Vol. 13, No. 4, 2009, pp. 650-658.
[12]C. Sinthanayothin, J.F Boyce, T.H Williamson, H. L Cook, E. Mensah, S. Lal, and D. Usher, “Automated Detection of Diabetic Retinopathy on Digital Fundus Images”, Diabetic Medicine, Vol. 19, No. 2, 2002, pp. 105-112.
[13]H. Li and O. Chutatape, “Automated Feature Extraction in Color Retinal Images by a Model Based Approach”, IEEE Transactions on Bio-medical Engineering, Vol. 51, No. 2, 2004, pp. 246-254.
[14]T.Walter, J C Klein, P Massin, and A Erginay, “A Contribution of Image Processing to the Diagnosis of Diabetic Retinopathy-Detection of Exudates in Color Fundus Images of the Human Retina”, IEEE Transactions on Medical Imaging, Vol. 21, No. 10, 2002, pp. 1236-1243.
[15]D. Welfer, 1. Scharcanski, and D.R. Marinho, “A Coarse to Fine Strategy for Automatically Detecting Exudates in Color Eye Fundus Images”, Computerized Medical Imaging and Graphics, Vol. 34, No. 3, 2010, pp. 228-235. [16]W. Hsu, P.M.D.S. Pallawala, M.L Lee, and
K.A Eong, “The Role of Domain Knowledge in the Detection of Retinal Hard Exudates”,
Proceedings of IEEE Conference on Computer Vision and Pattern Recognition, 2001.
[17]M. Niemeijer M, B. Van Ginneken, S.R Russell, M.S SuttorpSchulten, and M.D Abramoff, “Automated Detection and Differentiation of Drusen, Exudates, and Cottonwool Spots in Digital Color Fundus Photographs for Diabetic Retinopathy Diagnosis”, Investigative Ophthalmology and Visual Science, Vol. 48, 2007, pp. 2260–2267. [18]K.G. Goh, W. Hsu, M. Li Lee, and H. Wang,
“ADRIS: An Automatic Diabetic Retinal Image Screening System”, Studies in Fuzziness and Soft Computing, Vol. 60, 200l, pp. 181-210.
[19]M. Garda, C.I Sanchez, M.I. Lopez, D. Abcisolo, and R. Homero, “Neural network based Detection of Hard Exudates in Retinal Images”, Computer Methods and Programs in Biomedicine, Vol. 93, No. 1, 2009, pp. 9-19.
[20]X. Zhang and O. Chutatape, “Top-down and bottomup strategies in Lesion Detection of Background Diabetic Retinopathy”,
Proceedings of IEEE Conference on Computer Vision and Pattern Recognition, Vol. 2, 2005, pp. 422-428.
[21]C. Agurto, H. Yu, V. Murray, M.S. Pattichis, S. Barriga, P. Soliz, “Detection of Hard Exudates and Red lesions in the Macula using Multiscale Approach”, Proceedings of IEEE Southwest Symposium on Image Analysis and Interpretation (SSIAI), 2012.
[22]María Garcia, Carmen Valverde, Maria I. Lopez, Jesus Poza and Roberto Hornero “Comparison of Logistic Regression and Neural Network Classifiers in the Detection of Hard Exudates in Retinal Images”,
Proceedings of 35th Annual International Conference of the IEEE EMBS, 2013, pp. 5891-5894.
[23]K. Sai Deepak and Jayanthi Sivaswamy, “Automatic Assessment of Macular Edema From Color Retinal Images” IEEE Transactions on Medical Imaging, Vol. 31, No.3, 2012, pp. 766-776.
[24]H. Wang, W. Hsu, and M.L Li, “Effective Detection of Retinal Exudates in Fundus Images”, Proceedings of 2nd International Conference on Biomedical Engineering and Informatics, 2009, pp. 1-5.
[25]S. Ravishankar, A. Jain, and A. Mittal, “Automated Feature Extraction for Early Detection of Diabetic Retinopathy In Fundus Images,” Proceedings ofIEEE Conference on Computer Vision and Pattern Recognition, 2009, pp. 210–217.