ISSN: 1992-8645 www.jatit.org E-ISSN: 1817-3195
RESEARCH ON COMPLEX THREE ORDER CUMULANTS’
COUPLING FEATURES IN FAULT DIAGNOSIS
1WANG YUANZHI
1School of Computer and Information, Anqing Normal College, Anqing 246011, China
ABSTRACT
Compared with bispectrum, order cumulants have a lower computing complexity, and complex three-order cumulants formally includes different coupling information of signals, in the experiment, through these different coupling modes, features of fault signals and normal signals are fetched by 2-D wavelet in different directions, then these features are used to diagnose fault. The experiment shows that the method can achieve satisfactory result through different selections in fault diagnosis. Compared with the same dimensions of corresponding complex three-order cumulants as the feature extracted by 2-D wavelet, and the real three-order cumulants obtained by the same signals, the results prove that the method in the experiment is effective.
Keywords: Three-Order Cumulant, Coupling, 2-D Wavelet, Fault Diagnosis
1. INTRUDUCTION
High order cumulants can automatically suppress the Gaussian background noise (colored or white), can establish the non-Gaussian signal model under Gaussian noise, and extract the non-Gaussian signal (including harmonic signal) in the Gaussian noise. Because of these, the statistics of high order cumulants have gained growing attention, and have become a very useful tool in signal processing. Bispectrum produced by third-order cumulant contains the asymmetric and nonlinear information of signal, which can be used to describe the nonlinear phase coupling, especially the quadratic phase coupling, has been widely applied in fault diagnosis [1-3]. Compared with bispectrum,
three-order cumulants have a lower computing
complexity; this paper uses three-order cumulants to diagnose faults directly. W.R.Raghuveer and domestic scholars Wang Shu-xun had made a deep research on high order cumulant coupling features, clearly pointed out the coupling characteristics of different definitions of various complex high order
cumulants [4-6]. Two dimensional wavelet
functions are obtained by one-dimensional wavelet function after its transformation of tensor product. The decomposition of two-dimensional wavelet is to decompose the low frequency component of the J scale into four parts, which are low frequency component of the J+1 scale, and the high frequency parts of three directions (horizontal, vertical, diagonal )[7-8].
On the basis of the above, in this paper, according to the different coupling modes of
three-order cumulants, features are extracted in different direction by using two-dimensional wavelet, and then research on fault diagnosis was made by using these features.
2. HIGH ORDER CUMULANTS
Let{x(n)} be a real,discrete,zero—mean
stationary process with k order cumulants
1 2 1
( , ,...,
)
kx k
c
τ τ τ
−, it is defined as k order joint
cumulant of :
{
x n x n
( ), (
+
τ
1),
. . . ,
x n
(
+
τ
k−1)
}
:{
}
1 2 1
1 2 1
( , ,...,
)
=cum ( ), (
), (
)
(
)
kx k
k
c
x n x n
x n
x n
τ τ τ
τ
τ
τ
−
−
+
+
,
...,
+
(1)
Then the third order cumulant is given by the
expression:
3x
( , )
1 2c
τ τ
=
E x n x n
{
( ) (
+
τ
1) (
x n
+
τ
2)
}
(2) 3. COUPLING CHARACTERIZATION OFTHREE ORDER CUMULANT
According to the literature (6) , in eq. (2), set {x(n)} as complex signals, and give definitions as follows:
Definition 1:
3x
( , )
1 2c
τ τ
ISSN: 1992-8645 www.jatit.org E-ISSN: 1817-3195
Definition 2:
3x
( , )
1 2c
τ τ
=
E x n x n
{
( ) (
τ
1) (
x n
τ
2)
}
∗
+
+
(4)
Definition 3:
3x
( , )
1 2c
τ τ
=
E x n x n
{
( ) (
τ
1) (
x n
τ
2)
}
∗
+
∗+
(5)
Where
x n
( )
∗
is the complex conjugate of x(n
), and the complex signals are obtained by Hilbert
transformation of the collecting original signals. Literature (6) points out that, according to definition 1,the signals can be denoted by complex harmonic form, its three-order cumulant is zero ( just as
Eq.6,where
φ φ φ
3= +
2 1 , harmonic component3
ω
is produced by quadratic phase coupling ofω
1and
ω
2 , andω ω ω
3=
1+
2 ), according todefinition 2, the three order cumulant of x(n) is
given by Eq.7, and in definition 3, is Eq.8.
X (n)=
3
1
exp(
)
i i i
i
A
ω
n
φ
=
+
∑
(6)
C2= 1 2 3 1 1 2 2
2 1 1 2
[exp[ (
)]
exp[ (
)]]
A A A
j
j
ωτ ωτ
ω τ ωτ
+
+
−
(7)C3= 1 2 3 3 1 1 2
3 1 2 2
[exp[ (
)]
exp[ (
)]]
A A A
j
j
ωτ ωτ
ωτ ωτ
−
+
−
(8)From(Eq.7) ,we know that , according to definition 2 , three-order cumulants only contain the
harmonic signals
ω
1andω
2,which participate incoupling; and according to definition 3, its three
order cumulant contains harmonic signals
1
ω
andω
2 are participated in coupling, and alsocontain the signal
ω
3 which is produced aftercoupling.
4. 2-D WAVELET MULTI-SCALE
ECOMPOSITION
Wavelet transformation is a kind of time_scale analysis method, it has the characteristics of multi-resolution, and it has the ability of characterizing local
features of signal in time and frequency domain. It is time-frequency local analysis method, in this method, its window size fixed but its shape changeable, and its time and frequency windows are both variable. Two dimensional wavelet functions are obtained by one dimensional wavelet function after its tensor transformation. The decomposition of the two dimensional wavelet functions is to decompose the low frequency of the scale j into four parts: low frequency component of the scale j+1 and the high frequency component of three directions (horizontal, vertical, diagonal).
Let original two-dimensional array has (N × N) elements, scale parameter j=0. The recursive decomposition begins from the original two-dimensional array. In the j decomposition, wavelet
coefficient matrix
a
j ,1 j
d
, 2 jd
, 3 jd
has(
2
−j N) 2 elements respectively (resolutionreduces
2
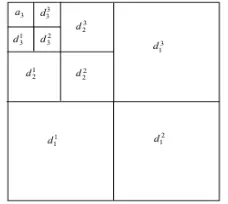
−j ), due to the factor j denotes the [image:2.612.370.484.428.530.2]decomposition progression, which has relation with the resolution of two dimensional array, therefore j is often referred to resolution or decomposition scale. A two-dimensional array of three-level wavelet decomposition is set as an example. The distribution of wavelet coefficients is shown in Figure 1.
Fig. 1 Distribution Of Wavelet Coefficients
5. DATA COLLECTING
When the oil inlet and outlet of pressure reducing valve have a foreign body, too high or too low pressure both will affect the normal operation of pressure reducing valve. In order to obtain the vibration signals of pressure reducing valve in the fault state, in this paper, artificial fault was set in the experiment:
ISSN: 1992-8645 www.jatit.org E-ISSN: 1817-3195 The fault state of the pressure reducing valve can
be simulated through the experiment.
Lab view software, PCI-6014 data acquisition card and acceleration sensor were used, and the vibration signals of the pressure reducing valve in normal and fault state were collected. During each measurement, the oil pressure is 1MPa~5MPa, divided into 5 pressure levels. The sampling frequency is 250Hz and the reading frequency is 125Hz ,the sampling time is about 2min. 18 sets of datum, in this experiment, were respectively collected in normal state and fault state, and 36 sets of data were obtained in total. 1536 data are used in this experiment.
6. FIGURES OF THREE ORDER
CUMULANTS
In this experiment 36 groups of datum in the normal state and fault state were used, and then according to the 3 definitions above, calculated the three order cumulant of each group of datum. In this paper, complex three-order cumulants in normal state and fault state were selected to show in
Figs.2-7. Set -127<=
τ
1,τ
2 <=127, when the oilpressure is 1MPa, 3MPa,5MPa respectively, in definition 3, 1 group datum’s three-order cumulants in two states is selected respectively, shown in figure 2 and figure 4. In figures, x axis and y axis denotes the data number, and z axis denotes the normalized amplitude, dimensionless. Figure 2 and figure 4 shows, compared with that in the normal state, the peaks distribution of three order cumulant in the fault state are sparser than that in the normal state.
Fig. 2 Complex Three Order Cumulants Of Definition 3 In Normal State
Fig. 3 Features Of Three Order Cumulants Of Definition 3 In Diagonal Direction In Normal State
Fig. 4 Complex Three Order Cumulants Of Definition 3 In Fault State
7. FEATURES FETCHING
In this paper, on the recognition of the fault, if directly using the data of three order cumulant obtained to input into a neural network, first, a computational complexity is too large; and second, diagnosis result obtained from the experiment is not
ISSN: 1992-8645 www.jatit.org E-ISSN: 1817-3195 is used for feature extraction. Dbl wavelet is used
here. Through the experimental comparative
analysis, after the two-dimensional wavelet
decomposition of third order cumulants, when scale is 6 the compression coefficients extracted were input to the LSSVM, and best recognition effects were achieved, and compressed coefficients is 4*4 arrays. In this paper features extraction was made
from the low frequency part and high frequency part in three directions (horizontal, vertical, diagonal). Figure 3 and figure 5 show tithe absolute values fetched in diagonal direction of high frequency part under definition 3. Table 1 shows the feature vectors gained in diagonal direction of high frequency part, including both normal and fault state.
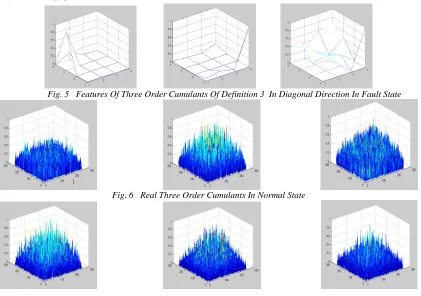
Fig. 5 Features Of Three Order Cumulants Of Definition 3 In Diagonal Direction In Fault State
[image:4.612.101.522.185.481.2]Fig. 6 Real Three Order Cumulants In Normal State
[image:4.612.114.506.519.621.2]
Fig. 7 Real Three Order Cumulants In Fault State
Table 1 Complex Features Of Three Order Cumulants Of Definition 3 In Diagonal Direction
Normal
state
0.2303 0.3309 0.0777 06620 0.4379 0.5280 0.0139 0.3194
0.3131 0.3222 0.3725 0.3740 0.3357 0.0323 0.3156 0.0246
0.2426 0.4528 0.2681 0.4695 0.5328 0.2329 0.5135 0.5177
。。。。。。
Fault
state
0.3236 0.3258 0.3728 0.6658 0.4346 0.0298 0.3191 0.6284
0.1832 0.4721 0.5733 0.5671 0.0350 0.5306 0.0156 0.5230
03644 0.3464 0.2572 0.0669 0.5265 0.4311 0.3144 0.3231
。。。。。。
8. EXPERIMENTAL RESULTS
According to the literature (10), the same LSSVM was established, when training LSSVM, the normal and fault state are respectively encoded as 1 and -1, due to the normal datum and fault datum were respectively obtained from 5 different
ISSN: 1992-8645 www.jatit.org E-ISSN: 1817-3195 26 set of datum after simulation, where the hollow
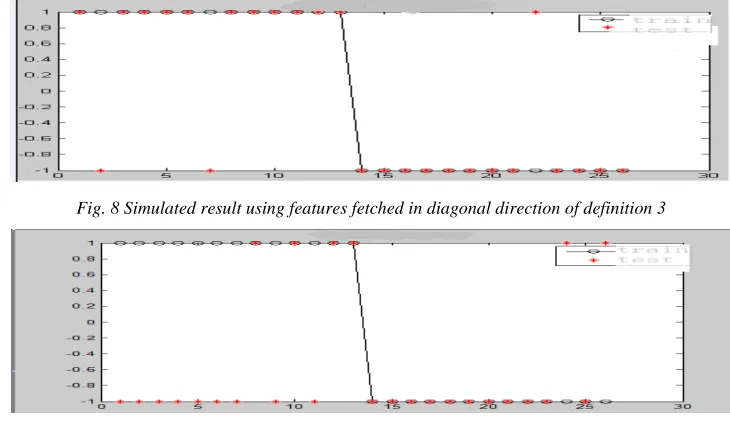
circle denotes the predetermined state of the training data. For example, the fore 13 sets of data were measured in normal state, and they should be stayed on the upper line which indicates the 1 state in the diagram; the behind 13 sets in fault state should be stayed on the lower line which indicates the -1 state, and the red solid circles denote the classification results after the simulation of LSSVM. If hollow circle of one set of data is coincident with the red solid circle, the simulation result of this set of data is correct, otherwise error. Figure 8 shows that according to definition 3, the feature vectors which were obtained from the high-frequency part in the diagonal direction were used to identify, and the result shows that in normal state only 2 groups and in fault state only 1 group are error identification, the correct rate is more than
85%. To be easy to compare, the simulation results are shown in table 2, and these results are obtained from 3 different definitions and 4 different directions, and the digital in the table represents the error numbers of
Simulation. To go on further analysis, the three order cumulants of real signals were used to do the same experiment, and the results are shown in table 2 too.
[image:5.612.124.489.305.516.2]Furthermore, according to the above method, when the oil pressure was 1MPa, 3MPa, 5MPa, 1 set of datum’s absolute value of the real three-order cumulant in two states was selected respectively, shown in figure 6 and figure 7. From figure 6 and figure 7, we can find that compared with the normal state, the real three-order cumulants in fault state are more similar overall.
Fig. 8 Simulated result using features fetched in diagonal direction of definition 3
[image:5.612.105.517.545.709.2]Fig. 9 Simulated result using 16 dimensions features in diagonal direction of definition 3
Table 2 Error numbers of simulated results of various definitions
Directions of features fetching
Kinds of definition
Low frequency
High frequency
Horizontal Vertical Diagonal
Definition 1 8 7 7 5
Definition 2 8 8 7 7
Definition 3 9 6 6 4
ISSN: 1992-8645 www.jatit.org E-ISSN: 1817-3195 9. ANALYSIS OF RESULTS
As mentioned above, under 3 different coupling modes, the two-dimensional wavelet method was adopted to extract features from 4 directions, and use the extracted features to diagnose fault. The results show, because three-order cumulants under
different coupling modes contain different
frequencies information, and features were
extracted from 4 different directions, so, when using these different frequencies information extracted for fault diagnosis, the correct rates were not the same. The experimental result shows that under the definition 3, and features extracted in diagonal direction, the correct rate obtained is highest. Meanwhile, to prove the necessity of the method applied in this paper, assuming
-1<=
τ
1 ,τ
2 <=2, and calculated the three-ordercumulants of each set of datum collected, 16 dimensional array also, equal to the number compressed by 2-D wavelet mentioned above, then these cumulants were used as features to diagnose fault, the result is shown in figure 9. As can be seen from the figure, the result is not ideal. So in this
paper, first assuming -127<=
τ
1,τ
2 <=127 andcalculated three-order cumulants, then fetch features by 2-D wavelet compression, the result of fault diagnosis is better than that of the same number as the fetched features, obtained by the
three-order cumulants when
τ
1,τ
2 are small, it alsoshows that when
τ
1,τ
2 in three-order cumulantsare too small, the signal frequencies information cumulant contains is incomplete. At the end of the experiment, the AR parameters of the same sets of datum in accordance with literature 9, the AR power spectrum and the real bispectrum diagonal slice, by the method of literature 10, were used for fault diagnosis; the correct rates are all less than 70%, which further illustrates the effectiveness of the method. In this paper, other fault datum was collected for the same experiment, and similar results were also obtained.
10. CONCLUSIONS
Although the reasons of different mechanical faults produced are not the same, each fault has the most essential difference with that in normal state. For example, the fault in this paper is caused by adding an iron core to the pressure relief valve in the normal state, and this kind of essential difference possibly makes the distinction biggest,
and the distinction is referred to one kind of signals’ expression form between fault state and normal state. In this paper, according to different definitions of complex three-order cumulants and features extracted by two-dimensional wavelet in different directions were used to find the best diagnostic result, and success was achieved in a certain degree.
ACKNOWLEDGMENT
The work is supported by the Natural Science Key project of Anhui province Education
Department of China under Grant
Nos.KJ2008A18ZC, KJ2010A232
REFERENCES
[1] Cai Qizhi, Huang Yijian Study on
aut0regressiVe trispectrum slices. Chinese Jouma1 of Scientific Instrument 2009, 30(02).
[2] Baydar N.Ball A.A comparative study of
acoustic and vibration signals in detection of
gear failures using Wigner—Ville distributions
.Mechanical Systems and Signal Processing.
(2001 ) 15(6).1091—1 107.
[3] Zhao Z.L., Liu B., Li W, Image Clustering Based on Extreme K-means Algorithm, IEIT Journal of Adaptive & Dynamic Computing, 2012(1), Jan 2012, pp:12-16. DOI=10.5813/www.ieit-web.org/IJADC/2012.1.
[4] Hinich Melvin J. Higher-order cumulants and cumulants spectra[J]. Circuits Systems and Signal Processingn, 1994, 13(4): 391-420. [5] M.R.Raughveer. IEEE Trans. Time-domain
approaches to quadratic phase coupling
estimation Automatic Control. 1990. AC 35: 48-56
[6] Zhang Yan, Wang Shuxun. The slice spectra approach to nonlinear phase coupling analysis. Acta Electronic Sinica, 1998, 26(10):104-109. [7] Zhao Z.L., Liu B., Li W, Image Classification
Based on Extreme Learning Machine , IEIT Journal of Adaptive & Dynamic Computing,
2012(1), Jan 2012, pp:5-11.
DOI=10.5813/www.ieit-web.org/IJADC/2012.1.2
[8] MALLAT S A wavelet tour of signal processing
[M],3rd ed.The Sparse W ay:Academic
Press,2008.
ISSN: 1992-8645 www.jatit.org E-ISSN: 1817-3195
valve’s fault diagnosis. Manufacturing
Technology & Machine Tool,2011(12)