A Prominent Analysis on Head Phantom Image using
Correlation Coefficient
Omveer
*, Vinith Chauhan
***
Information Technology Research Academy, Department of Electronics and Information Technology, Govt. of India **
Electronics and Communication Department, St. Margaret Engineering College, Neemrana, Rajasthan, India
Abstract- 2D projections of the real 3D space are the only available information in the imaging technics like in X- Ray and MRI. In this paper we study projections of images as generated by Radon transformation. We implemented an image reconstruction algorithm which receives different projections of the original image as input. We performed this experiment using artificially created image in order to test and verify the algorithm. The quality of images reconstructed by an algorithm is most prominent to check. So in this paper, we performed analysis on head phantom MRI image by calculating correlation coefficient, Cutoff rotation angle for an image and linearity of correlation coefficient.
Index Terms- Image processing, Radon Transform, Image Reconstruction, correlation Coefficient
I. INTRODUCTION
he determination of the 3D structure of macromolecules is an important field of interest for biology. Nowadays, two methods dominate this determination: X-ray crystallography and Magnetic Resonance Imaging (MRI) spectroscopy. They have the ability to produce a detailed picture of the 3D structure of biological macromolecules at atomic resolution [1,2]. We focus on the MRI approach.
MRI is a spectroscopic technique that reveals information about the environment of magnetically active nuclei. An external magnetic field is used to align them and this alignment is perturbed by an electromagnetic field.
Up to 2003, the number of 3D structures of macromolecules that has been deposited in the Protein Data Bank (PDB) [4] was greater than 3150. MRI is also very useful in Structural genomics. Many efforts are being made in this filed to supplement the knowledge on the sequence of proteins by structural information on a genome-wide scale, determined either experimentally or by theoretical homology modelling [2]. For many years, MRI has been dominated virtually exclusively by the Fourier Transformation (FT) [3,6]. FT gives a simple graphical picture of correlations among different molecular sites within a molecule. But as the spectra is getting more complex due to more intense magnetic fields, extension to three or even four dimensions is needed to resolve ambiguities. This result to an increase to the amount of data acquired and the required processing time [7].
Fig.1 illustrates a typical 2D parallel projection. We need to determine the position and quantity of white matter in brain
sample image. If we were able to look at the spectrum from different angles we could get this information.
Currently the only available information are projections of the spectrum from different angles. Using that 2D information, we try to reconstruct the correct 3D image [8]. This image reconstruction approach, using different projections and angles of views, is very popular in many fields such as x-ray scanning, tomography and determination of protein structure. If only two projections are used some resonances might be cut off by others. Thus, more projections may be required depending on the problem under study.
Figure 1: Example of a typical parallel projection
In this paper we present an image reconstruction algorithm introduced by E. Kupce and R. Freeman [18]. Inputs of the algorithm are 1D projection. They are acquired using the Radon transformation. The algorithm was implemented and verified on artificial image shown in figure 2. The correlation coefficient was chosen as a measurement for the resemblance between the reconstructed image and the original one.
The rest of this paper is organized as follows: Section II presents a mathematical background of Radon transformation and the reconstruction algorithm. In section III, the acquired results are illustrated. Finally, we discuss about future work and conclude our paper in section IV.
II. METHODS A. The Radon Transformation
The 2D Radon transformation is the projection of the image intensity along a radial line oriented at a specific angle as shown in fig. 1. Radon expresses the fact that reconstructing an image, using projections obtained by rotational scanning is feasible. His theorem is the following: The value of a 2-D function at an arbitrary point is uniquely obtained by the integrals along the lines of all directions passing the point. The Radon transformation shows the relationship between the 2-D object and its projections [8].
The Radon Transformation is a fundamental tool which is used in various applications such as radar imaging, geophysical imaging, nondestructive testing and medical imaging [9]. Many publication exploit the Radon Transformation. Meneses-Fabian et al. [10] describe a novel technique for obtaining border-enhanced tomographic images of a slice belonging to a phase object. Vítezslav [11] examines fast implementations of the inverse Radon transform for filtered backprojection on computer graphic cards. Sandberg et al. [12] describe a novel algorithm for tomographic reconstruction of 3-D biological data obtained by a transmission electron microscope. Milanfar [13] exploits the shift property of Radon transformation to image processing. Barva et al. [14] present a method for automatic electrode localization in soft tissue from radio-frequency signal, by exploiting a property of the Radon Transform. Challenor et al. [15] generalize the two dimensional Radon transform to three dimensions and use it to study atmospheric and ocean dynamics phenomena.
Figure 3 illustrates several 1D projections from different angles at an image consisting of white spots in the 2D domain. In some of the projections, only partial spot is shown. This reveals the importance of the selection of the “correct” projections for image reconstruction.
Figure 3: Different projections on a head image example.
Suppose a 2-D function
f
(
x
,
y
)
(Fig. 4). Integrating along the line, whose normal vector is in
direction, results in the)
,
(
s
g
function which is the projection of the 2D function)
,
(
x
y
f
on the axiss
of
direction. Whens
is zero, theg
function has the value
g
(
0
,
)
which is obtained by the integration along the line passing the origin of(
x
,
y
)
-coordinate. The points on the line whose normal vector is in
direction and passes the origin of(
x
,
y
)
-coordinate satisfy the equation:
sin
cos
)
2
tan(
x
y
..(i)
x
cos
y
sin
0
..(ii)Figure 4: The Radon Transform computation.
The integration along the line whose normal vector is in
direction and that passes the origin of(
x
,
y
)
-coordinate means the integration off
(
x
,
y
)
only at the points satisfying the previous equation. With the help of the Dirac “function”
, which is zero for every argument except to 0 and its integral is one,g
(
0
,
)
is expressed as:
f
x
y
x
y
dxdy
g
(
0
,
)
(
,
)
(
cos
sin
)
..(iii)
Similarly, the line with normal vector in
direction and distance s from the origin is satisfying the following equation:0 sin ) sin (
cos ) cos
(xs
ys
0
sin
cos
y
s
So the general equation of the Radon transformation is acquired: [8, 9, 13, 14, 16]
f x y x y s dxdy
s
g( ,
) ( , )
( cos
sin
)..(v) The inverse of Radon transform is calculated by the following equation [12] :
d
y
x
s
R
y
x
f
22
,
)
,
(
..(vi) where
R
is the Radon transformation,
is a filter and
x
,
y
x
cos
y
sin
s
..(vii)B. Image Reconstruction Algorithm
Kupce and Freeman [17] presented an image reconstruction algorithm from a limited set of projections. They suggest a method of implementing the inverse Radon transformation. Firstly, they get the projections from different perspectives. Then they expand every 1D projection at right angles, so as to create a 2D map that consists of parallel ridges. The superposition and the comparison of the created 2D projection maps result in the final reconstructed image.
Their technique can be explained by the following example: Suppose the existence of two perpendicular projections of four absorption peaks in each one (Fig. 5). From these two projections, the potential peaks are 16, but not all of them are true cross peaks. If we take into account another projection at a different angle and reapply the lower-value algorithm, we eliminate some potential as being false peaks and we get the image shown in Figure 5.
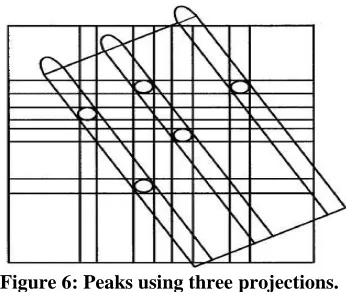
[image:3.612.360.533.56.202.2]Another projection would refine the solution even further. Usually three projections are enough to have an accurate definition of the peaks, but if the original spectrum is complex more projections may be required. Because of the discrete nature of the MRI resonances, the problem converges very rapidly.
Figure 5: Peaks using two projections.
Figure 6: Peaks using three projections.
The algorithm we implemented is based on the previous described algorithm of Kupce and Freeman and its steps are:
Step 1: Acquisition of three different projections.
Step 2: Expansion of the 1D projection in 2D projection maps.
Step 3: Padding (with black) of the 2D projections maps in order not to loose information due to the next step.
Step 4: Rotation of the maps to the correct angle.
Step 5: Reconstruction of the original image by multiplying the maps pixel by pixel.
III. RESULTS
We studied the Radon transformation using Matlab and the Image Processing Toolbox in particular. Initially we created a artificial image and applied the Radon transformation in order to construct the corresponding projections. Fig. 2 presents an example of this image which is used in reconstruction for six different angles: 0, 2, 5, 10, 15, 20 degrees. Even though the image consists of also white spot, in some projections, there seem to be partial spots. This proves the need of several projections in order to verify the correct number of existing spots and their positions.
We implemented the reconstruction algorithm described in section II to reconstruct artificially created image. Six projections were used to reconstruct the original images. The quality of the reconstruction is measured by calculating the absolute value of the 2D correlation coefficient between the original image and the reconstructed one. This gives a value between 0 and 1. As the value increases, so does the resemblance that exists between the original image and the reconstructed one.
[image:3.612.79.254.515.634.2]Image : Reconstructed by projection at 20 degree rotation
Image : Reconstructed by projection at 15 degree rotation
Image : Reconstructed by projection at 10 degree rotation
Image : Reconstructed by projection at 5 degree rotation
Image : Reconstructed by projection at 2 degree rotation
Image : Reconstructed by projection at 1 degree rotation
[image:4.612.354.536.440.539.2]Figure 8: Image Reconstruction using 6 different projections
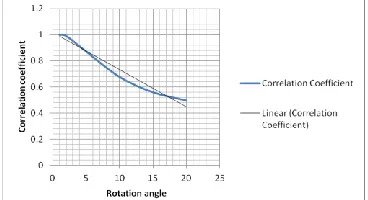
Table 1: Rotation Angle and corresponding Correlation Coefficient.
Rotation anlge Correlation Coefficient
1 1
2 0.992
5 0.8721
10 0.676
15 0.5585
20 0.4946
[image:4.612.353.537.607.707.2]We also noticed that correlation coefficient becomes more linear as it reaches to 1 or we can say that more rotations in projection gives better reconstruction of the images. Which is shown in Figure 9.
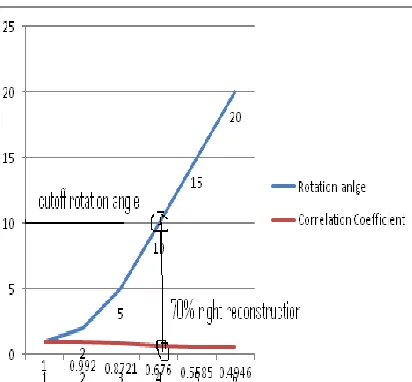
In this paper we tried to define a new term’cutoff rotation angle’ which may be defined as the rotation angle at which almost 70% of reconstructed image resambles to original image. Here in our experiment it is 10 degree.Fig 10 represents this result.
Figure 10: Cut off rotation angle for an image
IV. CONCLUSIONS
To summarize, in this paper we tried to reconstruct an image using projections from different perspectives, which we obtained with the use of the Radon transform. In order to achieve this, we implemented an algorithm, based on the one proposed by Kupce and Freeman [16]. In the presented examples we used six projections of the input image, reaching a correlation coefficient of 1. Future perspectives of the proposed work include the application of the implemented algorithm to real MRI data, the application of more projections for the image reconstruction and the development of heuristics for the determination of optimal projection angles.
ACKONWLEDGMENT
I would like to thank all those magnanimous persons who stood behind me as an inspiration and rendered their full service throughout my research.
REFERENCES
[1] S. Venturas, I. Flaounas “ Study of Radon Transformation and Application of its Inverse to NMR”, Algorithms in Molecular Biology, 4 July 2005.
[2] P. Guntert, “Automated NMR protein structure calculation”, RIKEN Genomic Sciences Center, 1-7-22 Suehiro, Tsurumi, Yokohama 230-0045, Japan, Accepted 23 June 2003.
[3] Thomas Sangild Srensen*, Tobias Schaeffter, Karsten Østergaard Noe, and Michael Schacht Hansen
“Accelerating the Nonequispaced Fast Fourier Transform on Commodity Graphics Hardware” IEEE Transactions On Medical Imaging, Vol. 27, No. 4, April 2008
[4] David S. Goodsell “The Protein Data Bank: Exploring Biomolecular Structure” Department of Molecular Biology, The Scripps Research Institute © 2010 Nature Education
[5] K. Howard, “Improving NMR/MRI”, Princeton Weekly Bulletin, Feb, 2012, http://www.princeton.edu/pr/pwb/98/1123/nmr.htm
[6] W.P. Aue, E. Bartholdi, and R.R. Ernst, J.Chem. Phys. Vol 64, 2229 (1976). [7] E. Kupce, R. Freeman, “Fast Multidimensional NMR Spectroscopy by the Projection – Reconstruction Technique”, Spectroscopy Vol. 19, pp. 16-20, 2004.
[8] A. Asano, “Radon transformation and projection theorem”, Topic 5, Lecture notes of subject Pattern information processing, 2002 Autumn Semester, http://kuva.mis.hiroshima-u.ac.jp/~asano/Kougi/02a/PIP/
[9] A. Averbuch, R.R. Coifman, D.L. Donoho, M. Israeli, J. Wald΄en, Fast Slant Stack: A notion of Radon Transform for Data in a Cartesian Grid which is Rapidly Computible, Algebraically Exact, Geometrically Faithful and Invertible., to appear in SIAM J. Scientific. Computing, 2001
[10] C. Meneses-Fabian, G. Rodr´ýguez-Zurita, and J.F. V´azquez-Castillo “Optical tomography of phase objects with parallel projection differences and ESPI”, Investigacion revista mexicana de fisica 49 (3) 251–257 Junio 2003.
[11] V.V. Vlcek, “Computation of Inverse Radon Transform on Graphics Cards”, 2012 1-12.
[12] K. Sandberg, D. N. Mastronarde, G. Beylkina, “A fast reconstruction algorithm for electron microscope tomography”, Journal of Structural Biology 144 (2003) 61–72, 3 September 2003.
[13] P. Milanfar, “A Model of the Effect of Image Motion in the Radon Transform Domain”, IEEE Transactions on Image processing, vol. 8, no. 9, September 1999
[14] M. Barva and J. Kybic with J. Mari and C. Cachard, “Radial Radon Transform dedicated to Micro-object Localization from Radio Frequency Ultrasound Signal”, In UFFC '04: Proceedings of the IEEE International Ultrasonics, Ferroelectrics and Conference. Piscataway: IEEE, 2004, p. 1836-1839. ISBN 0-7803-8412-1.
[15] P.G. Challenor , P. Cipollini and D. Cromwell, “Use of the 3D Radon Transform to Examine the Properties of Oceanic Rossby Waves”, Journal of Atmospheric and Oceanic Technology, Volume 28, 2012.
[16] E. Kupce, R. Freeman, “The Radon Transform: A New Scheme for Fast Multidimensional MRI”, Concepts in Magnetic Resonance, Wiley Periodicals, Vol. 28, pp. 4-11, 2011
AUTHORS
First Author – Omveer received the B.Tech degree with honors
in Electronics and Communication engineering in 2011 from Rajasthan Technical University, Kota, India. I was with the Raffles University, Neemrana Since 2011 to Jan, 2013.Now, I am Working with Information Technology Research Academy, DIT (GOI) as Junior Technical Officer.
My research interests are in computer vision, robotics, image processing, image synthesis, sensors, and parallel algorithms, and the use of information technology in societal development. My research emphasizes integrated use of multiple image sources of scene information to construct three-dimensional descriptions of scenes.
Email: [email protected]
Second Author – Sh. Vinith Chauhan received the M.Tech from
Institution of Electronics and Telecommunication Engineering, Delhi, and Computer Society of India.