STUDY OF LIGHTNING GROUND FLASHES INTERACTION
WITH RAILWAY LINES
ALI AHMED ALI SALEM
STUDY OF LIGHTNING GROUND FLASHES INTERACTION WITH RAILWAY LINES
ALI AHMED ALI SALEM
This project report presented in partial fulfillment of the requirements for the award of the
Degree of Master of Electrical Engineering
Faculty of Electrical and Electronic Engineering Universiti Tun Hussein Onn Malaysia
Special dedication
I dedicate this work to my beloved mother, father,wife,brother and son.
ACKNOWLEDGEMENT
All praises is to ALLAH Subhanahu wa ta’ala for bestowing me with health, opportunity, patience, and knowledge to complete this research. May the peace and blessings of ALLAH Subhanahu wa Ta’aala be upon Prophet Muhammad (Sallallahu alayhi wa sallam).
My profound gratitude goes to my supervisor Prof. Dr.Hussein Bin Ahmed , for his invaluable guidance, excellent supervision, continuous encouragement and constant support in making this research possible. His cooperation, tolerance, constructive criticism and useful suggestions have been of immense encouragement to me and enabled me to develop a deeper understanding of this research. I sincerely thank him for the time spent in proofreading and correcting my mistakes.
I am especially indebted to my parents and my brother, who were my first teachers in this world by setting a good example for me about how to live, study, work and for their love, sacrifices, and support. I also acknowledge with thanks and humility my wife and daughter who have remained my anchor in terms of love, support, encouragement and prayers. I will forever remain grateful to them.
Finally, I extend my gratitude to all those who were directly or indirectly involved by either encouraging, praying and offering constructive advice in this project work.
ABSTRACT
ABSTRAK
TABLE OF CONTENTS
CONTENTS PAGE
TITLE
APPROVAL i
DECLARATION ii
ACKNOWLEDGEMENT iii
ABSTRACT iv
ABSTRAK v
TABLE OF CONTENTS vi
LIST OF FIGURES x
LIST OF TABLES xvi
LIST OF SYMBOLS AND ABBREVIATIONS xix
CHAPTER 1 INTRODUCTION 1
1.1 Project background 1
1.2 Problem statements 2
1.3 Project objectives 2
1.4 Project scopes 3
1.5 Thesis outline 3
CHAPTER 2 LITERATURE REVIEW 4 2.1 Introduction 4
2.2 Mechanism of Lightning to railway 5
2.3 Effects of Lightning Discharges in the railway 6
2.3.1 Direct strokes 7
2.3.2 Indirect effects. 7
2.4.1 Lightning Surge parameters of the rail 8
2.4.2 Surge attenuation ratio in the rail 8
2.9.3 Electric circuit for the railway 9
2.5 Kluang double -track railway system 9
2.6 Modeling Indirect Lightning Strikes for Railway Systems 11 With Lumped Components 11
2.6.1 Induced voltages across lumped devices along the track System in railway and transmissions lines. 11
2.6.2 The Electrified Railway System. 14
2.7 Pole insulator flashover and ionization at the pole footing. 16
2.7.1. Interconnection between the conductors 16
2.7.2. Pole insulator flashover and soil ionization at the pole footing. 16 2.8 Waves on Railway Lines. 18
2.8.1 Reflection and Refraction of Travelling Waves (bewley lattice diagram) 20 2.8.2 Propagation the waves in bewley lattice diagram method. 21
2.9 Lightning risk evaluation for railway signalling systems 22
2.10 Devices along Electrified Railway Systems. 24
2.10.1 Trackside Transformers. 24
2.10.2 Track Circuit. 25
2.10.3 The effect in interlocking relay railroad crossing work 26
CHAPTER 3 METHODOLOGY 29 3.1 Introduction 29
3.2 Flow chart of project 30
3.3 Lightning parameters and equivalent attractive area in kluang 31 train station. 3.4 Railway study Overview. 32
3.5 Railway model. 32
3.6 Analysis of the lightning stroke to railway tracks. 33
3.6.4 Simultaneous and multiple Indirect lightning strike 35
3.6.5 Indirect multiple lightning strike in the different time 37
3.7 Measurement kluang railway tracks. 37
3.8 Calculation voltages and currents values in kluang railway tracks. 38
3.9 Simulink Of the interaction of lightning strike to railway tracks. 40
3.10 Graphic User Interface Simulation For direct and indirect lightning strike with railway according to bweley lattice diagram. 41
3.11 Study Voltages Waves in Railway by GUI. 42
3.12 Laboratory tests of induced overvoltage at railway tracks. 43
3.12.1 Railway tracks model and resistor voltage divider. 43 3.12.2 Laboratory tests of induced overvoltage in railway track for AC voltage. 45 3.12.3 Laboratory tests of induced overvoltage in railway track for a lightning impulse voltage. 45 3.12.4 Calculation of overvoltage values. 47 CHAPTER 4 RESULTS AND ANALYSIS 49 4.1 Introduction 49
4.2 Generation Voltage and Current Impulses. 50
4.3 Results Simulink Interaction Lightning With Railway System (direct stroke). 51
4.3.1 results the voltages and currents when intraction Single Lightning Strike In Railway. 51
4.3.1.1 Overvoltages at railway track S with SRG and SG strike. 51
4.3.1.2 The overvoltages at raialway track R when SRG strike. 52 4.3.1.3 Overvoltage at railway track R where SG strike. 54 4.3.1.4 The overcurrent waves at railway track -S. 55 4.3.1.5 The overcurrents waves at railway track R where SG strike. 56 4.3.1.6 Overcurrent waves at railway track R where SRG strike. 57 4.3.2 Multiple Lightning strike to the railway track for the simultaneous case. 58
4.3.2.2 Overcurrent waves at railway track S . 60 4.3.2.3 Overvoltage wave at railway track R where
SG strike of multiple srike.
61
4.3.2.4 Overurrent wave at railway track R where SG strike -multiple.
62
4.3.2.5 Overvoltage and overcurrent wave at railway track R where SRG strike –multiple strikes.
63
4.3.3 Multiple Lightning Strike at Railway track R at the different time of occurrenc.
65
4.4 Results Simulink Interaction Lightning With Railway System
(indirect stroke). 66 4.4.1 The Overvoltages and overcurrents waves for a single
strike at railway track- S and railway track R.
66
4.4.2 The overvoltage and overcurrent waves for multiple strikes occure simultaneously.
69
4.4.3 Overvoltage and overcurrent waves for amultiple strikes in the different time.
71
4.5 Results of voltage impulses using graphic user interface. 72 4.6 Results of the value peak voltages and current for four point
using graphic user interface based to Bewley Lattice diagram.
73
. 4.7 Results of the Travelling waves for Lightning strike at railway track.
75
4.8 Result voltages at MTLs in railway system. 76 4.9 Result of Laboratory tests of induced overvoltage
at railway track for AC voltage. 77
4.10 Result of Laboratory tests of induced overvoltage
at railway tracks for lightning impulse voltage. 79 4.11 Comparison result of voltage at railway track in laboratory
test with simulation. 81
CHAPTER 5 83
5.1 Conclusion 83
5.2 Future work 84
RRERENCES
LIST OF FIGURES
Figure Page
2.1 Induced charges on railway 5
2.2 Categories of Lightning discharges 6
2.3 Railway track joint. 7
2.4 Profile of the railway track 8
2.5 Outline of measuring surge parameters of railway track 8 2.6 Railway tracks electric model propagation of surges 9
2.7 Railway tracks in Kluang station 10
2.8 Schematic of double-track railway system (axes are in metres). 10 2.9 MTL system representative of a typical railway traction
conductor feeding system 12
2.10 Railway track showing the complexity of MTLs 13
2.11 Railway track showing of MTLs in Malaysia 13
2.12 Schematic of single-track railway system (axes are in meters) 14 2.13 Ericsson BV-ECLALPLE 1S1.2 + 28P 0.9 cable, a typical
communication cable used in the railway systems 16
2.14 Interconnection between R5, R6 and R1 17
2.15 Insulators, connections and pole footing resistance in a single
track railway system 18
2.16 Travelling wave in railway Line model 18
2.17 Bewley Lattice diagram that illustrates the injected voltage
traveling back and forth in railway line 21
2.18 Bewley Lattice diagram for one section in railway line 22 2.19 Evaluation flow of lightning risk for railway signalling systems 23
2.21 Transformer connections in AT feeding systems 25 2.22 A typical track circuit configuration used in railway system 26 2.23 The JRK 10470 and BML 301053, a typical relay unit used in the
railway systems respectively. Adopted from 27
2.24 GRS Type-K interlocking relay 27
2.25 Cross railway with road in the Kluang 28
2.26 light signal closed When the train far from the road 28 2.27 light signal open. When the train near from the road (before cross
the road) 28
3.1 Flow chart of project. 30
3.2 A pictorial view of a section at Kluang railway track 31
3.4 System study overview. 32
3.5 Railway track Stricture 32
3.6 Railway track electric model 33
3.7 System study overview direct strike (∆t = 0) 33 3.8 Model railway in the direct strike 33
3.9 Single lightning strike to railway track 34
3.10 (a) Voltage waveforms on terminal “Rail (S). (b) Voltage
waveforms on “Rail (R) 34
3.11 System study overview direct strike (∆t ≠ 0) 34 3.12 System study overview indirect strike (∆t = 0) 35 3.13 Model of railway tracks subjected to indirect strikes 35 3.14 3-D representation of a lightning location strike the ground 50m
away from the test object railway tracks 36
3.15 System study overview indirect strike (∆t ≠ 0) 37
3.16 Measurement of R and L based on per meter 37
3.17 Measurement of C1 and C2 37
3.18 Tracks at the Kluang railway station 38
3.19 Three tracks with two tracks junction 39
3.20 Simulink circuit of lightning strike at railway tracks 41
3.21 GUI lightning strike at railway 42
3.22 The example railway tracks systems 42
3.23 Calculation of 4 railway tracks using GUI 43
3.25 Resistor voltage divider 44
3.26 Connection of resistor voltage divider 44
3.27 Laboratory testing of induced overvoltage with single-stage AC
Voltage 45
3.28 Experimental setup for Generation of Lightning Impulse
Voltages 46
3.29 Schematic diagram of the lightning impulse voltages
component 46
3.30 Schematic diagram of laboratory tests for lightning impulse
voltage 47
3.31 Schematic diagram of railway track test circuit for AC voltage 47 3.32 Schematic diagram of railway track test circuit for lightning
impulse voltage 48
4.1 Voltage wave 50
4.2 Current wave 50
4.3 Overvoltage wave at point 1 at railway track S where SG strike
(V1) 51
4.4 Overvoltage wave at point 3 at railway track S where SG strike
(V3) 52
4.5 Overvoltage wave at point 7 at railway track S where SG strike
(V7) 52
4.6 Overvoltage wave at point 1 at railway track R where SRG
strike (V1’) 53
4.7 Overvoltage wave at point 3 in railway track R where SRG
strike (V3’) 53
4.8 Overvoltage wave at point 7 at railway track where SRG strike
(V7’) 53
4.9 Overvoltage wave at point 1 at railway track R where SG strike 54 4.10 Overvoltage waveform at point 3 at railway track R where SG
strike 54
4.11 Overvoltage waveform at point 7 at railway track R where SG
strike 55
4.14 Overcurrent wave at point 7 at railway track S (I7) 56 4.15 Overcurrent wave at point 1 at railway track R where SG strike
(I1’) 57
4.16 Overcurrent wave at point 7 at railway track R where SG strike
(I7’) 57
4.17 Overcurrent wave at point 1 at railway track R where SRG
strike 58
4.18 Overcurrent wave at point 7 at railway track R where SRG
strike 58
4.19 Overvoltage wave at point 1 at railway track S of multiple
strike 59
4.20 Overvoltage wave at point 3 at railway track S of multiple
strike 59
4.21 Overvoltage wave at point 7 at railway track S of multiple
strike 59
4.22 Overcurrent waves at points 1, 3 and 7 at railway track S of
multiple strike (I1, I3 and I7) 60
4.23 Overvoltage wave at point 1 at railway track R where SG strike
of a multiple strike (V1’) 61
4.24 Overvoltage wave at point 3 at railway track R where SG strike
of a multiple (V3’) 61
4.25 Overvoltage wave at point 7 at railway track R where SG strike
of a multiple strike (V7’) 62
4.26 Overcurrent waves at point 1, 3 and 7 at railway track R with
SG strike of multiple strike (I1, I3 and I7’) 62 4.27 Overvoltage wave at point 1 at railway track R where SRG
strike of a multiple strike (V1’’) 63
4.28 Overvoltage wave at point 3 at railway track R where SRG
strike of a multiple strike (V3’’) 63
4.29 Overvoltage wave at point 7at railway track R where SRG
strike of a multiple strike (V7’’) 64
4.30 Over currents waves at points 1, 3 and 7 at railway track R
4.31 Overvoltage waves at points 1, 3 and 7 at railway track of a
multiple strike (V1, V3 and V7) 65
4.32 Overcurrent waves at points 1, 3 and 7 at railway track of a
multiple strike (I1, I3 and I7) 66
4.33 Overvoltage waves at points 3, 6 and 8 at railway track for a
single strike (V3, V6 and V8) 67
4.34 Overcurrent waves at points 3, 6 and 8 at railway track for a
single strike (I3, I6 and I8) 67
4.35 Overvoltage waves at points 3, 6 and 8 at railway track R for a
single strike (V3’, V6’ and V8’) 68
4.36 Overcurrent waves at points 3, 6 and 8 at railway track for a
single strike (I3’, I6’ and I8’) 69
4.37 Overvoltage waves at points 2, 4’ and 6 at railway tracks for a
multiple strikes (V2, V4’and V6). 70
4.38 Overcurrent waves at points 2, 4’ and 6 at railway tracks for a
multiple strikes (I2, I4’and I6 70
4.39 Overvoltage waves at points 2, 4’ and 6 at railway tracks for a
multiple strikes (V2, V4’and V6) 71
4.40 Overcurrent waves at points 2, 4’ and 6 at railway tracks for a
multiple strikes (I2, I4’and I6) 72
4.41 Overvoltage impulse when ΔT=1 when time frame is 2T 72 4.42 Overvoltage impulse when ΔT=2 and time frame is 4T 73 4.43 Voltage impulse when ΔT=3 and time frame is 6T 73 4.44 Peak voltages for 4 points using Bweley Lattice diagram 73 4.45 Peak voltages for 4 points using Bweley Lattice diagram 74 4.46 Waves of the voltages at end sending and receiving for a single
strike for one railway track using Bweley Lattice diagram 74 4.47 Wave of the voltages at end sending for a multiple strike at one
railway track using Bweley Lattice diagram 74
4.48 Transmitted waves at junction A 75
4.49 Transmitted waves at junction B 75
4.50 Transmitted waves at junction C 76
4.51 Transmitted waves at junction D 76
4.53 Oscilloscope reading for AC voltage test 79 4.54 Output railway track overvoltage impulse for 1 µs 80 4.55 Output railway track overvoltage impulse for 10 µs 80 4.56 Input railway track overvoltage impulse for 5 µs 80 4.57 Input railway track overvoltage impulse for 1 µs 81 4.58 Laboratory tests of induced overvoltage at railway track for
lightning impulse voltage connection 81
LIST OF TABLES
Table Page
2.1 Conductor nomenclature of Kluang tracks 10
2.2 Material properties of MTLs 11
2.3 Base-current parameter values. 12
2.4 Conductor radii and characteristic impedances for Figure 2.16 12
2.5 Conductor nomenclature 14
2.6 Conductor nomenclatures and properties in a typical single-track
electrified railway system 15
2.7 Impulse withstand levels for the insulators 17
3.1 Parameter pertaining location of study 32 3.2 R, L, C1, C2, Z and Y of the Kluang railway tracks 38 3.3 The Reflection coefficient and refraction coefficient in points
along railway tracks 39
3.4 Magnitude of over voltages at various points on the track 40 3.5 Magnitude of overvoltage at the junctions A and B 40
3.6 Parameters of simulink railway model 40
3.7 Parameter of railway tracks systems 42
3.8 Railway tracks model specifications 44
3.9 Single-stage AC Voltage technical Specification 45 4.1 Overvoltage values in tracks S in point 1, 3 and 7 single lightning
directly 52
4.2 Overvoltage values in tracks R in point 1, 3 and 7 single
lightning directly 54
4.3 Overvoltage values in tracks R in point 1, 3 and 7 where SG
4.4 Overcurrent values in tracks S in point 1, 3 and 7 56 4.5 Overcurrent values in tracks R in point 1, 3 and 7 when SG strike 57 4.6 Overcurrent values in tracks R in point 1 and 7 when SRG strike 58 4.7 Overvoltage values in tracks S in point 1, 3 and 7-multiple
strikes 60
4.8 Overcurrent values in tracks S in point 1, 3 and 7-multiple strike 61 4.9 Overvoltage values in tracks S in point 1, 3 and 7-multiple
strikes 62
4.10 Overvoltage values in tracks S in point 1, 3 and 7 63 4.11 Overvoltage values in tracks S in point 1, 3 and 7-multiple
strikes 64
4.12 Overcurrent values in tracks R in point 1, 3 and 7 where SRG
strike 65
4.13 Overvoltage values in tracks R in point 1, 3 and 7-multiple
strikes 66
4.14 Overcurrent values in tracks R in point 1, 3 and 7-multiple strike 66 4.15 Overvoltage values in tracks R in point 3, 6 and 8 –indirect 67 4.16 Overcurrent values in tracks R in point 3, 6 and 8-indirect 68 4.17 Overvoltage values in tracks R in point 3, 6 and 8-indirect 68 4.18 Overcurrent values in tracks R in point 3, 6 and 8 69 4.19 Overvoltage values in tracks S and R in point 2, 4 and 6 69 4.20 Overvoltage values in tracks S and R in point 2, 4 and 6 70 4.21 Overvoltage values in tracks S and R in point 2, 4 and 6 71 4.22 Overcurrent values in tracks S and R in point 2, 4 and 6 72 4.23 Input voltage and current and Oscilloscope reading output
voltage 77
4.24 New overvoltage value that induced in railway track R model for
all the experience 78
4.25 Results of Laboratory tests of induced overvoltage at railway
track for lightning impulse voltage 79
4.26 Percentage output values to input values for lightning impulse
4.27 Induced overvoltage at railway track for lightning impulse
LIST OF SYMBOLS AND ABBREVIATIONS
MLS Multiple lightning stroke
FLF Flash Lightning Flatlands
MV Mega voltage
LF Leader Formation
CC Cloud-to-cloud
BL Ball lightning
GC Ground-to-cloud
E Electrical fields
V Propagation speed
RS Railway System
R Resistance
L IInductance
G Conductance
Γ Propagation constant RLs Railway lines
BTs Booster transformers
ATs Autotransformers
EMI Electromagnetic interferenc
𝜶 Refection Coefficient
𝜷 Transmission Coefficients
A Equivalent Attractive area
b Effective width
Ra Equivalent Attractive distance
BLD Bewley lattice diagram
Y Admittance
SG Railway track S and ground
SRG Railway track S and Railwaytrack R and ground
CHAPTER 1
INTRODUCTION
1.1 Project Background
Lightning is an important meteorological process, it is a dangerous natural phenomenon which causes disturbances in our life, and it has a bad effect on mankind. So a great attention has been taken towards this phenomenon. From railway point of view, these rails should be protected against this phenomenon, where large parts of the railway exposed to lightning. System components can be exposed to lightning-induced overvoltage's; this overvoltage have high magnitude comparing with any voltage level of the distribution network, so flashover is generated causing damage to the equipment when insufficient protection against this phenomenon is used. This directly effects on system reliability for railways. Of all lightning discharges only around 25% of the lightning bolt reaches the ground. Lightning being an intense power source (although of short duration), has the potential to cause significant damage to life and property [1].
effects on modern electronic gadgets, which are susceptible to surge voltages and currents. The effort here is to bring out the salient features of lightning with specific reference to indirect effects. The lightning is the main cause of problems in railway in the world [4] [5].
1.2 Problem Statement
Lightning strikes are atmospheric phenomena which have adverse effects on railway. Lightning strikes damaged rail infrastructure an average of 192 times each year between 2010 and 2013, with each strike leading to 361 minutes of delays. In addition, 58 trains schedules a year were cancelled due to lightning related faults. Predicting the geographical and temporal distribution of the lightning strike densities through modeling can help railway designers to improve the protection of the existing and new railway. When lightning strikes a rail, the high voltage can damage this sensitive electronic signaling equipment. As our signaling system fails safe, when a component is damaged all signals in the area turn red and trains must stop. In order to compare the results of the model simulations to the physical data, characterization is required. The distribution of the lightning strike densities generates patterns which are highly nonlinear and no stationary. Nowadays simulation technique is implemented to improve traditional techniques, where the results can be obtained instantaneously after it analyzes the input data of the railway such as currents (i) and voltages (v). In this project MATLAB SIMULINK is used to simulate railway system and analyze the result.
1.3 Project Objectives
This project proposes the analysis simulation of lightning strike in railway using MATLAB program, the objectives of the work are:
i) To design railway model through direct and indirect lightning strike using MATLAB tools and analyze the step by step the voltage and current curves.
iii) To test of railway track model with a single lightning impulse voltage and AC voltage in the laboratory.
1.4 Project Scope
The project primarily concerned with lightning ground flashes interaction with railway lines .the scope of this project are:
(i) The Malaysian railway transport system will be studied and the case study is based on Kluang railway station.
(ii) Simulation of the lightning-induced surge propagation along the railway lines will be done using Bewley Lattice method of analysis.
(iii) Modeling and simulation analysis study will be also involve with the use of MATLAB software and laboratory test.
(iv) In the project simulation execution ,the flashing lightning strike modes be focused :
a) Single lightning stroke.
b) Multiple lightning stroke (multiplicity level up to 2).
c) Multiple and Simultaneous lightning stroke (multiplicity level up to 2).
(v) In the laboratory test the lightning impulse voltage is more than 2 kV.
1.5 Thesis Outline
CHAPTER 2
LITERATURE REVIEW
2.1 Introduction
animals. The lightning may affect almost every organ system as the current passes through the human body taking the shortest pathways between the contact points. There are 25.9% of lightning strike occurrences for victims who took sheltered under trees or shades, whereas 37% at open space area. Head and neck injury are two common areas which have an effect on the lightning strike victims with 77.78% and 74% respectively. Only 29.63% of the cases presented with ear bleeding [7].United State National Lightning Safety Institution reported that Malaysia has highest lightning activities in the world whilst the average-thunder day level for Malaysia’s capital Kuala Lumpur within 180 - 260 days per annum [8, 9]. The isokeraunic level is approximately 200 thunderstorm days a year. The lightning ground flash density is
2.2 Mechanism of Lightning to railway.
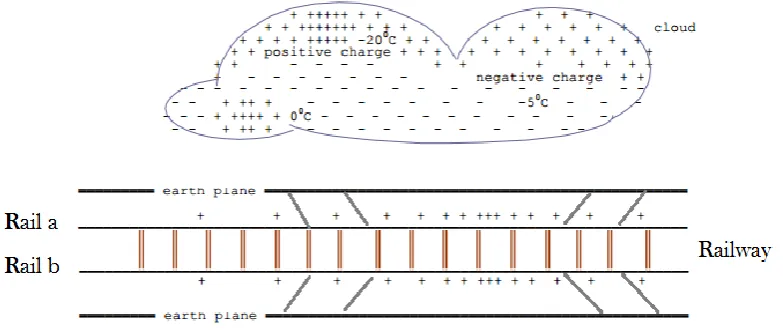
[image:26.595.133.525.511.676.2]Lightning is an electric discharge in the form of a spark or flash originating in a charged cloud. It has now been known for a long time that thunder clouds are charged, and that the negative charge center is located in the lower part of the cloud where the temperature is about - 50 C, and that the main positive charge center is located several kilometers higher up, where the temperature is usually below - 200 C. In the majority of storm clouds, there is also a localized positively charged region near the base of the cloud where the temperature is 00 C. Figure 2.1 shows such a cloud located above an overhead transmission line.
Figure 2.1: Induced charges on railway.
1000 MV. The energy dissipated in a lightning flash is therefore of the order of 1000 to 10,000 MJ, much of which is spent in heating up a narrow air column surrounding the discharge, the temperature rising to about 15,000 0 C in a few tens of microseconds. Vertical separation of the positive and negative charge centres is about 2 - 5 km, and the charges involved are 10 - 30 C [10]. The average current dissipated by lightning is of the order of kilo-amperes. During an average lightning storm, a total of the order of kilo-coulombs of charge would be generated, between the 00 C and the -40 0 C levels, in a volume of about 50 km3 [11].
2.3 Effects of lightning discharges in the railway.
[image:27.595.121.510.548.717.2]The physics of lightning is still a mystery. CG discharges can be quite destructive, particularly when grounded objects are not protected. The number of lightning related deaths in humans is small when compared to other causes of accidents. Livestock on the farms is most susceptible, particularly four legged animals with large spans between legs; e.g. cattle’s. Lightning plays an important role in forest fires and associated damages. Interaction of CG discharges with railway can disrupt power lines can causing power failures [12]. The effects of CG discharges can be broadly classified into two categories, namely: (i) direct (direct strokes), and (ii) indirect (indirect strokes). Indirect effects can be further viewed as those due to: (a) conductive, inductive and capacitive coupling, and (b) radioactive coupling [13].
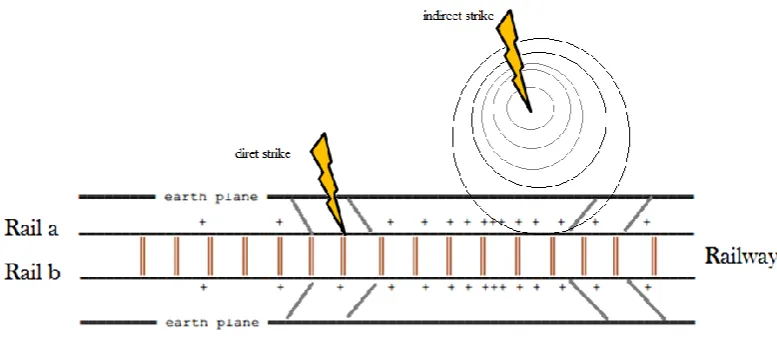
2.3.1 Direct strokes.
A lightning CG discharge, strikes an object directly, such as power-line or building, and it can result in significant damage. Direct effects generally result in physical damage and have associated fire hazards. In the case of buildings it can result in cracks in the masonry work. The injected voltages and currents associated with direct strokes being much higher compared to indirect strokes, will have the ability even to damage power and distribution equipment and cut railway [14]. Most often the electrical motor insulations associated with the irrigation pump becomes the victim of a direct stroke. Other common examples are welding of contactors of the motors starters and explosion of power distribution transformers. The protections in the form of lightning rods and ground overhead wires can significantly reduce the chances of direct strokes. Having averted the direct strokes if one has to successfully reduce the probable secondary effects an appropriate grounding and bonding system is a must [15].
2.3.2 Indirect effects.
Even if the lightning rods and ground overhead wires effectively shield the buildings, power lines, railways, and other objects, Once the lightning CG discharges are to the ground rod and railway lines, the charges tend to flow to the ground through the associated grounding system., the system needs grounding with zero ground impedance, ideally. In actuality the ground impedances are neither zero nor stable due to many of the soil properties and its associated parameters. There are guidelines related to the threshold permissible values of earth resistances depending on the criticality of the system being protected [16].
2.4 Railway system.
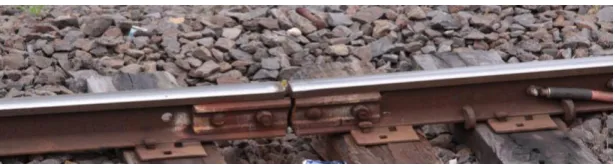
[image:28.595.167.475.674.758.2]As show the figure 2.3 Rail composed of a set of sections connected by junctions long the section about 100m.
The line profile of the rail track at the test section is shown in Figure. 2.13 a rail track consists of rails, cross ties, a rail bed, and a track bed.
Figure 2.4: Profile of the railway track. 2.4.1 Lightning surge parameters of railway track [17].
The surge impedance and the surge propagation velocity are important parameters as the surge characteristics of a rail. We investigated the surge impedance and the surge propagation velocity between the rail and the ground due to measuring the injection current to the rail and the induced voltage on the rail when the steep-front current was injected into the rail. The outline of measuring method is shown in Figure2.5.
Figure 2.5: Outline of measuring surge parameters of railway track.
2.4.2 Surge attenuation ratio in the railway track.
[image:29.595.187.462.447.554.2]2.4.3 Electric circuit for the railway.
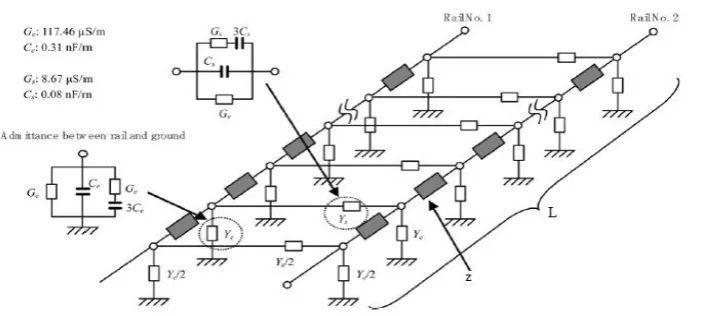
[image:30.595.136.488.324.482.2]The electric circuit, which is formed between sending end and receiving end of rail showing in Figure 2.6 can be considered a two-port circuit composed from the distributed-parameter line such as rails. We investigated the frequency-dependent four-terminal parameters (resistance R, inductance L, conductance G and capacitance C) of the rails to estimate the distributed parameter adopted in the calculation model due to measure the open circuit impedance and the short circuit impedance by non-grounding or non-grounding at the receiving end of rail, respectively. In the same way, open/short circuit impedance between rails [18].
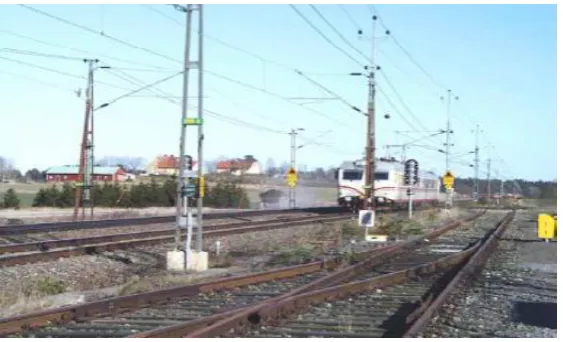
Figure 2.6: Railway tracks electric model propagation of surges. 2.5 Kluang single-track railway.
A photograph of the railway line in Kluang station is shown in Figure 2.7 it shows the distribution of MRLs. Both the tracks and ground conductors are considered as MRLs under the ground and are assumed to be infinite in either direction, which makes the problem two-dimensional. The schematic of MRLs model for double -track electrified railway system commonly found in Kluang is shown in Figure 2.15, the associated conductor systems are described in Table 2.1. The different mediums that would be of interest for the wave propagation studies are shown in Table 2.2. The typical values shown in Table 2.2 are taken; further, they are nominal and do not correspond to some extreme conditions of climate or temperature.
Figure 2.7: Railway tracks in Kluang station.
Figure 2.8: Schematic of double-track railway system (axes are in metres). Table 2.1: Conductor nomenclature of Kluang tracks.
Conductor nomenclature Conductor with bundle
S1-rail Z1
R1-rail Z2
S2-rail Z3
R2-rail Z4
Cable Z5
Rail and ballast .include the conductor’s Z1 and Z2 are the rail1. Z3and Z4 are the rail2. Z1 and Z3 are called the S-rail and is continuous and forms one of the reference/return conductors.Z2 and Z4 are the I-rail, which is broken every 1.02 km and is used for the signaling purpose. The track circuits are connected across the S-rail and I-S-rail and across which a constant potential of 7V exists. This voltage collapses to zero once the locomotive is on this section of the rails in the normal case.
[image:31.595.120.523.552.645.2]Then relay units are also connected across the tracks. These serve the purpose of train positioning and signaling systems. Z5 is the cable underground, which feeds the light. The Kluang railway system works at 10 kV and 16(2/3) Hz [19].
Table 2.2: Material properties of MTLs. Mediums/conductor Systems Relative permittivity Relative permeability Conductivity (S/m)
Air 1.0 1.0 1.0e-11
Ballast 10.0 1.0 1.0e-5
Ground 10.0 1.0 4.0e-4
Z1,Z2,Z3and Z4 1.0 20.0 4.40e-6
2.6 Modeling direct Lightning Strikes for Railway Systems with Lumped
Components.
A model with most common devices connected along the multiconductor transmission line (MTL) system of railway, i.e., booster transformers (BTs), autotransformers (ATs), and track circuits, for evaluating the voltage and current propagation due to lightning and switching transient sources was developed by the authors [20]. As the potential between above ground wires and poles may exceed the insulator impulse withstand voltage levels, flashovers occur and hence needs to be implemented in the model [21].
2.6.1 Induced Voltages Across Lumped Devices Along The Track System in
Railway And Transmissions Lines.
represented as series- and shunt-connected voltage sources along the lines of the MTL system [24]. In the analysis, an MTL system, representative of the catenary track system of electrified single-track railway system, as shown in Figure. 2.9, is considered. As seen, this 6-km long MTL system consists of five overhead wires, S-rail, I-S-rail, catenary, return conductor/negative feeder (called as return conductor), and auxiliary wire. All lines are terminated to the finitely conducting ground (ground resistivity 1000 Ω/m) by their self-characteristic impedance. The conductor radii and characteristic impedances are given in Table 2.4. Characteristic impedances are calculated for ideal ground, and are only approximate for finitely conducting ground. The telegraphers’ equation for the 5-conductor transmission line system above finitely conducting ground is given as follows [25]:
Table 2.3: Base-current parameter values.
I01
τ
11τ
21 n1 I02τ
12τ
22 n2(kA) (µs) (µs) (kA) (µs) (µs)
10.7 0.25 2.5 2 6.5 2.1 230 2
[image:33.595.127.514.420.635.2]' Figure. 2.9: MTL system representative of a typical railway traction conductor
feeding system.
Table 2.4: Conductor radii and characteristic impedances for Figure 2.16. S-Rail R-Rail Catenary Return/ Auxiliary Neg.feeder wire
Radii(mm) 49.5 49.5 50.6 8.2 5.6
[image:33.595.117.521.710.788.2]In Figure 2.17. It shows the complex distribution of MTLs. In the simulation, we have taken only a single-track system. However, an analysis with the double-track system would be similar as described here but with more conductors. Both the tracks and overhead conductors are considered as MTLs above the ground and are assumed to be infinite in either direction [26].
Figure 2.10: Railway track showing the complexity of MTLs.
Figure 2.12: Schematic of single-track railway system (axes are in meters).
Table 2.5: Conductor nomenclature.
Conductor nomenclature Conductor with bundle
S-Rail R1
R-Rail R2
Contact and messenger R3
Reinforcement R4
Return R5 and R6
help R7-R9
2.6.2 The electrified railway system.
A normal single-track electrified railway system can consist of as many as ten above ground conductors, and one buried communication cable along the track, not shown in the cross sectional view of the MTL system. The contact and messenger cables, both noted as R3 in the cross-sectional view of Figure. 2.17, are interconnected at every 7-10 m and these conductors can, in accordance with the principle of bundled conductors [27], be combined into a single conductor.
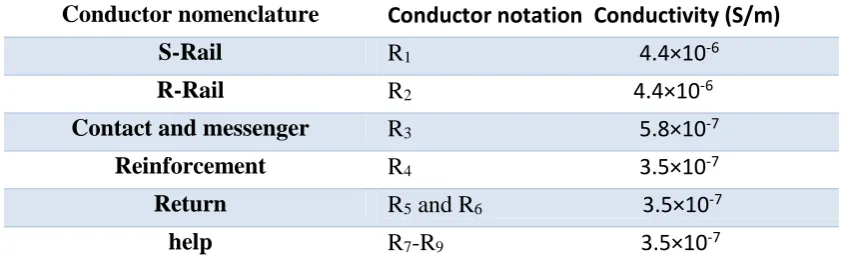
[image:35.595.116.526.410.509.2]Table 2.6: Conductor nomenclatures and properties in a typical single-track electrified railway system.
Conductor nomenclature Conductor notation Conductivity (S/m)
S-Rail R1 4.4×10⁻⁶
R-Rail R2 4.4×10⁻⁶
Contact and messenger R3 5.8×10⁻⁷
Reinforcement R4 3.5×10⁻⁷
Return R5 and R6 3.5×10⁻⁷
help R7-R9 3.5×10⁻⁷
Names, notations and conductivities of the overhead conductors of Figure 1.1 are presented in Table 2.6. The conductors forming the MTL system consist of the following:
• Two rails; the S-rail, R1, is continuous though out the entire railway system and used as a return path for the traction current and the I-rail, R2, has 45 insulated gaps at regular intervals and is used for signaling purposes.
• The bundled R3 conductor, also known as the catenary wire, is used for feeding power to the locomotive through the pantograph located on the locomotive roof with 15 kV, 16.67 Hz.
• An electrical reinforcement wire, R4, is running in parallel with the catenary and it is connected to it every 200-300 m. This wire is present for reducing the catenary system impedance.
• Return conductors, R5 and R6, are used for returning the traction currents to the feeding stations.
Figure 2.13: Ericsson BV-ECLALPLE 1S1.2 + 28P 0.9 cable, a typical communication cable used in the railway systems.
In double-track railway systems the tracks run in parallel and the overhead conductors are mirrored, with a distance of 4.4-10 m between the centers of the lines, with auxiliary wires only present at one side of the track [30].
2.7 Pole insulator flashover and ionization at the pole footing.
2.7.1 The interconnection between the conductors.
Interconnections between conductors play an important role in surge current distribution. The return conductors (R5 and R6) and S-rail (R1) are connected together at every 5 km. This situation is shown in Figure. 2.21 (dashed line). The interconnection is assumed to be at the middle of the line being simulated, where the lightning is assumed to strike at the top of conductor R7. The termination matrix at this junction point on the middle of the line is a sparse conductance matrix with its elements corresponding to short and open circuit resistances. Note that in all the simulations, this junction is assumed to be in the middle of the two pole locations. The distance between the two poles is 60 m.
2.7.2 Pole insulator flashover and soil ionization at the pole footing.
Figure 2.14: Interconnection between R5, R6 and R1.
The other terminations to the ground from the conductors are due to the insulator flashovers on the poles and pole’s footing ionization/static resistance as the case may be. Determining the equivalent termination resistance at the pole is a bit complex and depends on the ionization characteristics at the pole footing and insulator flashover behavior. The S-rail (R1) is connected to the pole footing directly and all the other conductors excepting I-rail (R2) are connected to the pole through the insulators, the schematic of which is shown in Fig. 2.22 The resistance (Rg) due to soil ionization at the pole footing is calculated using the method proposed by the IEEE standard [31],R0 is the footing resistance measured with low current (dc), IR the lighting current through the footing resistance and Ig is the current required to produce a voltage gradient, E0, at which soil breakdown occurs which is about 400 kV/m. The termination resistance is calculated using the equivalent circuit based on the schematic diagram shown Figure 2.15.
Table 2.7: Impulse withstand levels for the insulators.
Conductor
nomenclature
Ceramic insulator type Impulse withstand
voltage (kV)
R3 Rod or composite 225
R4 Lie post 170
R5 and R6 Spool 60
[image:38.595.118.525.641.770.2]Figure 2.15: Insulators, connections and pole footing resistance in a single track railway system.
At every 60 m along the MTL system there are poles. These are not only used for grounding points for the S-rail, but also to hold the overhead wires in the air along the system, as shown in Figure. 2.22. The above ground wires are connected onto this pole by insulators of different materials and impulse withstand over voltages, as shown in Table 2.7.
2.8 Waves on railway lines.
[image:39.595.182.456.556.712.2]Considering the above railway line in the sinusoidal steady state. Assuming series impedance per meter and shunt admittance per meter to neutral are:
𝑍 = 𝑟 + 𝑗𝜔𝑙 (2.1) 𝑦 = 𝑔 + 𝑗𝜔𝑐 (2.2) From figure 2.16 V1 and I1 are per phase terminal voltages and currents at left and V2, I2 are per phase terminal voltage and current at right. Considering a small section of line length dx .Taking the series impedance and the shunt admittance of dx are zdx and ydx respectively. The receiving end at the right side is located at x=0 and the sending end at the left side is at x=L. Applying Kirchhoff’s voltage law and Kirchhoff’s current law to dx.
𝛾 = √𝑍𝑌 = 𝛼 + 𝑗𝛽
(2.3)𝛾
is a complex quantity which is known as the propagation constant. WhereZ is the characteristic impedance of the line and is given by:
𝑍 = √𝑅+𝐿
𝜕 𝜕𝑡
𝐺+𝐶𝜕
𝜕𝑡
(2.4)
𝑍 = √𝐿
𝐶 (2.5)
This is the characteristic impedance of the line. This implies that the voltage and current waves travel down the line without changing their shapes.
𝜕2𝑢
𝜕2𝑥2
= 𝐿𝑐𝑢
(2.6)Equation (2.6) is the so called travelling wave equation of a loss less railway line. The solutions of voltage and current equations reduce to
𝑢(𝑥, 𝑡) = 𝐴1(𝑡)𝑒 𝑥
𝑣+ 𝐴2(𝑡)𝑒 −𝑥
𝑣 (2.7)
𝑖(𝑥, 𝑡) = − 1
𝑍0[𝐴1(𝑡)𝑒 𝑥
𝑣− 𝐴2(𝑡)𝑒 −𝑥
𝑣] (2.8)
V = 1
√𝐿𝐶 (2.9) 2.8.1 Reflection and refraction of travelling waves (Bewley Lattice diagram)
When the wave propagates along a railway line with certain characteristic impedance, there is a fixed relation between the voltage and current waves. The line is defined as:
𝛼 =
𝑍
𝑅− 𝑍
0𝑍
𝑅+ 𝑍
0Where Z0is a characteristic impedance of the line and ZRis the railway impedance [32]. Similar coefficients can beobtained for the currents, but the current reflection coefficientequals the negative of the voltage reflection coefficient value.
𝛽 =
𝑍0−𝑍𝑅𝑍𝑅+𝑍0 (2.11)
As a special case, termination in a short circuit results in
𝛼
= -1 for the voltage signals and 𝛽 = 1 for current signals. If the termination is an open circuit, ZRis infinite and𝛼
= 1 in the limit for the voltage signal and 𝛽 = -1 for the current signal. For a travelling wave while propagating through the railway, the railway (refraction) coefficient can be calculated as:𝛽 =
2𝑍𝑅𝑍𝑅+𝑍0
= 𝛼 + 1
(2.12)Therefore, for a line terminated in a short circuit, the voltage of the backward (or reflected) wave is equal and opposite to the voltage of the forward (or incident) wave. The bounce diagram, also known as the lattice diagram, provides a systematic way of tracing the wave propagation on a railway line in a graphical manner. This methodology is called the bounce diagram since it represents the travel waves that bounce back and forth at the impedance discontinuities of the railway line. Figure 2.17 shows the typical voltage bounce diagram [33] that represents the transient voltage at the total railway length with an incidental voltage signal of V+.
Figure 2.17: Bewley Lattice diagram that illustrates the injected voltage traveling back and forth in railway line.
𝑉
𝑖,𝑗𝐿= 𝛽
𝑖−2,𝑖−1𝑉
𝑖−1,𝑗𝐿+ 𝛼
𝑖−1,𝑖−2𝑉
𝑖−1,𝑗𝑅(2.13)
𝑉
𝑖,𝑗𝑅= 𝛼
𝑖,𝑖+1𝑉
𝑖+1,𝑗−1𝐿+ 𝛽
𝑖+1,𝑖𝑉
𝑖+1,𝑗−1𝑅(2.14)
Where Ti;i+1 and Ti+1;i are the transmission coefficients
𝛼
𝑖,𝑖+1 and𝛼
𝑖+1,𝑖are the refection coefficients between Zi and Zi+1.𝛽
𝑖,𝑖+1,𝛽
𝑖+1,𝑖,𝛼
𝑖,𝑖+1 and𝛼
𝑖+1,𝑖 are defined as follows [34].𝛼
𝑖,𝑖+1=
𝑍
𝑖+1− 𝑍
𝑖𝑍
𝑖+1+ 𝑍
𝑖𝛼
𝑖+1,𝑖=
𝑍
𝑖− 𝑍
𝑖+1𝑍
𝑖+1+ 𝑍
𝑖𝛽
𝑖,𝑖+1= 1 + 𝛼
𝑖,𝑖+1𝛽
𝑖+1,𝑖= 1 + 𝛼
𝑖+1,𝑖2.8.2 Propagation the waves in Bewley Lattice diagram method.
Figure 2.18 show how the voltage propagation in one section and determined peak voltage in end the line.
(2.15)
(2.16)
(2.17)
Figure 2.18: Bewley Lattice diagram for one section in railway line. The following equations explain how to get the peak voltage in the strike point.
V1=u (t) t=0 V2= (α+ βα) t=2TT V3= (α2β+α2β2) u (t) t=4TT V4= (α3β2+α3β3) u (t) t=6TT
UTT=V1+V2+V3+V4 (2.23) UTT (t) = ut(t)+ αut(1- β) (t-2TT) +α2 βu(t-4TT) +α2 β2 u(t-4TT) +α3 β2 u(t-6TT) + α3 β3 u(t-6TT) . (2.24) = ut(t) +α (1- β) +ut (t-2TT) +α2 β3 (1-β) u(t-4TT) +α3 β2 (1-β) u(t-6TT)
= ut(t) +α (1+β)[ ut (t-2TT) +α β u(t-4TT)+ (α+β)2 u(t-6TT)]. (2.25)
2.9 Lightning risk evaluation for railway signalling systems.
The lightning overvoltage on signalling cables
V = 0.0145 × (I / r) + 0.17 (2.26)
The lightning overvoltage on rails
V = 0.0134 × (I / r) + 0.19 (2.27)
We can estimate the lightning conditions at the case of lightning damage occurrence caused by exceeding the withstand voltages of railway signalling systems according to (2.25) – (2.26). We can evaluate the occurrence frequency of lightning risk for
(2.19) (2.20) (2.21)
railway signalling systems to the occurrence probability of lightning conditions as shown in Figure 2.19. If the railway signalling systems leading overhead power lines have a withstand voltage of approximately 30 kV where countermeasures for protection against lightning are taken, These lightning conditions correspond to the case that 31 kA of lightning strikes within a 0.155-km radius. 31 kA of lightning stroke current is 50 % value of cumulative occurrence frequency distribution of the peak value of lightning current. [35].
𝑃(𝐼) =
11+(𝐼
31)2.6
(2.28)
Where P (I) is the cumulative occurrence frequency distribution of the peak value of lightning current [%]. Iis the lightning stroke current [kA]. At the region where is N [times/year] of lightning stroke within a 10-km radius, the number of lightning stroke within r/km radius can be calculated by (2.28).
𝑁(𝑟) = 𝑁 ×
𝜋𝑟2𝜋×102
[image:44.595.208.466.527.744.2]Where N(r) is the number of lightning stroke within a r-km radius [times/year] [36]. R is the radius [km]. N is the number of lightning stroke within a 10-km radius [times/year]. for example of the region where is N = 1,000 times/year, we can evaluate that occurrence frequency of lightning damages of railway signalling systems leading overhead power lines is 0.36 times/year/equipment.
2.10 Devices along Electrified Railway Systems.
The most common devices connected along electrified railway systems consist of trackside transformers; BT and AT, and track circuits; relay and rectifier units. There are also interconnections between the overhead conductors in the railway system, depending on which feeding system that is used. In the single-track electrified railway system with ten overhead conductors there are not only the contact, messenger and reinforcement wires that are interconnected as explained before. The return conductors are also interconnected, and for BT systems these are also connected to the S-rail at the midpoint between two consecutive transformers. In double track railway systems the S-rails of the different tracks are interconnected at every 300 m. At every pole position the S-rail is shorted to the pole footing. The pole footing is in turn grounded, but due to the phenomenon of soil ionization [37] not to ideal ground. This can be accounted for by connecting series non-linear resistors between every pole footing and the reference ground.
[image:45.595.164.475.430.543.2]Components and devices connected to the auxiliary wires are not considered in this work.
Figure 2.20: Transformer connections in BT feeding systems. 2.10.1 Trackside Transformers.
[1] "Annual Lightning Flash Rate". National Oceanic and Atmospheric Administration. Retrieved January 15, 2013.
[2] J. A. Martinez-Velasco, Power System Transients Parameter Determination. CRC Press, 2010.
[3] L. V. Bewley, Travelling Waves on Transmission Systems. DoverPublication, 1951.
[4] A. R. Hileman, Insulation Coordination for Power Systems. Marcel Dekker, 1999.
[5] Z. Benesova, and V. Kotlan, “Propagation of surge waves on nonhomogeneous transmission lines induced by lightning stroke,” Advances in Electrical and
Electronic Engineering, Vol. 5, no. 1 – 2, pp. 198 –203, 2006.
[6] M. N. O. Sadiku, Numerical Techniques in Electromagnetics. CRC Press, 2001. [7] http://www.meteohistory.org/2004proceedings1.1/pdfs/01krider.pdf
[8] http://plaza.ufl.edu/rakov/Gas.html
[9] http://science.nasa.gov/headlines/y2006/13sep_electricice.htm [10] http://en.wikipedia.org/wiki/Runaway_breakdown.
[11] Martin A. Uman (1986). All About Lightning. Dover Publications, Inc.. pp. 103–110. ISBN 0-486-25237-X
[12] http://www.weatherquesting.com/skinny-lightning.htm [13] http://en.wikipedia.org/wiki/Dry_lightning.
[14] http://en.wikipedia.org/wiki/Ball_lightning.
[15] http://en.wikipedia.org/wiki/Upper-atmospheric_lightning. [16] http://www.ngdc.noaa.gov/hazard/stratoguide/galunfeat.html [17] http://newswise.com/articles/view/539709/
[18] V. A. Rakov and M. A. Uman, “Lightning Physics and Effects”, pp. 159 – 161, Cambridge University Press, 2003
1985, 104, pp. 3544-3550.
[21] Izydorczyk, J., \Comments on \Time-domain re°ectometry using arbitrary incident waveforms"," IEEE Transactions on Microwave Theory and Techniques, Vol. 51, No. 4, 1296{1298, 2003.
[22] H. Arai, H. Matsubara, K. Miyajima, S. Yokoyama, K. Sato, Experimental study of surge propagation characteristics of rail and lightning overvoltage on level crossing , IEEJ Trans. PE 123 (11) (2003) 1307–1312.
[23] F. Rachidi, S.L. Loyka, C.A. Nucci, M. Ianoz, A new expression for ground
transient resistance matrix elements of multiconductor overhead transmission lines, EPSR 65 (April (1)) (2003) 41–46.
[24] T. Noda, "Development of surge analysis codes based on the FDTD method," Central Research Institute of Electric Power Industry, research report, T00004 (October 2000).
[25] Mazloom z, Theethayi N. Thottappillil R, "Indirect lightning induced voltages along a railway catenary track muhiconductor transmission line system with lumped components," IEEE Transactions on Electromagnetic Compatibility, 2011, 53(2): 537-539.
[26] Mazloom Z, Theethayi N. Thottappillil R, "Modeling indirect lightning strikes for railway systems with lumped components and nonlinear effects," IEEE Transactions on Electromagnetic Compatibility. 2011. 53(1): 250-252.
[27] Pereira Braz C, Piantini A, "Analysis of the dielectric behavior of distribution insulators under nonstandard lightning impulse voltages," IEEE Latin America Transactions. 20ll, 9(5): 732-739.
[28] Ancajima A, Carrus A, Cinieri E, et a1., "Behavior of MV insulators under lightning-induced overvohages: experimental resultsand reproduction of volt-time characteristics by disruptive effect models," IEEE Transactions on Power Delivery 2010. 25(1): 221-230.
J. Control 43 (5) (1986) 1413–1426.
[31] H. Arai and K. Sato, “Estimation of Occurrence Probability of Lightning Damages on Railway Level Crossing”, IEEJ Trans. PE, Vol. 127, No. 12, pp. 1275 – 1280, December 2007
[32] The Study Committee of Lightning Protection for Electrical and Electronic Equipment, “Lightning Protection for Electrical and Electronic Equipment – Supporting the society of information and communication technology –”, The Institute of Electrical Installation Engineers of Japan, August 2011.
[33] R.J. Hill, S. Brillante, C.R. De Souza, P.J. Leonard, Electrical material data for railway track transmission line parameter studies, IEEProc. Electrical Power Appl. 146 (1) (1999) 60–68.
[34] IEEE Guide for the Application of Insulation Coordination, IEEE Std. 1313.2, Technical Council of the IEEE Power Engineering Society,1999.
[35] STEINFELD.K. and GOHLER.R. 2002, Metal Oxide Surge Arresters for Electric Railways, Berlin.
[63] SMITH.M. 2003, Outline History of British Railway System [Online]. Available From: http://myweb.tiscali.co.uk/gansg/1-hist/01hist.htm. [Accessed: 6/6/2011].
[37] GHAREHPETIAN.G.B., SHAHNIA.F. Lightning and switching transient over voltages in power Distribution systems feeding DC electrified Railways, Amirabad University of Technology, Iran.
[38] L. Mahamoud Mahamed, “Extensive modeling of autotransformers used in the Swedish national railway network”, Ms. Thesis, UpTec-UU TVE 07 019, Uppsala University, 2007.
[39] F. Rachidi, C.A. Nucci, M. Ianoz and M. Mazzetti, “Influence of a lossy ground on lightning induced voltages on overhead lines”, IEEE Transactions on Electromagnetic Compatibility, Vol. 38, No. 3, pp. 250-264, 1996.
periodical grounding of shielding wires and of surge arresters: modeling and experimental validation”, IEEE Transactions on Power Delivery, Vol. 19, No. 1, pp. 423-431, 2004.