An agentbased method for predicting
monthly maximum & minimum quote
prices
Mazyar, H, Mahdaviani, K, Majidi, S and Saraee, MH
Title
An agentbased method for predicting monthly maximum & minimum
quote prices
Authors
Mazyar, H, Mahdaviani, K, Majidi, S and Saraee, MH
Type
Conference or Workshop Item
URL
This version is available at: http://usir.salford.ac.uk/18933/
Published Date
2007
USIR is a digital collection of the research output of the University of Salford. Where copyright
permits, full text material held in the repository is made freely available online and can be read,
downloaded and copied for noncommercial private study or research purposes. Please check the
manuscript for any further copyright restrictions.
Paper ID : IDMC2007_1362
An Agent-based Method for Predicting Monthly
Maximum & Minimum Quote Prices
Helga Mazyar1,Kaveh Mahdaviani2, Saeed Majidi3 and *Mohammad H. Saraee4 Department of Electrical and Computer Engineering, Isfahan University of Technology
Isfahan Mathematics House, Isfahan, Iran
Abstract
In this paper a multi agent model for predicting monthly maximum and minimum quote prices has been proposed. This model is based on the training of Elman neural networks and using particle swarm optimization for obtaining the best parameters of the neural networks. Also one method for reducing the effects of overfitting problem is suggested. This method averages the outputs of an ensemble network, given noisy data as inout, to predict the final results.. Finally the results of using this model on a sample data set are presented and the effectiveness of this model is illustrated.
Keywords: stock prediction, recurrent neural network, Particle Swarm Optimization, ensemble averaging
1.
Introduction
From the beginning of time it has been man’s common goal to make his life easier. The prevailing notion in society is that wealth brings comfort and luxury, so it is not surprising that there has been so much work done on ways to predict the markets. Prediction of stock market returns is an important issue in finance. Various technical, fundamental, and statistical indicators have been proposed and used with varying results. However, no one technique or combination of techniques has been successful enough to consistently "beat the market"[1]. With the development of artificial neural networks (ANNs), researchers and investors are hoping that the market mysteries can be unraveled. Nowadays artificial neural networks have been popularly applied to finance problems such as stock exchange index prediction, bankruptcy prediction and corporate bond classification [2]. Much research on the applications of ANNs for solving business problems have proven their advantages over statistical and other methods that do not include AI, although there is no optimal methodology for a certain problem.
1
2
4
This paper proposes a method to predict the maximum and minimum monthly values of a company quotes in the stock market based on neural networks. It is organized as follows: Section 2 provides the motivation for predicting stock market prices. Also briefly describes different methods of predicting quote prices and discusses why neural networks are mainly used to solve this problem. Furthermore our motivation for using Elman networks is presented. Section 3 focuses on Elman neural network general architecture and the specific structure used in the proposed model. The majority of the work, in Section 4, details our model and its special features designed to solve problems related to forecasting time series. In section 5 a dataset is used to illustrate our system efficiency. We conclude the paper with some final thoughts and present few areas to be considered for future work.
2.
Motivation
The principal motivation for the neural network approach in stock prediction is twofold: 1-Stock data is highly complex and hard to model; therefore a non-linear model is beneficial. 2-A large set of interacting input series is often required to explain a specific stock, which suites neural networks [3].
Neural networks are used to predict stock market prices because they are able to learn nonlinear mappings between inputs and outputs. Several researchers claim the stock market and other complex systems exhibit chaos. Chaos is a nonlinear deterministic process which only appears random because it cannot be easily expressed. With the neural networks’ ability to learn nonlinear, chaotic systems, it may be possible to outperform traditional analysis and other computer-based methods.
A prediction is commonly expressed as a function of the recent history of the time series, . The goal of predicting time series is to find an appropriate function f. Different architecture of neural networks have been used to fulfill predicting behaviors of the underlying systems. Feed forward multilayer perceptron (MLP) network has been frequently used in many forecasting problems. An MLP network, however, has the serious limitation that it can only learn an input-output mapping, which is static [4], so it can be used to perform a non-linear forecasting of a stationery time series. Atime series is a stationary one if its statistics do not change with time.
) , , (
ˆt= f xt−1 xt−2 K x
In many real problems such as predicting stock prices, the time contains important information. The interpretation of a feature in a data could strongly depend on the earlier features and on the time they appear. We want to be able to deal with time varying sequences and the possible solution is to let time have an influence over the network response instead of adding a new input dimension. This can be fulfilled if the network has dynamic properties and in such a way it can respond to temporal sequences. Neural network must contain memory in order to process temporal information. Therefore, to predict time series, networks with recurrent structure and internal memory should be chosen as the best choice. However, whatever recurrent architecture we use, some definite problems such as overfitting [5] will be met.
Among different types of recurrent neural networks, in this paper we mainly focus on Elman networks for prediction because of the inherent architectural simplicity of these networks which will decrease the effects of over fitting problem. However, any other recurrent network containing an internal memory will be acceptable through this approach. After the training phase, each Elman network will act as an agent [6] in a PSO problem space, also some methods for reducing the overfit problem will be applied to the data. In the following sections each part will be discussed in more details.
3.
Elman Neural Network
Elman in [7] has proposed a partially recurrent neural network: a model intended to deal with the structural aspects of language as it varies in time. This model has been used by other authors and promises to be useful in various time related domains. In Elman network positive feedback is used to construct the memory in the network (Fig. 1).This network has three layers: input, hidden and output layers. The so-called context units are used to save previous output values of the hidden layer neurons. Then, the values of the context units have been fed back fully connected to the hidden layer neurons; in
this way serving as additional of the network. This hidden layer activation is thus a function both of recurrent inputs and past hidden values.
Figure 1: The structure of an Elman neural network with one hidden layer
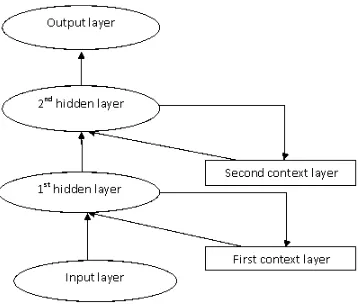
In our work Elman networks with two hidden layers are used. Also each hidden layer has a context layer. In the next section the reasons and more details about this architecture will be provided. Figure 2 shows the internal architecture of these Elman networks.
Figure 2: Structure of Elman neural networks used in the proposed model
4.
The proposed model
The basis of our proposed model consists of elements of simple recurrent neural network. The word ‘simple’ is used here to show that this network has a simple architecture. However the dimension of this network may be huge due to the great number of neurons used in the hidden layers. Our motivation for using such a network is the complex behavior of the stock market which implies many parameters for predictor systems.
To obtain the best parameters for this network a multiagent optimization method based on the Swarm Intelligence, Particle Swarm Optimization, is used.
Particle Swarm Optimization (PSO) is first introduced by Eberhart and Kennedy [8] and used for optimization of continuous nonlinear functions. The swarm is composed of some volume-less particles with velocities, each of which represents a feasible solution in the solution space. The algorithm finds the optimal solution through moving each particle i in the problem space by varying its velocity vi using the
[image:4.612.218.397.333.486.2]2 2
10 1,
∑ Pr
(1)
where xi is the current position of particle i and bpi and bg are respectively the best previous position (the
position giving the best fitness value) of the ith particle and the best known global position among all particles in the population. randis a random number between (0 ,1 )
In our model, each particle is an Elman neural network initiated with some random weight and bias parameters. Inherent complexity of stock data market suggests two hidden layers for each Elman neural network. Each hidden layer has a context layer. To obtain appropriate target for each sequence of input data, the period of the input data is needed. To find this period we applied Fast Fourier Transformation to the input data which is monthly maximum and minimum quote prices. The first ninety percent of input data is used for training the Elman networks. At this time the Elman networks are properly learned with the training data but this leads to a problem; the nearly exact training of the Elman networks implies that our model gives out the exact target values for the training set but it behaves chaotic when exposed to new data. In other words Elman networks face the overfitting problem. The next step suggests a solution to reduce the effects of this problem.
After this training phase, the remaining ten percent of data is used to move each network in the PSO space toward the best coordinates. We call this ten percent of input data PSO-dataset. The response of each Elman network to the PSO-dataset is compared with the related target value and with the help of fitness function of PSO optimization, the most efficient Elman network is chosen. The result gives us the best Elman network for solving the prediction problem.
To more reduce the effects of overfitting problem our model repeats all the steps mentioned above by adding noise to the training data. Adding noise decreases the effects of overfitting problem by dispersing input data. To do this, in every iteration a uniform random noise with increasing amplitude is added to the first ninety percent of training set and the Elman networks are trained with these noisy data.
(2)
In this equation z is the number of networks added to the ensemble neural network before this step. Therefore, the noise amplitude is increased just after the steps in which a new member was added to the ensemble neural network.
rand (1,N) is a 1×N vector. The components of this vector are uniformly distributed random numbers between -0.05 and +0.05. M is equal to Max – Min where Max and Min are the maximum and minimum values of time series respectively. Next we add these noise vectors to the vector containing first 90 percent of data and construct the inputs with these noisy data. Once again we select the network that has the best generalization on these new training data sets
To make the prediction, we use the mass average on the outputs of the final networks. So the output of the prediction system is obtained using the following equation:
(3)
In the above equations z is the number of ensemble members and Pr(i) is the output of i’th network. Although the networks which are chosen from PSO at each iteration are locally over fitted but sum of the results of these networks distributes the final result, so this method solves the overfitting problem globally.
5.
Experimental results
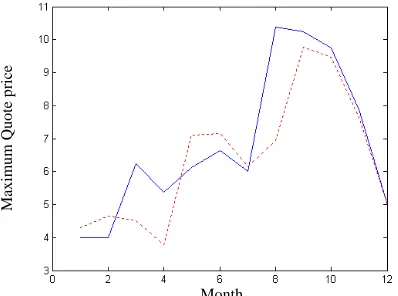
We used Yahoo Finance to get daily quote prices of Ford Company from June 1995 till June2007 as our training set. This data set contains nearly 3000 daily records. At first minimum and maximum monthly values were extracted, as shown in Fig 3 and Fig 4. The goal is to predict the maximum and minimum quote prices of June 2007.
[image:6.612.194.399.151.299.2]
Figure 3: monthly maximum FORD quote prices over the period June 15, 1997 to June 1, 2007
M
axim
u
m
Quote p
rice
Month
[image:6.612.193.398.334.480.2]
Figure 4: monthly minimum FORD quote prices over the period June 15, 1997 to June 1, 2007
M
inim
u
m Quote p
rice
Month
To get the monthly minimum and maximum periods we applied the Fast Fourier Transformation and multiplied the results to their conjugate values, the result is 62 for both of minimum and maximum values.
Simulations have been done with the PSO space composed of 1000 Elman networks. Each Elman network has 400 and 100 neurons in the first and second hidden layers respectively and is initiated with random weight and bias values. The number of input layer neurons is equal to the period of input data and there is one neuron in the output layer. In the training phase each Elman network is trained with first 111 quote prices.
As mentioned in the previous section, to reduce the effects of overfitting problem we added a noise to inputs and trained the networks with these noisy data. We used a uniformly distributed random noise which is scaled in the range of -0.5 and +0.5 with the maximum value equal to a coefficient, named beta, multiplied by maximum value of quote prices. The value of beta is set to 0 at the first iteration and increase 0.01 after each iteration. This noise is added to input data and the networks are trained with these noisy data.
reach an acceptable error which is defined at the run time. Each particle which decreases the mean error will fall into the results collection. For the Ford example this collection contains 5 networks for maximum and 3 for minimum values. After completing all the steps we calculate the average output of the result collection and these on-sum results are plotted.
[image:7.612.200.401.207.355.2]The final results for minimum and maximum prices are shown in Fig 5 and Fig 6 respectively. The dotted curve shows the result of our model and the other curve shows the desired values. These diagrams are
Figure 5: The dashed curve shows the result of our model for the 13 last minimum quote prices and the blue curve is the target values. The last point shows our predic minimum quote price fo .
Figure 6: The dashed curve shows the r and the blue curve is the target
values. The last point shows our predicti aximum quote price for June 2007.
6.
Co
to predict the monthly maximum and minimum quote Elman neural networks and using the particle swarm plotted for the last 13 quote prices which are not used in the training of the networks. However the first 12 points are used in the optimization step. The last point is our prediction which is 3.924 for the minimum value and 5 for the maximum. The targets are 4 and 5 respectively which shows the error of 0.84 out of 100 for the minimum and less than 0.001 for the maximum result.
tion for r June 2007
esult of our model for the 13 last maximum quote prices
on for m
nclusions and future works
In this paper we proposed a multi agent model prices. This model is designed based on training
optimization to move the networks in the desired direction in order to obtain the best fitness values. Also, the overfitting problem which arises from the firm training of the neural network discussed and one method based on ensemble output of noisy data for training the Elman networks is proposed. At last, the implementation of our model was verified over a real data set of quote prices. The result shows the error of 0.84 percent and nearly 0 for the prediction of minimum and maximum monthly prices respectively. In the future works we focus on combing this method with some other recurrent networks. Also the effects of the number of neurons of the hidden layers will be considered.
M
axim
u
m
Quote p
rice
rice
Month Month
M
inim
u
m Quote p
[image:7.612.201.400.400.548.2]sing neural networks to forecast stock market prices" 1997. Available from renc/research/Papers/nn.pdf
04 .
, 35, pp: 826-833, 1995.
“Particle swarm optimization”,
arning and Cybernetics, Shanghai, 26-29 August 2004.
7.
References
[1] Lawrence R., "U www.cs.uiowa.edu/~rlaw
[2] Birgul E., Meltem O., Bertan B., "Stock market prediction using neural networks", Bogazici University, Istanbul, Turkey.
[3]Nygren K.,"Stock prediction- a neural network approach", Master Thesis, Royal Institute. Of Technology, KTH, March, 20
[4] Haykin, S., "Neural networks: A comprehensive foundation", Macmillan College Publishing Company, NewYork, 1994
[5] Tetko, I.V., Livingstone, D.J., Luik, A.I. Neural network studies. “Comparison of overfitting and overtraining”,
Journal of Chemistry and Information. Computer Science
[6] Hokky S., Yohanes S. “Agent-based model construction in financial economic system”, 2004 Australia, IV, pp: 1942-1948, 1995.
[7] Elman J.,”Finding structure in time”
Cognitive science
, Vol. 14, pp 179-211, 1990.Proceeding of the 1995 IEEE International
[8] Kennedy J., and Eberhart R.C.,
Conference on Neural Networks, Perth,