Forest canopy gap fraction from terrestrial
laser scanning
Danson, FM, Hetherington, D, Morsdorf, F and et, al
http://dx.doi.org/10.1109/LGRS.2006.887064
Title
Forest canopy gap fraction from terrestrial laser scanning
Authors
Danson, FM, Hetherington, D, Morsdorf, F and et, al
Type
Article
URL
This version is available at: http://usir.salford.ac.uk/2506/
Published Date
2007
USIR is a digital collection of the research output of the University of Salford. Where copyright
permits, full text material held in the repository is made freely available online and can be read,
downloaded and copied for noncommercial private study or research purposes. Please check the
manuscript for any further copyright restrictions.
Forest Canopy Gap Fraction From
Terrestrial Laser Scanning
F. Mark Danson, David Hetherington, Felix Morsdorf, Benjamin Koetz, and Britta Allgöwer
Abstract—A terrestrial laser scanner (TLS) was used to mea-sure canopy directional gap fraction distribution in forest stands in the Swiss National Park, eastern Switzerland. A scanner model was derived to determine the expected number of laser shots in all directions, and these data were compared with the measured number of laser hits to determine directional gap fraction at eight sampling points. Directional gap fraction distributions were determined from digital hemispherical photographs recorded at the same sampling locations in the forest, and these data were com-pared with distributions computed from the laser scanner data. The results showed that the measured directional gap fraction distributions were similar for both hemispherical photography and TLS data with a high degree of precision in the area of overlap of orthogonal laser scans. Analysis of hemispherical photography to determine canopy gap fraction normally requires some manual data processing; laser scanners offer semiautomatic measurement of directional gap fraction distribution plus additional three-dimensional information about tree height, gap size, and foliage distributions.
Index Terms—Directional gap fraction, forest structure, hemi-spherical photography, terrestrial laser scanner (TLS).
I. INTRODUCTION
T
HE three-dimensional (3-D) arrangement of forest canopy elements controls light interception, CO2 fluxes, and canopy hydrometeorological characteristics. Conventional methods of measuring plant canopy structure are time consum-ing, labor intensive, and error prone. Direct methods normally involve destructive sampling of canopy elements, and in large complex forest or woodland canopies, it may be impossible to collect sufficient samples to accurately characterize the struc-ture [1]. Indirect methods of measuring canopy strucstruc-ture in-clude both light interception instrumentation and hemispherical photography, and there is an extensive literature showing how these methods may be used to measure forest leaf area index (LAI) or plant area index, canopy cover, gap size distributions, and light climate [1]. Canopy gap fraction is defined as the probability of a ray of light passing through the canopy without encountering foliage or other plant elements. Canopy direc-tional gap fraction describes the probability that a beam will notManuscript received April 7, 2006; revised July 21, 2006. This work was supported in part by the European Union “Spread” under Contract EVG1-CT-2001-00043.
F. M. Danson and D. Hetherington are with the Centre for Environmental Systems Research, University of Salford, Manchester M5 4WT, U.K. (e-mail: [email protected]).
F. Morsdorf, B. Koetz, and B. Allgöwer are with the Department of Geogra-phy, University of Zurich, 8057 Zurich, Switzerland.
Digital Object Identifier 10.1109/LGRS.2006.887064
intercept a canopy element in a given direction. Weisset al.[1] review the methods to derive LAI from gap fraction mea-surements. The advantage of hemispherical photography over light interception measurements is that it provides a permanent two-dimensional record of canopy structure. Terrestrial laser scanners (TLS) have the potential to provide a permanent 3-D record of canopy structure and, with recent advances in scanner technology, to provide detailed information about forest canopy architecture.
TLS use range-finding measurement technologies to derive the 3-D position of objects within the scanner field of view. TLS are now capable of collecting 3-D data clouds(x, y, z)of several million data points in less than 5 min. Their application in surveying and engineering is now well established, and recent research has examined their application for 3-D mapping in the environmental sciences (e.g., [2]).
Applications of terrestrial laser scanning in forestry have focussed on the rapid semiautomatic determination of stand characteristics like tree density, height, and girth, and there now appears to be a great potential for the application of TLS in forest inventory and monitoring [3]–[5]. However, this letter assesses the potential of TLS for measuring the 3-D characteristics of forest canopies and specifically the extraction of canopy directional gap fraction [1].
If a laser “shot” is fired in a given direction, and there is no corresponding return “hit” recorded, then it may be interpreted as a gap in the given direction(gap fraction= 100%). A laser hit in a given direction may be interpreted as no gap in that direction (gap fraction= 0%). A laser hit is recorded if there are objects within the laser beam, within a given range, and with a high enough reflectivity, to produce a return signal above a predetermined instrument noise level. However, if there is a gap in the canopy in a given direction, but there are objects within the beam (at slightly different angles) that cause a return, a hit may be recorded. Conversely, if there is no gap in a given direction, but there are insufficient objects within the beam to trigger a hit, then a “miss” or gap may be recorded.
Well-established methods to measure plant canopy struc-ture, based on the point-quadrat methods of Warren-Wilson [6], have been adapted to use hemispherical photography be-low forest canopies to measure canopy structure. This letter compares hemispherical photography and TLS measurements to derive forest canopy directional gap fraction and other canopy attributes. It examines the strengths and weaknesses of each approach and considers the factors that may influence the resolving power of TLS in measuring gaps in a forest environment.
158 IEEE GEOSCIENCE AND REMOTE SENSING LETTERS, VOL. 4, NO. 1, JANUARY 2007
TABLE I
CHARACTERISTICS OFLASERSCANNER
II. LASERSCANNERCHARACTERISTICS ANDDATAPROCESSING
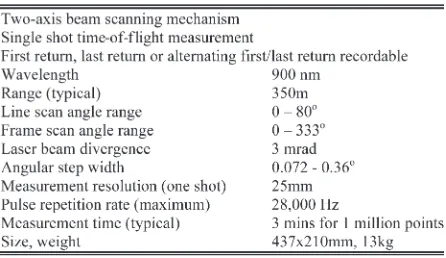
The laser scanner used in this letter was a Riegl LMZ210i, which uses a two-axis beam-scanning mechanism and a pulsed time-of-flight laser range finder to measure the 3-D position of points within a range of about 350 m. Line scan measurements are produced through the rotation of a polygon mirror and frame scan measurements through the rotation of the optical head of the scanner. The angular step width in both line and frame scan directions may be set by the user to determine the angular separation between laser shots. The line and frame scan angle ranges may also be determined by the user within the limits of the instrument (Table I). Data may be recorded as either first return or last return, or a combination of both.
[image:3.594.57.280.91.220.2]Since the TLS used does not record laser misses, it was necessary to develop a laser scanner model to determine the number and direction of all shots in a scan, which is dependent on resolution, scanning geometry, and line and frame scan angle range. This involved three steps: 1) Cartesian to cylindrical coordinate transform to compute the expected pattern of shots on the surface of a half cylinder; 2) cylindrical to spherical transform to project the pattern onto a hemisphere with a fixed radiusr; and 3) spherical to Cartesian transform of these data to allow definition and deletion of shots in segments at angles greater than or less than the specified line scan angle range (see Fig. 2, top and bottom). To test the scanner model, a single scan was performed using the TLS indoors in an enclosed room with no windows with the scanner pointing toward the ceiling, a line scan angle range of 51.27◦–127.32◦and a frame scan angle range of 0◦–180◦, and a resolution in both directions of 0.18◦. The frequency of laser shots in 5◦ zenith bands from 0◦ to 90◦ was calculated using both the measured and modeled scanner data in spherical coordinates. The results showed very strong agreement between the measured and modeled frequencies, giving high confidence in the validity of the scanner model (Fig. 1).
III. METHODOLOGY
Spatially and temporally coincident TLS data and digital hemispherical photographs were collected in a seminatural forest area in the Swiss National Park, Switzerland, in August 2005. The forest is located in the Ofenpass valley at an altitude of approximately 1900 m. The dominant tree species is
moun-Fig. 1. Comparison between the measured and modeled number of laser hits in an enclosed room. Stars represent number of hits in 5◦zenith bands from 0◦to 90◦.
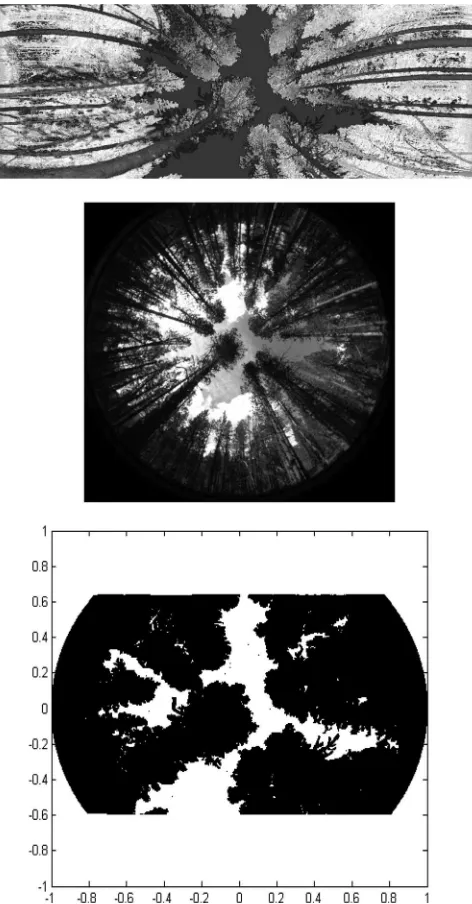
tain pine (Pinus mugo) with some stone pine (Pinus cembra). The average tree height in the study area, which was determined from field measurements, was 12 m, and the stem density was 1200 trees ha−1 [7]. A 260-m transect with eight sampling locations was employed. At each sampling location, a surveying tripod was leveled, and differential global positioning system data were collected to determine geographic location. A single hemispherical photograph was taken using an upward-looking Nikon Coolpix 4500 with a calibrated hemispherical lens. The hemispherical photographs were analyzed using the gap light analyzer software [8]. Gap fractions were computed for zenith angles 0◦–90◦in 5◦bands and averaged over all azimuth angles. The TLS was mounted on the tripod at an inclination angle of 90◦, and a single scan was recorded with a line scan angle of approximately 80◦and a frame scan angle of 180◦(Fig. 2, top). The TLS was then rotated by 90◦, and a second orthogonal scan was recorded. The resolution was set at 0.108◦in line and frame scan directions, and the first return data were recorded. A single scan recorded about one million points in 3 min.
IV. RESULTS ANDDISCUSSION
After conversion to spherical coordinates (Fig. 2, bottom), the measured scans were compared with the equivalent model scan to determine the directional gap fraction distribution. Two contrasting examples are shown in Fig. 3. Canopy cover esti-mated from the hemispherical photographs, using only zenith angles between 0◦and 10◦, for the locations in Fig. 3 was 75.2% (top) and 10.8% (bottom), and using the ratio of laser shots to hits, over the same range of angles, cover was estimated as 75.6% and 14.3%, respectively.
Fig. 2. TLS data of forest stand. (Top) Intensity of returns in a cylindrical projection (scan range180◦×80◦). (Middle) Digital hemispherical photo-graph at the same location (equiangular projection). (Bottom) Processedx, y, z coordinate laser scanner data showing projection of laser hits onto a hemisphere of unit radius.
Overall, the information content of the laser scans appeared to be similar to that of the hemispherical photographs (Fig. 2), but additional range-related data could be easily extracted from the scans. For example, the frequency of returns in thezdirection could provide data on the vertical distribution of vegetation elements and height of the canopy, andxyslices could be used to estimate canopy cover.
The orthogonal laser scans sampled the same area of the canopy between zenith angles of 0◦and 40◦(since the line scan angle range was about 80◦) and thus provide an independent test of the repeatability of the laser scanner measurements (Fig. 3). At all sampling locations, the difference between the gap fraction measurements for the two laser scans was generally small up to 40◦. At zenith angles larger than 40◦, there was some divergence in the gap fraction measured reflecting
Fig. 3. Comparison of gap fraction distribution derived from hemispherical photographs (solid circles) and two orthogonal laser scans (open circles). Orthogonal scans sample the same part of the canopy up to zenith angle of 40◦.
azimuthal variation in canopy structure. Only a small segment of the hemisphere was not measured, and averaging the two orthogonal scans would be a reasonable way to represent the complete gap fraction distribution.
[image:4.594.43.279.68.520.2]160 IEEE GEOSCIENCE AND REMOTE SENSING LETTERS, VOL. 4, NO. 1, JANUARY 2007
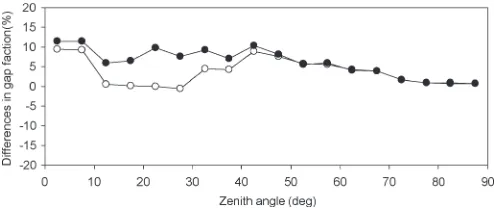
Fig. 4. Average difference in gap fraction (open circles) and rms error of difference in gap fraction (solid circles) derived from TLS and hemispherical photography.
of vegetation cover with the TLS. In the example shown in Fig. 3 (bottom), the fit between the photography and TLS data is closer, but at zenith angles larger than 40◦, the laser data appear to show higher gap fraction than the photography, which shows zero gap from 60◦ zenith and larger. This is a feature of data from most of the eight plots sampled and suggests that the laser is hitting low reflectance targets at far range, so that the return intensities are too low for detection. In contrast, gap fractions measured at large zenith angles from hemispherical photography are generally close to 0% because of the overlap of the tree stems for any given line of sight.
To make a quantitative comparison of the differences in the directional gap fraction estimated from the TLS and hemispher-ical photography, the mean difference and root-mean-square (rms) error difference were calculated using the data from the eight sampling locations (Fig. 4). The mean difference was close to zero between zenith angles of 10◦ and 30◦ and less than 9% at all other angles. This indicates that the TLS-derived gap fraction was, on average, slightly higher than that derived from the hemispherical photography. This result contrasts with the work of Lovellet al.[9], who found that a TLS underesti-mated gap fraction compared to hemispherical photography in 40-year-old Ponderosa pine plantation with an average tree height of 29.8 m and stem density of 360 trees ha−1. Differ-ences in tree height, crown cover, and laser scanner character-istics may explain this result. The rms error of the gap fraction differences was between 5% and 11% at zenith angles between 0◦and 55◦and less than 5% at larger zenith angles. This statistic indicates the size of the average difference between the derived gap fractions.
V. CONCLUSION
The results of this experiment highlight the potential of TLS for measuring the 3-D structure of forest canopies. The fit of the hemispherical photography gap fraction data to the TLS gap fraction data was close for all the measured plots, and we are now comparing LAI estimates from the two data sources. However, further work is required to understand the effects of beam divergence on gap detection. At a range of 10 m, the laser spot size is approximately 30 mm in diameter, and at 20 m, it is 60 mm. The detectability of gaps with the TLS is therefore range dependent and, as discussed in the introduction, dependent on target reflectivity and arrangement within the laser beam. Further experiments are also required to assess the
effect of variation in angular sampling resolution since this is independent of beam divergence, and the information content of both first and last return data. The methods presented here may also provide useful data for validating canopy structure measurements derived from airborne laser scanners [10].
To date, the only technique available for creating a permanent record of forest canopy structure is hemispherical photogra-phy. There are a number of key advantages of hemispherical photography over light interception measurements [11], but the weaknesses of the photographic approach are the requirement for manual intervention in postprocessing the images and the variability of the measurements with different sky conditions. In contrast, the TLS postprocessing routines applied in this letter could be automated. Sky conditions appeared to have little influence on the quality of the data collected, although further experimentation with different light conditions will be required to confirm this. These factors, coupled with the additional 3-D information that can be extracted from the data, such as height and vertical foliage profile, suggest that TLS will be central to future developments in the measurement of 3-D vegetation canopy structure.
ACKNOWLEDGMENT
The authors would like to thank the Swiss National Park for allowing access to the field site.
REFERENCES
[1] M. Weiss, F. Baret, G. J. Smith, I. Jonckheere, and P. Coppin, “Review of methods forin situleaf area index (LAI) determination—Part II: Estima-tion of LAI, errors and sampling,”Agric. For. Meteorol., vol. 121, no. 1/2, pp. 37–53, 2004.
[2] G. L. Heritage and D. Hetherington, “The use of high resolution field laser scanning for mapping surface topography in fluvial systems,”Int. Assoc. Hydrol. Sci., vol. 291, pp. 269–277, 2005.
[3] M. Thies, N. Pfeifer, D. Winterhalder, and B. G. H. Gorte, “Three-dimensional reconstruction of stems for assessment of taper, sweep and lean based on laser scanning of standing trees,”Scand. J. For. Res., vol. 19, no. 6, pp. 571–581, 2004.
[4] C. Hopkinson, L. Chasmer, C. Young-Pow, and P. Treitz, “Assessing forest metrics with a ground-based scanning lidar,”Can. J. For. Res., vol. 34, no. 3, pp. 573–583, Mar. 2004.
[5] P. J. Watt and D. N. M. Donoghue, “Measuring forest structure with terrestrial laser scanning,”Int. J. Remote Sens., vol. 26, no. 7, pp. 1437– 1446, Apr. 2005.
[6] J. Warren-Wilson, “Estimation of foliage denseness and foliage angle by inclined point quadrats,”Aust. J. Bot., vol. 11, no. 1, pp. 95–105, 1963. [7] B. Kötz, M. Schaepman, F. Morsdorf, P. Bowyer, K. Itten, and
B. Allgöwer, “Radiative transfer modeling within a heterogeneous canopy for estimation of forest fire fuel properties,” Remote Sens. Environ., vol. 92, no. 3, pp. 332–344, 2004.
[8] G. W. Frazer, C. D Canham, and K. P. Lertzman, “Gap light analyzer (GLA), Version 2.0: Image-processing software to analyze true-color, hemispherical canopy photographs,”Bull. Ecol. Soc. Amer., vol. 81, no. 3, pp. 191–197, 2000.
[9] J. L. Lovell, D. L. B. Jupp, D. S. Culvenor, and N. C. Coops, “Using airborne and ground-based ranging lidar to measure canopy structure in Australian forests,”Can. J. Remote Sens., vol. 29, no. 5, pp. 607–622, 2003.
[10] F. Morsdorf, B. Kötz, F. Meier, K. I. Itten, and B. Allgöwer, “Estimation of LAI and fractional cover from small footprint airborne laser scanning data based on gap fraction,”Remote Sens. Environ., vol. 104, no. 1, pp. 50–61, Sep. 2006.