MODELING AND CONTROL OF QUARTZ CRYSTAL OPERATED IN LIQUID FOR BIO-SENSING APPLICATION
ABU ABDULLAH A. KADHIM FAHAD
A thesis submitted in fulfillment of the requirement for the award of the Master’s Degree of Mechanical Engineering
Faculty of mechanical and manufacturing engineering University Tun Hussein Onn Malaysia
ABSTRACT
vi
ABSTRAK
Aplikasi sensor pada masa kini merupakan salah satu cabang penyelidikan yang
boleh diaplikasikan dalam pelbagai bidang. Bio-sensor merupakan teknologi penting
dalam mengesan campuran samada terdiri daripada racun perosak mahupun senjata
biologi. Kebiasaannya, biosensor ini terdiri daripada makromolekul biologi yang
mampu bergerak di permukaan transduser isyarat. Apabila makromolekul yang
mengikat ligan dikesan, transduser isyarat akan mengesan perubahan dan mengukur
perubahan fizikal yang disebabkan proses peyatuan tersebut. Transduser biasanya
mengesan perubahan dalam rintangan, pH, haba, cahaya, atau jisim dan
kemudiannya menukar data tersebut kepada isyarat elektrik untuk dikumpul dan
diproses .Salah satu jenis pengesan adalah “Quartz Crystal Microbalance” (QCM).
QCM ini ialah sejenis peranti pengesan piezoelektrik yang berfungsi menghantar
isyarat elektrik melalui kristal kuarza yang disaluti emas dan kemudian
menyebabkan getaran pada frekuensi salunan. Kemudian QCM akan mengukur
kekerapan ayunan dalam kristal. QCM juga boleh berfungsi sebagai biosensor bagi
mengesan perubahan frekuensi kristal yang disebabkan oleh perubahan jisim di
permukaan kristal tersebut. Kajian ini juga merangkumi pembinaan perisian dengan
CONTENTS
TITLE PAGE
DECLARATION ii
DEDICATION iii
ACKNOWLEDGEMENT iv
ABSTRACT v
ABSTRAK vi
CONTENTS
vii
LIST OF FIGURES x
LIST OF TABLES xii
LIST OF ABBREVIATION AND SYMBOLS xiii
LIST OF APPENDIXS xv
CHAPTER 1 INTRODUCTION 1
1.1 Project Background 1
1.2 Problem Statements 2
1.3 Project Objectives 3
1.4 Project Scopes 3
viii
1.6 Research Significance 4
1.7 Summary 7
CHAPTER 2 LITERATURE REVIEW 8
2.1 Introduction 8
2.2 QCM Systems 11
2.3 Quartz Characteristics 13
2.4 Previous Studies 13
2.5 Summary 15
CHAPTER 3 METHODOLOGY 17
3.1 Introduction 17
3.2 Dissipation factor (D) 22
3.3 Resistance Measurement 22
3.4 Errors in the measurement of Rm 23
3.5 Noise in the measurement of Rm 23
3.6 Calibration of Rm 24
3.7 Z-match Method 25
3.8 Z-Factor of film material 26
3.10 Summary
CHAPTER 4 RESULTS AND DISCUSSIONS 32
4.1 Calculations software 32
4.2 Theoretical analyses of many biological substances depending upon experimental results 33
4.3 Theoretical approach to measure Beta Amyloid 1-42 peptide using QCM Sensors software program 38
4.4 Sensitivity of QCM sensors 42
4.5 Mass per unit area of Bio material in liquid 44
4.6 Resistance Measurement 46
CHAPTER 5 CONTROL THE PHYSICAL PROPERTIES 48
5.1 Introduction 48
5.2 Transfer Function and Block Diagram 49
5.3 Equivalent circuit model of QCM near resonance with additional impedance representing viscoelastic loading 56
CHAPTER 6 CONCLUSSTIONS AND RECOMMENDATIONS 61
6.1 Conclusions 61
6.2 Recommendations 62
REFERENCES 63
x
LIST OF FIGURE
NO. FIGURES PAGES
2.1 Schematic of QCM sensor array 11
2.2 Biological sensing method 12
3.1 Flow chart of the project 18
3.2 Sensors can be used for QCM 27
3.3 The proposed software for Bio-sensing 28
3.4 Typical testing measurements 30
4.1 QCM Sensor software program main screen 32
4.2 QCM Sensor software program flow chart 33
4.3 Output experimental results (ohms verses frequency of PAH bio substance), resonance frequency 19.5MHz 34
4.4 Output experimental results (ohms verses frequency of Protein G substance), resonance frequency 19.5MHz 35
4.5 Output experimental results (ohms verses frequency of Antibody), resonance frequency 19.5MHz 35
4.6 Output experimental results ((ohms verses frequency of AD Biomarker)), resonance frequency 19.5MHz 36
4.7 Z method results to calculate elastic film mass with different natural frequencies 39
4.8 Change in elastic film mass with change in frequencies 40
4.9 Deposit film thickness variations with different sensors frequencies 41
4.10 Variations of changes in mass of deposit material with change in natural frequencies 42
4.11 QCM sensors sensitivity with change in natural frequencies 43
4.13 Changes in many natural frequencies due to depositing the
same bio material 45
4.14 Change in loaded mass variations for different natural frequencies 46
4.15 Change of resistance with voltage in system of QCM 47
4.16 Variation of dRm/Vc in system of QCM 47
5.1 BVD equivalent circuit displaying both the parameters and impedance of the circuit elements 49
5.2 Bock diagram of QCM system 52
5.3 Bio-material depositing block diagram 52
5.4 Resonance circuit 53
5.5 MultiSIM software Circuit output in frequency domain 54
5.6 Output response to resonance circuit 55
5.7 Resonance circuit with 18.333 MHz 56
5.8 MultiSIM software Circuit output in frequency domain 58
5.9 Output response to resonance circuit 59
xii
LIST OF TABLES
NO. TABLE PAGES
1.1 QCM Applications 6
3.1
The theoretical sensitivity coefficient calculations 29 4.1 Change in oscillation frequencies due to viscoelastic behaviorof Biomaterial 37 4.2 Change in mass ∆m (ng/cm2) of different Bio material 37 4.3 Z method results to calculate elastic film mass with different
natural frequencies 39 4.4 Change in elastic film mass with change in frequencies 40 4.5 Deposit film thickness variations with different sensors frequencies 41 4.6 Variations of changes in mass of deposit material with change in
natural frequencies 42 4.7 QCM sensors sensitivity and change in deposited material with
natural frequencies 43 4.8 changes in many natural frequencies due to depositing
the same bio material 44 4.9 Change in loaded mass variations for different natural frequencies 45 4.10 Change of resistance with voltage and variation of dRm/Vc in
LIST OF ABBREVIATION AND SYMBOLS
f the observed frequency change, in Hz
m the change in mass per unit area, in g/cm2 Cf the sensitivity factor for the crystal
n number of the harmonic at which the crystal is driven
fo the resonant frequency of the fundamental mode of the crystal, in Hz
ρq density of quartz – 2.648 g cm-3
μq shear modulus of quartz - 2.947.1011 g.cm-1.s-2
ρf density of film material, in g/cm3
Tf thickness of the film, in cm
fu frequency of oscillation of unloaded crystal
ρq density of quartz – 2.648 g . cm-3
μq shear modulus of quartz- 2.947.1011 g.cm-1.s-2
ρL density of the liquid in contact with the electrode
ηL viscosity of the liquid in contact with the electrode
D Dissipation factor
Rm motional series resonance resistance, in Ω
Vc conductance voltage output, in V
Nq Frequency Constant for AT-cut quartz crystal: 1.668*1013 Hz. Å ρq density of quartz: 2.648 g . cm-3
ρf density of film material, in g . cm-3
fU Frequency of unloaded crystal (prior to deposition), in Hz fL Frequency of loaded crystal, in Hz
μq shear modulus of quartz: 2.947.1011 g . cm-1
xiv
μf shear modulus of film material
E lost the energy lost (dissipated) during one oscillation cycle
E stored the total energy stored in the oscillator.
fk the series resonance frequency f the parallel resonance frequency
Y( ) the total impedance in frequency domain G real part of admittance
B imaginary part of admittance
LIST OF APPENDIXS
NO. TITLE PAGES
CHAPTER 1
INTRODUCTION
1.1Project Background
The technical formula of Quartz-crystal is SiO2 and it is composed of two elements,
silicon and oxygen. In its amorphous form SiO2 is the major constituent in many
rocks and sand. The crystalline form of SiO2 or quartz is relatively abundant in
nature, but in the highly pure form required for the manufacture of quartz crystal units, the supply tends to be small.
Quartz crystals are an indispensable component of modern electronic technology. They are used to generate frequencies to control and manage virtually all communication systems. They provide the isochronous element in most clocks, watches, computers and microprocessors. The quartz crystal is the product of the phenomenon of piezo-electricity discovered by the Curie brothers in France in 1880 [1].
1.2Problem Statements
One of very promising applications of acoustic wave sensors is the measurement of small amounts of chemical and biological substances in liquids. A high sensitivity regarding mass loading is expected to be achieved due to the usage of shear waves because of their low interaction with the contacting fluid. As a consequence of their extraordinary properties quartz resonators can be found in all kinds of electronic devices, such as watches and computers to give an accurate time base, and as signal generators of reference systems in electronic devices.
Quartz resonators did not become of interest commercially until immediately prior to the world war. The development of new measurement technique represents one of the major driving forces in biotechnology that positively impact related research areas such as polymer characterization and biochemistry and is critical to the evolution of the pharmaceutical, biotechnology and biomaterial industries. Piezoelectric effect is a reversible of generation of internal electrical charges (or electrical field) in response to mechanical deformation of the material, or vice versa. Typically piezo sensors operate in dry conditions either in gases or a vacuum and are based on direct relationship of added mass and oscillation frequency given Sauerbrey equation.
3
1.3Project Objectives
This study embarks on the following objectives:
1. To study quartz crystal microbalance system, characteristics and properties.
2. To investigate the impedance spectra for AD Biomarker and Beta Amyloid 1-42 peptide antibodies using a developed modeling software.
3. To control the physical properties of the crystal based on the impedance characteristics by using Butterworth Van dyke (BVD) modeling software.
1.4Project Scopes
The scopes of this project are comprise the boundaries of project study. Many scopes should be bound in order to make this project achieve the objectives.
1. Develop a mathematical model for quartz crystal system, Crystal oscillation ranged between 5 to 30 MHZ.
2. Simulate the quartz crystal microbalance system by develop a suitable modeling software.
1.5Research Significance
The advantages that the QCM provides for development of the above domain areas is a sensitive detection capability for surface mass binding and a surface viscoelastic characterization capability for the bound mass, other distinct advantages of the QCM technique are the following:
1. The mass sensing technique eliminates the need for any specific labeling step to be part of the signal transduction mechanism.
2. Signal transduction via the piezoelectric mechanism operates well in complex, often optically opaque solution media.
3. The technique is capable of detecting subtle changes in the solution-surface interface that can be due to density-viscosity changes in the solution, viscoelastic changes in the bound interfacial material, and changes in the surface free energy, to name a few.
4. The electrochemical quartz crystal microbalance (EQCM) variant allows the investigator to apply a potential on the upper metal electrode, thereby creating an electrochemical cell, enabling electro chemical reactions or measurement of processes involving electron transfer. This provides interesting ways to create or probe surface bound mass as we describe in this review.
5. Finally, the technique is relatively easy to use, and the basic equipment is inexpensive to purchase. Although the QCM will not supplant high throughput array technologies for drug or biomaterials screening, it provides the realistic possibility of low throughput arrays, perhaps useful in secondary screening situations.
5
In this format, the QCM provides interesting ways to characterize the mass and visco-elastic properties of complex thin biopolymer films incorporating bimolecular systems at surfaces in the solution of choice, both during their formation and once formed and under perturbations in their environment.
Thus, the QCM technique becomes a useful adjunct to the development of future non-QCM array technologies. It has found use already as a gas phase chemical sensor and metal deposition sensor in vacuum applications and is being developed as a biosensor platform.
For these reasons, the technique is currently exhibiting rapid growth outside of its traditional development domain area of analytical chemistry and electro analytical chemistry.
A number of review articles have appeared in recent years that discuss the applications and technical issues involved in QCM use. They range from the perspective of QCM as a fundamental tool in analytical electrochemistry to comparative reviews focused on the newer application areas of biosensors and drug discovery.
Table 1.1: QCM Applications [9]
Military & Aerospace Communications Navigation IFF Radar Sensors Guidance systems Fuzzes Electronic warfare Sonobouys
Research & Metrology Atomic clocks
Instruments
Astronomy & geodesy Space tracking Celestial navigation Industrial Communications Telecommunications Mobile/cellular/portable radio, telephone & pager Aviation Marine Navigation Instrumentation Computers Digital systems CRT displays Disk drives Modems Tagging/identification Utilities Sensors Automotive
Engine control, stereo, clock
Trip computer, GPS
Consumer
Watches & clocks Cellular & cordless phones, pagers
Radio & hi-fi equipment Color TV
Cable TV systems Home computers VCR & video camera CB & amateur radio Toys & games Pacemakers
7
1.6Summary
Quartz crystals (SiO2) are an indispensable component of modern electronic
technology. They are used to generate frequencies to control and manage virtually all communication systems. It is the product of the phenomenon of piezo-electricity discovered by the Curie brothers in France in 1880.
Quartz crystal microbalance (QCM) sensors have become a valuable tool for the study of material properties with respect to fluids or solid films. The spectrum of applications related to the use of QCM sensors is continuously broadening, as it is evident from the ever increasing body of published articles in interdisciplinary scientific areas such as thin film materials, electrochemistry, and biosensors. Many scopes should be bound in order to make this project achieve the objectives including Derive the equations of liquid cell for single sided AT cut quartz crystal.
CHAPTER 2
LITERATURE REVIEW
2.1Introduction
In the last decade, a new analytical method for the in situ investigation of interfacial processes, including electrode processes, has emerged. This method, commonly referred to as the quartz crystal microbalance (QCM), has had a significant impact in numerous research programs. This includes electrochemists, for which the method is referred to as the electrochemical quartz crystal microbalance (EQCM).
These methods rely on the piezoelectric properties of quartz, in particular a single crystal of quartz that has been cut into a thin wafer at an angle of approximately 35 degrees with respect to the polar z-axis of quartz. The word piezoelectric derives from the word piezein, meaning to press. Hence, the piezoelectric effect hinges on "pressure electricity," a phenomenon first observed by Jacques and Pierre Curie when they discovered that mechanical stress applied to the surfaces of certain crystals, including quartz, resulted in an electrical potential across the crystal.
9
The quartz crystal microbalance earns its name from its ability to measure the mass of thin films that have adhered to its surface. The quartz crystal microbalance generally comprises a thin AT-cut quartz wafer with a diameter of (0.25 - 1.0) inches, sandwiched between two metal electrodes which are used to establish an electric field across the crystal. If an alternating electric field and appropriate electronics are used, the crystal can be made to oscillate at its resonant frequency. Most crystals of current interest resonate between (5 to 30 MHz).
The measured frequency is dependent upon the combined thickness of the quartz wafer, metal electrodes, and material deposited on the quartz crystal microbalance surface. Because the resonance is very sharp, high precision frequency measurements allow the detection of minute amounts of deposited material, as small as 100 picograms on a square centimeter. Mass changes occurring at the QCM surface result in frequency changes according to the well-established Sauerbrey equation, named after the pioneer of this technique for measurement of film thickness.
The signal transduction mechanism of the QCM technique relies upon the piezoelectric effect in quartz crystals, first discovered in 1880 by the Curie brothers, via a pressure effect on quartz. A change in inertia of a vibrating crystal was then shown by Lord Rayleigh to alter its resonant frequency, f. important subsequent developments were good crystal stability through the use of electric resonators and room-temperature stable AT-cut crystals. In 1959, the QCM was first used in a sensing mode when Sauerbray reported a linear relationship between the f decrease of an oscillating quartz crystal and the bound elastic mass of deposited metal.
Early chemical applications of QCM were to measuring mass binding from gas-phase species to the quartz surface. These represented some of the earliest chemical sensors for moisture and volatile organic compounds, and gas-phase chromatography detectors. In the 1980s, solution based QCM developed as new oscillator technology advanced to measure changes in frequency that could be related to changes in viscosity and density in highly damping liquid media.
The universal response of the device is the reason for the wide range of application of the technology. However, the downside of such universal sensitivity is that you always have a great danger of interferences. For analytical purposes, it is imperative to find ways of getting the QCM sensor to respond only to what you are interested in (i.e. build sensitivity into the device). This usually involves the addition of a sensitive layer on the surface of the crystal [4]. Organic polymers comprise the most common type of coating used with QCM sensors due to their capability to reversibly sorb vapors and liquids [5].
The relative importance of the mass-loading and viscoelastic contributions of the film to the observed QCM response is a subject that has yet to be resolved. In no area have the QCM applications seen such dramatic increase in recent years as in the field of biochemical analysis. QCM devices are routinely used as biochemical and immunological probes [6], as well as for the investigation and/or monitoring of biochemically significant processes. Sensitive, selective detection of biochemically active compounds can be achieved by employing antigen antibody [7], enzyme substrates and other receptor –protein pairs. The potential analytical use of these materials has been reviewed, particularly with respect to the development of biochemical sensors [8].
11
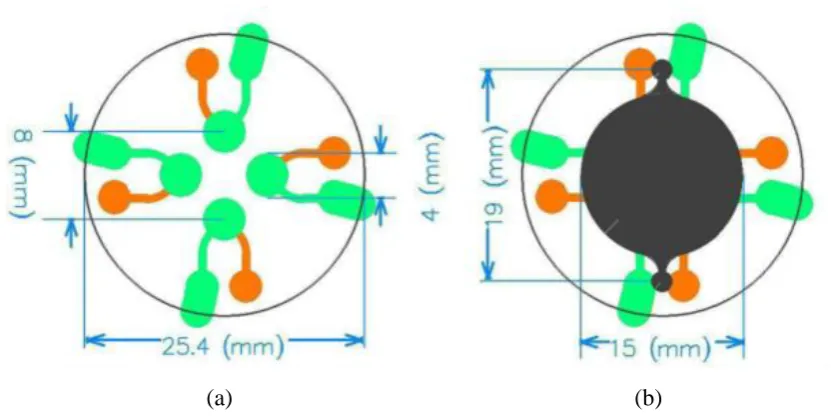
[image:23.595.111.527.68.277.2](a) (b)
Figure 2.1: Schematic of QCM sensor array (a) electrode layout and (b) electrodes superimposed by PDMS
2.2QCM Systems
QCM Systems are applied routinely by biologists and biochemists to obtain information about processes such as:
1. protein adsorption/desorption [10],
2. cell adhesion [11],
3. Protein-protein interaction,
4. Degradation of polymers,
5. bio fouling and bio film formation,
6. drug analysis [12] and
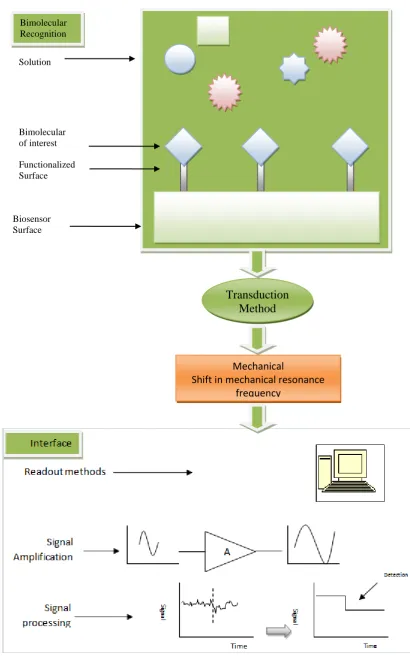
Figure 2.2: Biological sensing method Bimolecular
Recognition
Solution
Bimolecular of interest
Functionalized Surface
Biosensor Surface
Transduction Method
Mechanical
13
2.3Quartz Characteristics
Quartz is the only material known that possesses the following Combination of properties:
1. Piezoelectric ("pressure-electric"; piezein = to press, in Greek) 2. Zero temperature coefficient cuts exist
3. Stress compensated cut exists 4. Low loss (i.e., high Q)
5. Easy to process; low solubility in everything, under "normal" conditions, except the fluoride etchants; hard but not brittle
6. Abundant in nature; easy to grow in large quantities, at low cost, and with relatively high purity and perfection. Of the man-grown single crystals, quartz, at ~3,000 tons per year, is second only to silicon in quantity grown (3 to 4 times as much Si is grown annually, as of 1997).
2.4Previous Studies
Gabriel Ohlsson and Christoph Langhammer, (1991), discovered a novel device for nanometer-confinement of soft matter in one dimension (1D). This nanocell, with very large (up to 10(6):1) cell-radius to cell-height ratio, is tailored as an accessory for quartz crystal microbalance (QCM) and QCM with dissipation-monitoring (QCM-D) sensing , they studied internal and interfacial energy dissipation phenomena in highly confined (in 1D) soft matter and fluid films (patent pending).
The cell consists of two macroscopic plates (diameter of 9 mm), a top (the "lid") and a bottom (the QCM-D sensor), separated by appropriate spacers with heights ranging from below 100 nm up to 10 microm. The surfaces of both the lid and the bottom plate can be mechanically or/and chemically modified, prior to cell assembly, in order to tailor desired interfacial properties for the experiment. The cell is mounted on a standard QCM-D sensor, an AT-cut quartz crystal (the quartz crystal is cut at an angle of 35 degrees from its ZX-plane), forming the bottom plate. We illustrate theoretically and experimentally, as application examples, the use of this device for studies of dynamic mass loading and internal energy dissipation processes in thin films of ethylene glycol respective thin liquid crystal films around the nematic-isotropic phase transition.
Tatsuro Goda et.al, (2012), developed an integrated device comprising a quartz crystal microbalance (QCM) and a field-effect transistor (FET) with a single common gold electrode in a flow chamber. An alternating current inducing oscillations in the piezoelectric quartz of the QCM sensor is electrically independent of the circuit for the FET output so that the two sensors in different detection mechanisms simultaneously record binding kinetics from a single protein solution on the same electrode.
A conjunction of adsorbed mass from QCM with electric nature of bound protein from FET provided deeper understanding on a complex process of nonspecific protein adsorption and subsequent conformational changes at a solid/liquid interface.
15
surfaces mainly driven by hydrophobic association in an aqueous medium. The advanced features of the combined sensor including in situ, label-free, and real-time monitoring provide information on structural dynamics, beyond measurements of affinities and kinetics in biological binding reactions.
Z Parlak,et.al, (2013), described the physical understanding of a method which differentiates between the frequency shift caused by fluid viscosity and density from that caused by mass adsorption in the resonance of a quartz crystal resonator.
This method uses the normalized conductance of the crystal to determine a critical frequency at which the fluid mass and fluid loss compensates each other. Tracking the shift in this critical frequency allows us to determine purely mass adsorption on the crystal. They extended this method to Maxwellian fluids for understanding the mass adsorption in non-Newtonian fluids. They validate our approach by real-time mass adsorption measurements using glycerol and albumin solutions.
2.5Summary
The success of the QCM technique is due to its ability to sensitively measure mass changes associated with liquid-solid interfacial phenomena, as well as to characterize energy dissipative or viscoelastic behavior of the mass deposited upon the metal electrode surface of the quartz crystal.
QCM studies have provided detailed information about the functionalized surfaces developed for a range of biochip and biosensor applications. As example of QCM sensors was fabricated on a single disc of 1-inch (5 MHz) AT-cut quartz crystal sub-strate. Steven et al. fabricated a biosensor based on the use of the QCM for glucose detection using hexokinase immobilized within a poly (acrylamide) matrix.
(QCM) and QCM with dissipation-monitoring (QCM-D) sensing, they studied internal and interfacial energy dissipation phenomena in highly confined (in 1D) soft matter and fluid films (patent pending).
Z Parlak et al. (2013) described the physical understanding of a method which differentiates between the frequency shift caused by fluid viscosity and density from that caused by mass adsorption in the resonance of a quartz crystal resonator.
Tatsuro et al. (2012) developed an integrated device comprising a quartz crystal microbalance (QCM) and a field-effect transistor (FET) with a single common gold electrode in a flow chamber.
17
CHAPTER 3
METHODOLOGY
3.1Introduction
The piezoelectric transducers allowed a binding event to be converted into a measurable signal, (resonance frequency changes). The principle was based on the piezoelectric properties of quartz crystals. Piezoelectric devices were developed based on this principle. When it was included in an appropriate electronic circuit, the measured oscillation frequency was closed to the resonant frequency and the generated wave amplitude reached a maximum. Thus, a modification of a physical characteristic of the resonator, (the global mass or the thickness), led to a resonant frequency variation. For biosensors, mass changes, occurring from the interaction between the modified transducer surface and a detected species can be measured by this way. Several piezoelectric devices were developed based on this principle.
No
[image:30.595.117.431.61.776.2]Yes
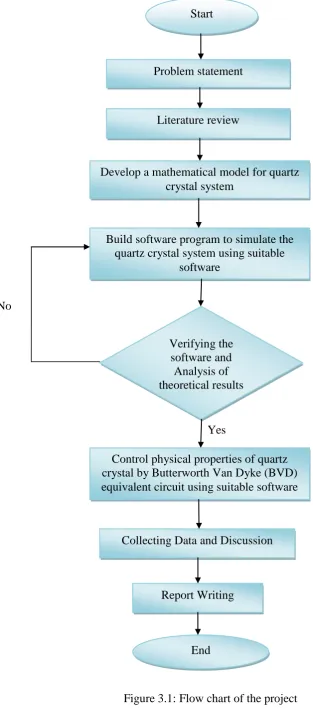
Figure 3.1: Flow chart of the project Start
Problem statement
Literature review
Build software program to simulate the quartz crystal system using suitable
software
Develop a mathematical model for quartz crystal system
Collecting Data and Discussion
End Verifying the
software and Analysis of theoretical results
Report Writing
19
Sauerbrey [17] was the first to recognize the potential usefulness of the Quartz Crystal Microbalance (QCM) technology and demonstrate the extremely sensitive nature of these piezoelectric devices towards mass changes at the surface of QCM electrodes. The results of his work are embodied in the Sauerbrey equation, which relates the mass change per unit area at the QCM electrode surface to the observed change in oscillation frequency of the crystal:
f = - Cf . m (3.1)
Where,
f - the observed frequency change, in Hz,
m - the change in mass per unit area, in g/cm2, and
Cf- the sensitivity factor for the crystal used (i.e. 56.6 Hz g-1cm2 for a 5MHz AT-cut quartz crystal at room temperature.)
The Sauerbrey equation relies on a linear sensitivity factor, Cf, which is a fundamental property of the QCM crystal. Thus, in theory, the QCM mass sensor does not require calibration. However, it must be kept in mind, that the Sauerbrey equation is only strictly applicable to uniform, rigid, thin-film deposits [18].
Vacuum and gas phase thin-film depositions which fail to fulfill any of these conditions actually exhibit more complicated frequency-mass correlations and often require some calibration to yield accurate results.
Sauerbrey’s equation (Equation 3.1) is often used to calculate mass loadings and thin-film thicknesses in vacuum depositions. The basic assumption is that the incremental change in mass from the foreign film is treated as though it were really an extension of the thickness of the underlying quartz, the foreign film is considered rigid and so thin that it does not experience any shear forces during vibration.
Cf = 2nfo2/(ρqμq)1/2 (3.2)
Where,
n - number of the harmonic at which the crystal is driven,
fo - the resonant frequency of the fundamental mode of the crystal, in Hz,
ρq - density of quartz – 2.648 g cm-3, and
μq - shear modulus of quartz - 2.947.1011 g.cm-1.s-2
The dependence of the frequency change on the mass coverage per unit area emphasizes the fact that, within certain limits, the sensitivity factor is independent of the electrode geometry. Thus, in theory, the QCM mass sensor does not require calibration for this application. This ability to calculate mass loading from first principles is obviously a very active feature of these devices. Film thickness is often the parameter of interest in gas-phase thin-film depositions. If the mass coverage is believed to be uniform, the thickness of the film is easily calculated dividing the mass per unit area provided by Sauerbrey’s equation by the material’s density:
Tf = Δm / ρf (3.3)
Where,
ρf - density of film material, in g/cm3,
Δm - change in mass per unit area, in g/cm2 (calculated from Sauerbrey’s equation),
Tf - Thickness of the film, in cm.
21
response of the QCM is still extremely sensitive to mass changes at the solid solution interface.
For many years, QCMs have been used in direct contact with liquids and/or viscoelastic films to assess changes in mass and viscoelastic properties during chemical and electrochemical surface processes. When the QCM comes in contact with a solution, there is a decrease in frequency that is dependent upon the viscosity and the density of the solution. A quantitative understanding of the resonator behavior is a prerequisite for proper interpretation of experimental results under total liquid immersion. This problem was first treated by Glassford [20], and later by Kanazawa and Gordon [21].
Kanazawa’s treatment of the influence of the solution properties on the crystal (equation 3.4) permits the prediction of the change in resonance frequency which accompanies immersion of the crystal into a viscous medium:
Δf = - fu3/2. [(ρLηL)/ (.ρqμq)]1/2 (3.4)
Where,
fu - frequency of oscillation of unloaded crystal,
ρq - density of quartz – 2.648 g . cm-3,
μq - shear modulus of quartz- 2.947.1011 g.cm-1.s-2,
ρL - density of the liquid in contact with the electrode, and
ηL - viscosity of the liquid in contact with the electrode.
3.2Dissipation factor (D)
A film that is "soft" (viscoelastic) will not fully couple to the oscillation of the crystal; hence the Sauerbrey relation will underestimate the mass at the surface. A soft film dampens the sensor's oscillation. The damping or energy dissipation (D) of the sensor's oscillation reveals the film's softness (viscoelasticity) so that energy dissipated per oscillation/2π total energy stored in system, D is defined as:
D = E lost /2π E stored (3.5)
Where,
D - energy dissipation
E lost - the energy lost (dissipated) during one oscillation cycle and
E stored - the total energy stored in the oscillator.
3.3Resistance Measurement
The QCM100 Analog Controller provides a Conductance 7 Voltage output (BNC port), that is related to the crystal’s motional series resonance resistance:
Rm = 10,000 · 10-Vc/5 -75 (3.6)
Where,
Rm - motional series resonance resistance, in Ω
23
3.4Errors in the measurement of Rm
Errors in the measurement of Rm will be less than 3Ω + 3% of Rm (for Rm < 2kΩ),
and are dominated by the departure of the voltage controlled attenuator from its nominal (voltage, gain) characteristic.
Keep also in mind that the resistance measurement in liquids and soft films is also affected by temperature, mostly through the temperature coefficient of the viscosity. For example, a 4Ω/°C drift in resistance is to be expected in water around room temperature.
3.5Noise in the measurement of Rm
Vc varies logarithmically with Rm over most of the range of interest. There is an
important advantage in this: the fractional resolution of the resistance is nearly independent of the resistance and so allows detailed and low- noise measurement of the viscous losses. To estimate the noise in resistance measurements, we can take the derivative of the equation for the motional resistance (units are Ohms and Ohms/Volt):
Rm = (10,000 ·10-Vc/5 -75)
d Rm / dVc = 10,000 · 10 –Vc/5 · ln (10) · (-1/5) (3.7)
= -2,000 · ln (10) · 10 –Vc/5 ≈ -4605 · 10 –Vc/5
≈ -0.4605 · (Rm + 75)
Noise on the Vc signal, Δ Vc, is typically ± 50μV (with one second averaging). The Rm for a 5MHz crystal in water is about 375Ω. The fractional noise in the resistance
Δ Rm / Rm = ΔVc · [d Rm / dVc] / Rm (3.8)
= Δ Vc · [-0.4605 · (Rm + 75)] / Rm
= ± 28 ppm.
This low noise floor for fractional resistance measurements allows very small changes in dissipation losses to be measured. This is also the reason why a high precision voltmeter (with at least six digits of resolution) is recommended for these measurements.
3.6Calibration of Rm
Resistance measurements for the QCM25 Crystal Controller/QCM100 are calibrated by replacing the crystal with a precision resistor in parallel with a 15pF capacitor. Two resistor values are used: 51.10Ω and 1.000kΩ. The equation for Rm may be
inverted to determine the calibration value for Vc. (Motional resistance, Rm, in Ω and
conductance voltage output, Vc, in volts.)
Rm = (10,000 · 10-Vc/5 - 75) (3.9)
Vc = 5 log [10,000 / (Rm + 75)] (3.10)
63
REFERENCES
[1] Kenneth A. M (2003), " Quartz Crystal Microbalance: A Useful Tool for Studying Thin Polymer Films and Complex Biomolecular Systems at the Solution-Surface Interface", American Chemical Society, vol. 4, no. 5.
[2] Johannsmann, Diethelm (1999), “Viscoelastic Analysis of Organic Thin
Films on Quartz Resonators", Macromol. Chem. Phys. 200.501.
[3] O’Sullivan, C. K., Guilbault, G. G. Biosens. Bioelectron. (1999), 14,663-670. Ballantine D. S., White R. M., Martin S. J, Rico A. J., Zellers E. T., Frye G. C. and Woltjen H.(1997), “Acoustic Wave Sensors: Theory, Design and
Physico-Chemical Applications”, Chapter 5 (Chemical and Biological Sensors), p. 222, Acad. Press, London, UK.
[4] Guilbault G.G. and Jordan J. (1964), “Analytical uses of piezoelectric
crystals”, CRC Reviews 19, p. 1-28. W. H. King, “Piezoelectric Sorption Detector”, Anal. Chem. 36 .1735.
[5] Iddo Ben-Dov and ItamarWillmer (1997), “Piezoelectric Immunosensors for
Urine Specimensof Chlamidia trachomatis Employing QCM Microgravimetric Analysis”, Anal. Chem.69 .3506.
[6] Hengerer A., Kösslinger1 C., Decker J., Hauck1 S., Queitsch I., Wolf H. and Dübel2 S. (1999), “Determination of Phage Antibody Affinities to Antigen by
a Microbalanc Sensor System”, BioTechniques 26:956-964.
[7] Guibault G. G. (1984), “Analytical uses of immobilized Enzymes: Modern
[8] Fredrik Hook, et. al. (1998), “Structural changes in hemoglobin during
adsorption to solid surfaces: effects of pH, ionic strength and ligand binding”, Proc. Natl. Acad. Sci. USA 95.12271.
[9] Wei W. Z. et. al. (1993), “Selective pharmaceutical analyis technique with
sensitive piezoelectric quartz sensors”, Anal. Lett. 26(11) .2371.
[10] Storri S., Santoni T., Mascini M. (1998),”A piezoelectric biosensor for DNA
hybridization detection”, Anal. Lett. 31(11) 1795.
[11] Sauerbrey G., Phy Z. (1959),” Verwendung von Schwingquarzen zur Wägung
dünner Schichten und zur Mikrowägung”, 155. 206.
[12] Steven J. L. and, Daniel A. B. (1989), "Sensors Based on Biomolecules Immobilized on the Piezoelectric Quartz Crystal Microbalance", Chemical Sensors and Microinstrumentation, 0(32387).
[13] Gabriel Ohlsson, Christoph Langhammer, Igor Zorić, Bengt Kasemo (1991),
"A nanocell for quartz crystal microbalance and quartz crystal microbalance with dissipation-monitoring sensing", Analytical Chemistry ; 63:2272--81. DOI: 10.1021/ac00020a015.
[14] Parlak Z., Biet C., Zauscher S. (2013), "Decoupling mass adsorption from fluid viscosity and density in quartz crystal microbalance measurements using normalized conductance modeling", Measurement Science and Technology, 24(8):085301. DOI:10.1088/0957-0233/24/8/085301.
[15] Tatsuro Goda, Yasuhiro Maeda, Yuji Miyahara (2012), "Simultaneous
monitoring of protein adsorption kinetics using a quartz crystal microbalance and field-effect transistor integrated device", Analytical Chemistry;
65
[16] Daniel Buttry (1991), “Applications of the QCM to Electrochemistry”, in A Series of Advancesin Electroanalytical Chemistry, edited by Allen Bard, Marcel Dekker, p. 23-33.
[17] Nomura T. and Okuhara M., Anal. Chim. Acta 142(1982) 281.
[18] Glassford A. P. M. (1978), “Response of a Quartz Crystal Microbalance to a
liquid Deposit”, J.Vac. Sci. Technol., 15(6) 1836.
[19] Keiji K. K. and Joseph Gordon II (1985), “Frequency of a Quartz
Microbalance in Contact with Liquid”, Anal Chem. 57(1985) 1770 Keiji Kanazawa K. and Joseph G. Gordon II, AnalyticaChimicaActa, 175.99-105.
[20] Denison D.R. (1971), “Linearity of a Heavily Loaded Quartz Crystal
Microbalance”, J. Vac. Sci. Technol. 10(1) (1973) 126 Klaus H. Behrndt, “Long Term Operation of Crystal Oscillators in Thin-Film Deposition”, J. Vac. Sci. technol. 8(5) 622.
[21] Pengchao Si, John Mortensen, Alexei Komolov, Jens Denborg, and Preben Juul Moller (2007), ”Poly- mer coated quartz crystal microbalance sensors for detection of volatile organic compounds in gas mixtures," Analytica Chimica Acta, Vol. 597, pp. 223-230.
[22] Lu C. and Lewis O. (1972), “Investigation of film-thickness determination by
oscillating quartz resonators with large mass load”, J. Appl. Phys. 43. 4385.
[23] Jaruwongrungsee et al. (2009), "Analysis of Quartz Crystal Microbalance Sensor Array with Circular Flow Chamber", INTERNATIONAL JOURNAL
OF APPLIED BIOMEDICAL ENGINEERING VOL.2, NO.2.
[25] Bizet K., Gabrielli C. and Perrot H. (1999), ” Biosensors based on piezoelectric transducers”,EDP Sciences, Wiley-VCH.
[26] Hani Mahmood Hussien and Mohammed Hadi Shinen, “Study the Sensitivity
of Quartz Crystal Microbalance (QCM) Sensor Coated with Different Thickness of Polyaniline for Determination Vapours of Ethano l, Propanol, Hexane and Benzene”, Department of General Science, College of Basic Education, University of Babylon, PO box 4 Iraq .
[27] Yeison Montagut1, José V. G., Yolanda Jiménez1, Carmen March2, Ángel Montoya2 and Antonio Arnau1, “QCM Technology in Biosensors”, 1Grupo de Fenómenos Ondulatorios, Departamento de Ingeniería Electrónica 2Instituto Interuniversitario de Investigación en Bioingeniería y Tecnología Orientada al Ser Humano (I3BH, Grupo de Inmunotecnología) Universitat Politècnica de Valéncia, Spain.
[28] Tsong-Rong Y., Chao-Fa L. and Hung-Che C., “QCM as Cell-Based
Biosensor”, Institute of Bioengineering, Tatung University Taiwan, R.O.C.
[29] Mohammad Tavakkoli, Sai R. Panuganti, Francisco M. Vargas, Vahid Taghikhani, Mahmoud Reza Pishvaie and Walter G. Chapman, “Asphaltene
Deposition in Different Depositing Environments: Part 1. Model Oil”,
Department of Chemical and Biomolecular Engineering, Rice University, Houston, Texas 77005, United States§Department of Chemical and Petroleum Engineering, Sharif University of Technology, Tehran, Iran.
[30] Bizet K., Gabrielli C. and Perrot H., “Biosensors based on piezoelectric
transducers”, UPR 15 du CNRS, Laboratoire de Physique des Liquides et Electrochimie, Université P. et M. Curie (Paris VI), 4, place Jussieu,75252 Paris cedex 05, France.
[31] Zhu L., Gao Y., Shen H., Yang Y., and Yuan L., Department of Chemistry, Shanghai Normal University, Shanghai, 200234, China, e-mail:
67
[32] Jennifer Hay, Agilent Technologies, Dr. Sabina Cherneva, “Institute of
Mechanics”, Bulgarian Academy of Sciences. In Vitro Complex Shear Modulus of Bovine Muscle Tissue (Steak).
[33] Holloway A.F., Nabok A., Thompson M., Ray A.K, Wilkop T., “Impedance
analysis of thickness shear mode resonator for organic vapor sensing”,
Nanotechnology Research Laboratories, school of Engineering, Sheffield hallam University,UK.
[34] Cassiede, J.L. Daridon , Paillol J.H. , Pauly J., “Characterization of the
behavior of a quartz Crystal resonator fully immersed in a Newtonian liquid by impedance analysis”, Laboratoire des Fluides Complexes et leurs Reservoirs, UMR 5150, BP 1155, 64013 pau cedex, France
[35] Klaara Kannisto , Lasse Murtomaki , Tapani viitala , “An impedance QCM
study on the partitioning of bioactive compounds in supported phospholipid bilayers” , Aalto University , School of chemical Technology , Department of Chemistry , PO BOX 16100, 00076 Aalto , Finland.
[36] Mohd Kamarulzaki Mustafa (2011), “Detection of Alzheimer’s Disease
![Table 1.1: QCM Applications [9]](https://thumb-us.123doks.com/thumbv2/123dok_us/8766224.896568/18.595.114.529.173.678/table-qcm-applications.webp)