STUDY AND SIMULATION OF DVB-T2 IRD PERFORMANCE FOR DIFFERENT TYPES OF CHANNELS
ALI ABDUALLAH W. ABOBAKER
A project report submitted in partial fulfillment of the requirements for the award of the degree of
Master of Electrical Engineering
Faculty of Electrical and Electronic Engineering Universiti Tun Hussein Onn Malaysia
v
ABSTRACT
ABSTRAK
vii
CONTENTS
TITLE i
DECLARATION ii
DEDICATION iii
ACKNOWLEDGEMENT iv
ABSTRACT v
ABSTRAK vi
CONTENTS vii
LIST OF TABLES ix
LIST OF FIGURES xi
LIST OF ABBREVIATION xiii
LIST OF SYMBOLS xiv
LIST OF APPENDICES xvi
CHAPTER 1 INTRODUCTION 1
1.1 Introduction 1
1.2 Problem Statement 4
1.3 Research objectives 4
1.4 Scope 5
1.5 Structure of project report 5
1.6 Summary 6
CHAPTER 2 LITERATURE REVIEW 7
2.1 Introduction 7
2.3 Selection of system parameters 19
2.4 Types of Channel Models 26
2.5 Doppler Effects 28
2.6 Calculation of Bit rate (Mbit/s) 28
2.7 Related work 31
2.8 Advantages and disadvantages 32
2.9 Summary 34
CHAPTER 3 RESEARCH METHODOLOGY 35
3.1 Introduction 35
3.2 Operational framework 35
3.3 Common Simulation platform (CSP) 37
3.4 CSP simulation steps 37
3.5 Summary 40
CHAPTER 4 RESULTS AND DISCUSSION 41
4.1 Introduction 41
4.2 Determine the best SNR for the IRD 41 4.3 Simulation of BER versus C/N performance. 45 4.4 Simulation for defined scenario 57
4.5 Summary 64
CHAPTER 5 CONCLUSION AND FURTHER WORK 65
5.1 CONCLUSION 65
5.2 FUTURE WORK 66
REFERENCES 68
ix
LIST OF TABLES
Table 1-1. Specific Standard of DVB-T2 across different countries [3] 3
Table 2-1: new improved options in DVB-T2 9
Table 2-2: Qldpc values 12
Table 2-3: Bit Interleaver structure 12
Table 2-4: Values of parameter Nsubstreamsalues 14
Table 2-5: OFDM parameters 15
Table 2-6: Elementary period as a function of bandwidth 16 Table 2-7: Duration of Guard Interval of elementary period T 16
Table 2-8: IRD DVB-T2 specification 18
Table 2-9: distance between Tx 20
Table 2-10: FTT size 20
Table 2-11: Total number of BIT for different constellations 23 Table 2-12: Overview of different pilot patterns in DVB-T2 24
Table 2-13: Code Rate 25
Table 2-14: DVB-T2 Capacity 29
Table 2-15: Summary of systems parameters of related works 31
Table 3-1: Scenario for IRD DVB-T2 parameters 38
Table 4-1: Results of estimated SNR for each scenario in Gaussian
channel (AWGN) 40
Table 4-2: Results of estimated SNR for each scenario in Rician
channel (Fixed) 41
Table 4-3: Results of estimated SNR for each scenario in Rayleigh
channel (Portable) 42
Table 4-5: Required C/N for BER=10-5 in Rayleigh Channel
(Portable channel), 32k mode 59
Table 4-6: Required C/N for BER=10-5 in Gaussian Channel
(AGWN Channel), 32k mode 59
Table 4-7: Required C/N for BER=10-5 in Rician Channel
xi
LIST OF FIGURES
Figure 1.1 Digital TV Standard in the World (dtvstatus.com, 2013) 3 Figure 2.1: DVB-T2 simulated end-to-end system block diagram 10 Figure 2.2: (a) BBFRAME format and (b) FECFRAME format [9] 11 Figure 2.3: Bit interleaving scheme for normal FECFRAME length
and 16QAM 13
Figure 2.4: Demultiplexing of bits into sub-streams 13 Figure 2.5: Time interleaving scheme for normal FECFRAME 15
Figure 2.6: PLP concept 17
Figure 2.7: Effect of GI in DVBT-2 19
Figure 2.8: Effect of FFT size in DVB-T2 21
Figure 2.9: (a) Rotated and classic QPSK constellations (b) Rotated and classic 16-QAM constellations. The red square points and blue
circles show the conventional and rotated constellation respectively [1]. 22 Figure 2.10: Structure of the SISO scattered pilot pattern a) PP2 b)
PP4 and c) PP8 [5] 24
Figure 2.11: Illustration of the effect of code rate 25
Figure 2.12: Illustration of Gaussian channel 26
Figure 2.13: Illustration of Rician Channel 27
Figure 2.14: Illustration of Rayleigh channel 28
Figure 2.15: DVB-T2 versus DVB-T 33
Figure 3.1: Flow chart of operational framework 35 Figure 3.2: Top-level directory structure for CSP- DVB-T2 36
Figure 4.1: BER Vs SNR (dB) for QPSK 44
Figure 4.2: BER Vs SNR (dB) for 16-QAM 45
Figure 4.3: BER vs SNR (dB) for 64-QAM 46
Figure 4.4: BER vs SNR (dB) for 256-QAM 46
Figure 4.5: BER vs SNR (dB) for QPSK 47
Figure 4.6: BER vs SNR (dB) for 16-QAM 48
Figure 4.7: BER vs SNR (dB) for 64-QAM 49
Figure 4.8: BER vs SNR (dB) for 256-QAM 50
Figure 4.9: BER vs SNR (dB) for QPSK 51
Figure 4.10: BER vs C/N (dB) for 16-QAM 52
Figure 4.11: BER vs C/N (dB) for 64-QAM 53
Figure 4.12: BER vs C/N (dB) for 256-QAM 54
Figure 4.13: BER performance for AWGN, Rician and Rayleigh channel, 32k mode, code rate 5/6, guard interval 19/256, LPDC
64000, 8MHz channel bandwidth 56
Figure 4.14: BER vs C/N (dB) for 256-QAM, Rayleigh channel
rotated and non-rotated constellation 57
Figure 4.15: BER vs C/N (dB) for 256-QAM, Rician channel rotated
and non-rotated constellation 57
Figure 4.16: BER vs C/N (dB) for 256-QAM, Gaussian channel rotated
and non-rotated constellation 58
Figure 4.17: BER vs C/N (dB) for QPSK, Rayleigh channel rotated and
non-rotated constellation 59
Figure 4.18: BER performance for defined scenario versus scenario
xiii
LIST OF ABBREVIATION
AGWN - Additive White Gaussian Noise
BCH - Bose-Chaudhuri-Hocquengham
BER - Bit Error Ratio
BBFRAME - Base Band Frame C/N - Carrier-to-Noise Ratio
C/R - Code Rate
CSP - Common Software Platform
DTT - Digital Terrestrial Television DVB-C - Digital Video Broadcasting-Cable DVB-H - Digital Video Broadcasting-Handheld DVB-S - Digital Video Broadcasting-Satellite DVB-T - Digital Video Broadcasting-Terrestrial DVB-T2 - DVB-2nd Generation Terrestrial
ETSI - European Telecommunications Standards Institute FEC - Forward Error Correction
FECFRAME - Forward Error Correction Frame FFT - Fast Fourier Transform
GI - Guard Interval
HDTV - High DTV
IFFT - Inverse Fast Fourier Transform IRD - Integrated Receiver Decoder LDPC - Low Density Parity Check
OFDM - Orthogonal Frequency Division Multiplexing PLP - Physical Layer Pipes
SFN - Single Frequency Network SNR - Signal to Noise Ratio
xv
f
v
R s
n
CR
1
CR
RS
T U
T S
R U
N ldpc
tc
LIST OF SYMBOLS
- Shift in frequency - Speed of light
- Angle of incidence of echo - Symbol rate
- Number of bit per carrier - Inner code rate
- Reed Solomon code rate
- Duration of useful symbol
- Symbol duration
- Useful net data rate
- Length if LDPC
LIST OF APPENDICES
CHAPTER 1
INTRODUCTION
1.1 Introduction
according to two modes of operation: 2K mode and 8K mode. Just like the DVB-T, DVB-T2 uses OFDM modulation with a large number of sub-carriers. It uses low density parity check (LDPC) coding combined with Bose-Chaudhuri-Hocquengham (BCH) coding which offers a robust signal. In addition, it offers the ability to adjust the number of carriers, guard interval sizes and pilot signals which helps to optimise the overheads for any target transmission channel. The features of T and DVB-T2 are shown in Table 2.1. Features such as advanced and more flexible coding systems, constellation rotation, extended OFDM, various guard intervals and flexible pilot patterns makes DVB-T2 standard an ideal candidate for high definition television broadcasting (HDTV) networks [1].
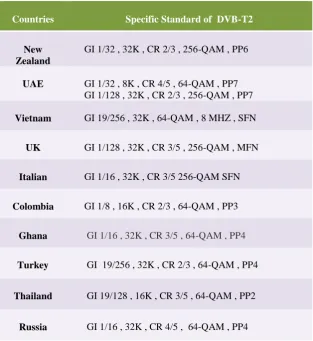
Furthermore, several countries have taken steps to switch over from analogue to digital broadcasting based on the International Telecommunication Union (ITU) 2006 directive [2]. The ITU agreed on switchover from analogue to digital broadcasting by 2015 because it will open up new distribution networks and enlarge the opportunities for wireless innovation and services. To this ends, different countries have taken step to change to DVB-T2 although many are yet to implement due to technical challenges as indicated in [2]. Figure 1.1 shows the status of digital TV standard in the world and Table 1.1 shows the specified DVB-T2 standard adopted in different countries. In June 2014, version-1 of DVB-T2 Integrated Receiver Decoder (IRD) technical specification for ASEAN countries was released with the objective of reaping the benefits of economies of scale for affordable DVB-T2 IRDs so as to facilitate the adoption of digital TV in (Association of Southeast Asian Nations) ASEAN members’ countries.
3
Figure 1.1 Digital TV Standard in the World (dtvstatus.com, 2013)
Table 1-1. Specific Standard of DVB-T2 across different countries [3]
Countries Specific Standard of DVB-T2
New Zealand
GI 1/32 , 32K , CR 2/3 , 256-QAM , PP6
UAE GI 1/32 , 8K , CR 4/5 , 64-QAM , PP7 GI 1/128 , 32K , CR 2/3 , 256-QAM , PP7
Vietnam GI 19/256 , 32K , 64-QAM , 8 MHZ , SFN
UK GI 1/128 , 32K , CR 3/5 , 256-QAM , MFN
Italian GI 1/16 , 32K , CR 3/5 256-QAM SFN
Colombia GI 1/8 , 16K , CR 2/3 , 64-QAM , PP3
Ghana GI 1/16 , 32K , CR 3/5 , 64-QAM , PP4
Turkey GI 19/256 , 32K , CR 2/3 , 64-QAM , PP4
Thailand GI 19/128 , 16K , CR 3/5 , 64-QAM , PP2
[image:16.595.162.476.393.735.2]1.2 Problem Statement
To meet the requirement of the DVB-T2 standard, the communication channel plays a very important role. The communication channels are subject to different environmental factors such as multipath propagation and echoes from object which leads to delayed signal arrivals. The multipath propagation causes fading, a phenomena that alters the amplitude, phase of the transmitted wave at the receiver due to delay in transmitted signal. In addition, DVB-T2 supports a large number of options such as (Pilot Patterns, Guard Interval Fraction, Rotated Constellations, FFT sizes) that can be chosen to optimise system suitable for different uses, from low data rate mobile services, to HDTV program broadcasting in fixed reception.
Furthermore, in June 2014, version-1 of DVB-T2 Integrated Receiver Decoder technical specification for ASEAN was released with the objective of reaping the benefits of economies of scale for affordable DVB-T2 IRDs in ASEAN so as to facilitate the adoption of digital TV in ASEAN members’ countries [4]. There is currently to paper published to investigate the performance of the DVB-T2 mode/parameters specified in the technical specification under the different channel models for the IRD. The performance in terms of bit error rate and carrier to noise ratio (C/N) under the different channels AWGN, Rician and Rayleigh needs to the simulated so as to ascertain what parameters give best performance in terms of BER and SNR.
1.3 Research objectives
The research objectives are as follows:
(1) To determine the best SNR for the IRD specification for the Gaussian, Rician and Rayleigh channel models through simulation.
5
(3) To compare and analyse the BER versus SNR performance from the simulated result using the different channel model and different parameters such as code rates, modulation type, guard interval and effect of rotation of modulation scheme as specified in Table 2.2 4) To compare and analyse the BER vs SNR for defined scenario and
existing scenario from [5, 6].
1.4 Scope
The scope of this project is presented here. First the project work will cover study and understanding through literature the basic theory of channel models, DVB-T2 system and associated parameters. In addition the Common simulation platform (CSP) developed for DVB-T2 will be studied to know how to simulate and plot results. Thereafter, simulation of the DVB-T2 system using the parameters defined specified in Table 2.1 will be carried out. The simulation will be carried out using Matlab and CSP tool box developed for DVB-T2 standard. The results of the simulation will be presented, followed by analysis and discussion. The finding of the result will be presented in this project report.
1.5 Structure of project report
In chapter 2 covers the literature review of this project. A comparison of the DVB-T and DVB-T2, basic principle of the DVB-T2 system and parameters was presented. Related works of the performance analysis from the literature
was also presented. Chapter 3 covers the methodology of this project. The
using some parameters form IRD specification. The results of the defined
scenario was also compared with scenario from reference literature. Chapter 4
is the result and discussion. The result of from the two stages of simulation was presented in graphical forms and tabular forms were necessary. Analysis were
made based on the BER and C/N performance. Finally chapter 5 concluded this
report and future works were suggested.
1.6 Summary
CHAPTER 2
LITERATURE REVIEW
2.1 Introduction
In this section, the background study for DVB-T and DVB-T2 is provided. The limitation of DVB-T and enhancement in DVB-T2 are highlighted. The system model of DVB-T2 and system parameters are presented. The use of OFDM technique in achieving high bit rates in DVB-T2 transmission is discussed. In addition, related works in literature is reviewed.
2.2 Background study
In this section, the basic theory of the DVB-T and DVB-T2 is provided. This includes the difference between DVB-T and DVB-T2, basic principles of DVB-T2 operations and selection of parameters.
2.2.1 DVB-T
recovery in all the serviced areas. The digital data sequences, which contain MPEG video, audio and other information streams, are transmitted using coded orthogonal frequency division multiplexing (COFDM) modulation. The information bits are coded, interleaved, mapped to a quadrature amplitude modulation (QAM) constellation and grouped into blocks. All the symbols in a block are transmitted simultaneously at different frequency subcarriers using an inverse fast Fourier transform (IFFT) operation. The number of IFFT points, which can be either 2048 (2K) or 8192 (8K), determines the transmission mode and the number of the available subcarriers in the transmission bandwidth. Some of these subcarriers are not used to allow for guard frequency bands whereas others are reserved for pilot symbols, which are necessary to acquire the channel information required for signal recovery. DVB-T was seen to offer many benefits, however certain limitations were faced when compared with new wireless transmission techniques. The limitations include low bit rates and transmission channels, inability to support the broadcast of high-definition television (HDTV) services using same frequency spectrum. The DVB-T had a very bad performance in mobile or portable environments, so it could not be properly implemented in scenarios such as moving vehicles. Last but not least, the deployment of the DVB-T network has been and still is a true nightmare in single frequency networks (SFN) scenarios, where interferences between repeaters, which transmit the same information on the same frequency bands, may destroy the received signal avoiding its reception in areas with good reception levels. As a result of this limitations, and the advances in signal processing, modulation and coding, the DVB consortium published a draft standard named DVB-T2 aiming to extend the capabilities of the aforementioned DVB-T standard. The DVB-T2 Standard is discussed is the next section.
2.2.2 DVB-T2
9
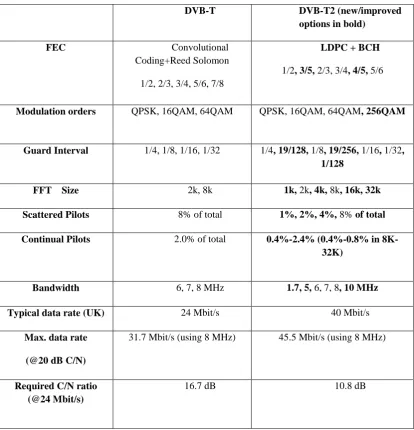
[image:22.595.112.527.267.698.2]standard were to achieve more bit-rate compared to the first generation DVB-T standard, targeting HDTV services, improve SFN, provide service specific robustness, and target services for fixed and portable receivers. As a result of the work carried inside the DVB organization the DVB-T2 specification was released in June 2008 [8]. The DVB-T2 was designed to allow for some mobility, with the same spectrum characteristics as DVB-T. Table 2.1 shows the comparison of DVB-T and DVB-T2 standard specification. The table shows the new improved options in DVB-T2.
Table 2-1: new improved options in DVB-T2
DVB-T DVB-T2 (new/improved options in bold)
FEC Convolutional Coding+Reed Solomon
1/2, 2/3, 3/4, 5/6, 7/8
LDPC + BCH
1/2, 3/5, 2/3, 3/4, 4/5, 5/6
Modulation orders QPSK, 16QAM, 64QAM QPSK, 16QAM, 64QAM, 256QAM
Guard Interval 1/4, 1/8, 1/16, 1/32 1/4, 19/128, 1/8, 19/256, 1/16, 1/32, 1/128
FFT Size 2k, 8k 1k, 2k, 4k, 8k, 16k, 32k
Scattered Pilots 8% of total 1%, 2%, 4%, 8% of total
Continual Pilots 2.0% of total 0.4%-2.4% (0.4%-0.8% in 8K-32K)
Bandwidth 6, 7, 8 MHz 1.7, 5, 6, 7, 8, 10 MHz
Typical data rate (UK) 24 Mbit/s 40 Mbit/s
Max. data rate
(@20 dB C/N)
31.7 Mbit/s (using 8 MHz) 45.5 Mbit/s (using 8 MHz)
Required C/N ratio (@24 Mbit/s)
2.2.3 Implementation of DVB-T2
Several countries have adopted and implemented the DVB-T2 according to the ITU directive. Because DVB-T2 has a lot of options, different countries have specified standards. The summary of the standard are shown in Table
2.2.4 Overall DVB-T2 system model
FEC
(BCH/LDPC) Bit
interleaver Demux
Mapping into Constellation Cell interleaver Time interleaver frame adaptation Time De- interleaver Bit De-Interleaver FEC Decoding (LDPC/BCH)
IFFT interval Guard insertion BER calculation Multipath Channel AGWN Guard interval Removal FFT Channel Equalizer Frame demapping Cell De- interleaver Demapping
into - cells Mux
PLP
[image:23.595.115.530.247.523.2]PLP BER calculation
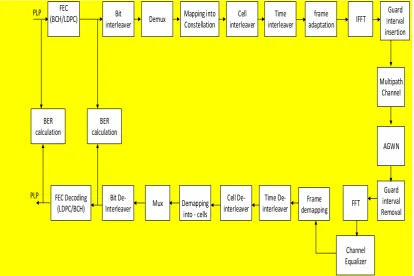
Figure 2.1: DVB-T2 simulated end-to-end system block diagram
The block diagram shown in Figure 2.1 shows the overall model of the DVB-T2. The FEC, bit interleaver, Demux, Mapping into constellation, cell interleaver, time interleaver are subsystem that are part of the Bit Interleaved Coding & Modulation. The description of each of the blocks are presented as follows.
2.2.4.1 FEC
11
Outer Encoding (BCH) – in the outer encoder, Bose – Chaudhuri – Hocquenghem (BCH) is applied to the BBFRAME to generate an error protected packet.
Inner Encoding (LDPC) – the Low Density Parity Check are applied in the inner encoder in DVB-T2 because of its high error correcting performance. The encoding process starts with appending the parity check bits (BCHFEC) of the BCH outer code after BBFRAME. Then the parity check bits (LDPCFEC) of the LDPC inner code is appended after the BCHFEC. As a result, Error correction coded FECFRAME is obtained output of the inner encoder. The BBFrame and FECFRAME are shown in Figure 2.2.
BBHeader Data Field Padding
80 bits DFL KBCB-DFL-80
KBCH bits
(a)
BBFRAME BCHFEC LDPCFEC
KBCH NBCH-KBCH NLDPC-KLDPC
NLDPC bits
[image:24.595.151.523.178.465.2](b)
Figure 2.2: (a) BBFRAME format and (b) FECFRAME format [9]
The FECFRAME has two different length Nldpc values which are normal FECFRAME = 64,800 and short FECFRAME = 16,200.
2.2.4.2 Bit Inter-leaver
Bit inter-leaving is used to disperse burst errors and uncorrelated the bits associated with given transmitted symbol. The bit interleaving is only applied to 16-QA modulation, 64-16-QAM modulation and 256-16-QAM modulation. The output pf the LPDC interleaving consist of parity interleaving followed by twist column interleaving. The interleaving process is described below:
First the parity interleaving is achieved by: 0
i i ldpc
360 .
Kldpc t s Kldpc Qldpc s t
U (2.2)
Where Qldpc is defined in Table 2.2, is the output of LDPC and U is the output of the inter-leaver.
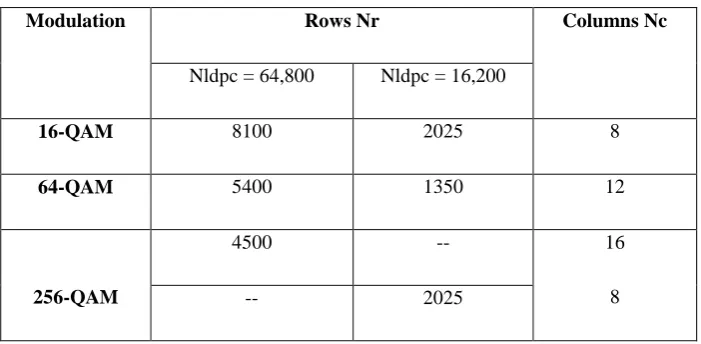
[image:25.595.146.491.239.462.2]Secondly, the output of the parity inter-leaver is written into column-twist inter-leaver as column wise by using the twisting parameter tc as the starting index of the column. After that, the data are read out row-wise as shown in Figure 2.3.
Table 2-2: Qldpc values
Code rate Qldpc for normal
FECFRAME
Qldpc for short
FECFRAME
1/2 90 25
3/5 72 18
2/3 60 15
3/4 45 12
4/5 36 10
5/6 30 8
[image:25.595.144.495.537.709.2]The column twist interleaving configuration for each modulation format is specified in Table 2.3
Table 2-3: Bit Interleaver structure
Modulation Rows Nr Columns Nc
Nldpc = 64,800 Nldpc = 16,200
16-QAM 8100 2025 8
64-QAM 5400 1350 12
256-QAM
4500 -- 16
8
13
Figure 2.3: Bit interleaving scheme for normal FECFRAME length and 16QAM
2.2.4.3 Demux
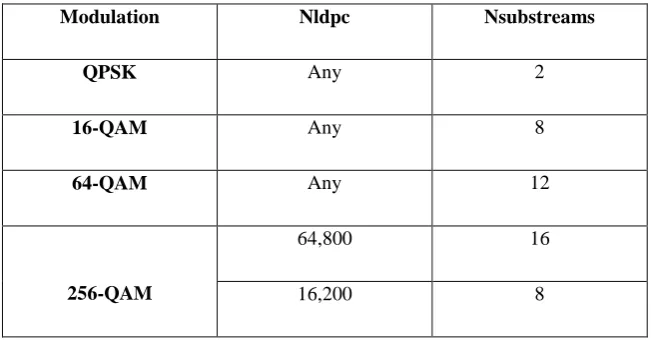
The demultiplexer demultiplex the interleaved FECFRAME into parallel cell words which are then mapped into constellations. In the demux process, the output bit stream of the bit interleaving is demultiplexed into Nsubstreams sub-streams as shown in Figure 2.4 and the values of Nsubstreams is defined in table 3.15.
[image:26.595.146.466.519.653.2]Table 2-4: Values of parameter Nsubstreamsalues
Modulation Nldpc Nsubstreams
QPSK Any 2
16-QAM Any 8
64-QAM Any 12
256-QAM
64,800 16
16,200 8
2.2.4.4 Mapping into constellation
The parallel cell words from the demultiplexer are mapped into constellation values.
2.2.4.5 Cell inter-leaver
In the Cell inter-leaver, the cells in the FEC code word is spread uniformly. The main purpose of this process is to ensure an uncorrelated distribution of channel distortions and interference along the FEC code word at the receiver. The cell interleaver is defined as follows
2.2.4.6 Time inter-leaver
15
Figure 2.5: Time interleaving scheme for normal FECFRAME length and 16QAM
2.2.4.7 IFFT
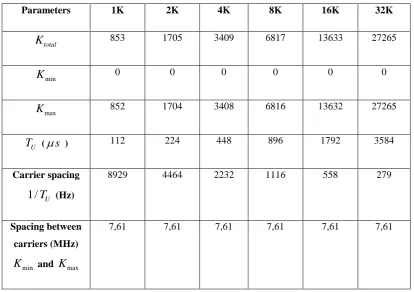
In DVB-T2 systems there are six different transmission modes also known as FFT size. The transmission modes are 1K, 2K, 4K, 8K, 16K and 32K. A DVB-T2 transmitted signal is organized in frames. Each frame has duration of TF and consists of OFDM symbols. NT2 frames constitute one super frame. Each symbol is constituted by a set of Ktotal carriers and has duration of TS. A carrier is composed of two parts which are useful part with duration TU and guard interval with duration Δ. Some important OFDM parameters are given in Table 2-5.
Table 2-5: OFDM parameters
Parameters 1K 2K 4K 8K 16K 32K
total
K 853 1705 3409 6817 13633 27265
min
K 0 0 0 0 0 0
max
K 852 1704 3408 6816 13632 27265
U
T (s ) 112 224 448 896 1792 3584
Carrier spacing
1/TU (Hz)
8929 4464 2232 1116 558 279
Spacing between
carriers (MHz)
min
K and Kmax
[image:28.595.112.527.478.770.2]2.2.4.8 Guard interval insertion
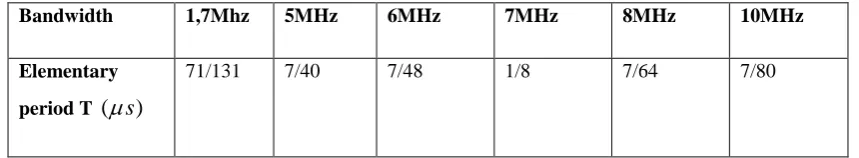
[image:29.595.110.540.260.339.2]The Guard interval are inserted to avoid inter symbol interference. DVB-T2 systems have seven guard interval fractions. For each combination of FFT size and guard interval fractions, the absolute guard interval fractions are given in Table 2-7 expressed in multiples of the elementary period T which is also given in Table 2-6.
Table 2-6: Elementary period as a function of bandwidth
Bandwidth 1,7Mhz 5MHz 6MHz 7MHz 8MHz 10MHz
Elementary
period T (s)
71/131 7/40 7/48 1/8 7/64 7/80
[image:29.595.115.527.408.650.2]
Table 2-7: Duration of Guard Interval of elementary period T
FFT size
Guard Interval fraction ( / TU)
1/128 1/32 1/16 19/256 1/8 19/128 1/4
32K 256T 1024T 2048T 2432T 4096T 4864T NA
16K 128T 512T 1024T 1216T 2048T 2432T 4096T
8K 64T 256T 512T 608T 1024T 1216T 2048T
4K NA 128T 256T NA 512T NA 1024T
2K NA 64T 128T NA 256T NA 512T
17
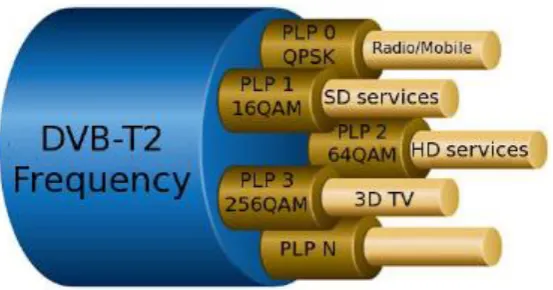
2.2.4.9 Physical layer pipe
[image:30.595.159.436.234.379.2]DVB-T2 uses the concept of physical layer pipe (PLP). The PLP allows for service-specific robustness. Every PLP can have its own modulation, FEC code rate and interleaving. All PLPs are broadcast over the same frequency so that it is considered as a single DVB-T2 channel. Figure 2.5 gives an illustration of PLP the concept.
Figure 2.6: PLP concept
2.2.5 DVB-T2 system parameters
[image:31.595.113.490.298.713.2]The DVB-T system parameters are shown in Table 1.2. The forward error correction (FEC) techniques used in the LDPC which offers a significant improvement compared to convolution error correcting scheme used in DVB-T. The FFT size represents different modes which are symbol carriers. Higher value of FFT size 16k and 32k were introduced to increase the length of the guard interval without decreasing spectral efficiency. The modulation order are the constellation sizes. The DVB-T2 operating modes specified in [4] for IRD is shown below shown in Table 2.2.
Table 2-8: IRD DVB-T2 specification
Parameter Required modes
Transmission mode 32K Normal & Extended
Constellation QPSK, 16QAM, 64QAM, 256QAM
Constellation Rotation Rotated and Non Rotated
Code Rate 1/2, 3/5, 2/3, 3/4, 4/5, 5/6
Guard Interval 19/128, 1/8, 19/256, 1/16, 1/32, 1/128
Pilot Pattern PP1, PP2, PP3, PP4, PP5, PP6, PP7 and PP8
Antenna SISO & MISO
PAPR No PAPR & TR-PAPR
FEC Frame Length 16200 & 64800
Input Mode Input Mode A & B (Single PLP, Multiple PLP)
19
2.3 Selection of system parameters
2.3.1 Selection of guard interval (GI)
The GI consists of cyclic continuation of the useful symbol and is inserted before every useful symbol. This enables the reception of multiple signals at the receiver, therefore enabling frequency re-use via single frequency networks. The length of the GI determines the separation distance between adjacent transmission sites operating in SFN. Figure 2.3, illustrates the effect of GI in the DVB-T2 transmission. As the GI reduces, there is decrease in separation distance between transmission sites thereby leading to increase in capacity.
1/4
19/128
1/8
19/256
1/16
1/32
1/128
Increase in separation distance between Tx
sites
[image:32.595.168.466.314.592.2]Increase in capacity
Figure 2.7: Effect of GI in DVBT-2
The distance between the transmitters can be computed using the formula as follows:
( * U) *c
D GI T
(2.3)
Table 2-9: Distance between Tx
Distance between the transmitters (D)
Guard Interval
( GI )
FFT Size
8K 32K
Maximum Distance 1/4 76.200 Km 268.8 Km
Minimum distance 1/128 2.1 Km 8.4 Km
2.3.2 Selection of Fast Fourier Transform (FFT) Size
The FFT indicates the number of carriers modulated within the channel bandwidth as shown in Table 2.7.
Table 2-10: FTT size
FFT size Duration Time – Tu(s) Number of carriers in normal mode
1k 112 853
2k 224 1705
4k 448 3409
8k 896 6817
16k 1792 13633
32k 3584 27265
[image:33.595.115.526.387.659.2]21
causes inter carrier interference. For instance, mobile reception at high speed 2k FFT will be implemented. The SFN transmit separation distance increases as the FFT size increases however, there is a decrease in Doppler performance as shown in the Figure 2.7.
32k
16k
8k
4k
2k
1k
Increase in SFN Tx separation distance Decrease in Doppler performance
[image:34.595.162.492.150.414.2]Increase in Doppler performance Decrease in SFN Tx distance
Figure 2.8: Effect of FFT size in DVB-T2
2.3.3 Selection of constellation and effects of rotation and non-rotation
different carriers and time slots. Hence, if any of the components is affected by deep fading of the channel, the other component can be used to recover the transmitted symbol or information. The implementation of the rotated constellation in DVB-T2 is described in [1]. Table 2.8 shows the number of bits for each constellation in DVB-T2.
Figure 2.9: (a) Rotated and classic QPSK constellations (b) Rotated and classic
23
Table 2-11: Total number of BIT for different constellations
DVB-T2 Constellations Number of Bits (n) Rotation angle (degrees)
QPSK 2 29.0
16-QAM 4 16.8
64-QAM 6 8.6
256-QAM 8 atan(1/16)
2.3.4 Selection of pilot pattern
In the coded OFDM system, a large number of closely orthogonal carriers are used to carry data on several parallel channels. Small number of the carriers are allocated to estimate pilot tones which are used to estimate the channel. The DVB-T2 supports eight different pilot patterns. The selection of pilot patterns depends on the selected system configuration and transmission mode: either SISO (Single input single output) or MISO (Multiple input single output).
Figure 2.10: Structure of the SISO scattered pilot pattern a) PP2 b) PP4 and c) PP8
[5]
Table 2-12: Overview of different pilot patterns in DVB-T2
Pilot pattern Separation of pilot bearing
carriers (Dx)
No. of symbols forming one
scattered pilot sequence (Dy)
PP1 3 4
PP2 6 2
PP3 6 4
PP4 12 2
PP5 12 4
PP6 24 2
PP7 24 4
[image:37.595.108.526.494.767.2]68
REFERENCES
1. Perez-Calderón, D., et al. Rotated constellations for DVB-T2. in Proc. XXIV Conf. DCIS. 2009.
2. Anggraeni, T., Tantangan Teknis Implementasi DVB-T2 di Indonesia. Buletin Pos dan Telekomunikasi, 2015. 12(4): p. 241-254.
3. dtvstatus. Digital broadcasting systems for terrestial television 2015 2015/02/23 [cited 2015 June 01]; Available from: http://en.dtvstatus.net/.
4. T004:2013, S.M.T., Specification for Digital Terrestial Television Broadcast Service Receiver, SKMM, Editor. 2013.
5. Kratochvil, T. and L. Polak. Measurement of the DVB-T2 with 256QAM rotated constellation and 32K extended mode in relation to variable pilot patterns. in Broadband Multimedia Systems and Broadcasting (BMSB), 2013 IEEE International Symposium on. 2013. IEEE.
6. Tralic, D., et al. Simulation and measurement of DVB-T2 channel characteristics. in ELMAR, 2012 Proceedings. 2012. IEEE.
7. Mendicute, M., et al., DVB-T2: new signal processing algorithms for a challenging digital video broadcasting standard. Digital Video (In-Tech, 2010), 2010: p. 185-206. 8. Kondrad, L., et al., Cross-layer optimization of DVB-T2 system for mobile services.
International Journal of Digital Multimedia Broadcasting, 2010. 2010.
9. ETSI, E., 302 755 v. 1.3. 1,“. Frame structure channel coding and modulation for a second generation digital terrestrial television broadcasting system (DVB-T2), 2011. 10. Fu, L., et al. Analysis of pilot patterns and channel estimation for DVB-T2. in Network
Infrastructure and Digital Content, 2010 2nd IEEE International Conference on. 2010. IEEE.
11. MOVVA, P. and A.K. CHAITANYA, Analysis of Different Pilot Patterns in Various Channels for DVB-T2. Analysis, 2014. 3(9).
12. TR101290, E., Digital video broadcasting (DVB); measurement guidelines for DVB systems. 2001, ETSI, Sophia Antipolis, France.
13. Tormos, M., et al. Evaluation performance analysis of DVB-T2 in a SFN network. in I/V Communications and Mobile Network (ISVC), 2010 5th International Symposium on. 2010. IEEE.
14. Karakuş, O., Performance Comparison of European DTTV Standards under Non-Gaussian Noise and Fixed Reception Effect. International Journal of Research in Wireless Systems, 2012. 1(1).
15. Tormos, M., et al. Experimental performance of mobile DVB-T2 in SFN and distributed MISO network. in Telecommunications (ICT), 2012 19th International Conference on. 2012. IEEE.
17. Polak, L. and T. Kratochvil. Comparison of the non-rotated and rotated constellations used in DVB-T2 standard. in Radioelektronika (RADIOELEKTRONIKA), 2012 22nd International Conference. 2012. IEEE.
18. Samo, D.A., et al., A performance study of DVB-T2 and DVB-T2-lite for mobile reception. Digital Signal Processing, 2014.
19. Salman, F., J. Cosmas, and Y. Zhang. Modelling and performance of a DVB-T2 channel estimator and equaliser for different pilot patterns. in Broadband Multimedia Systems and Broadcasting (BMSB), 2012 IEEE International Symposium on. 2012. IEEE. 20. Majstrenko, V.A., A.P. Averchenko, and B.D. Zhenatov. DVB-T2 advantages and its
construction features on the base of DVB-T equipment. in Actual Problems of Electronics Instrument Engineering (APEIE), 2012 11th International Conference on. 2012.
![Figure 2.2: (a) BBFRAME format and (b) FECFRAME format [9]](https://thumb-us.123doks.com/thumbv2/123dok_us/8765867.896391/24.595.151.523.178.465/figure-bbframe-format-and-fecframe-format.webp)