© Associated Asia Research Foundation (AARF)
A Monthly Double-Blind Peer Reviewed Refereed Open Access International e-Journal - Included in the International Serial Directories.
Page | 9
CURRENT ACCOUNT DEFICIT IN INDIA: EXPLORING THE TRENDS
AND CAUSES
Ms. Saina Baby
Symbiosis Institute of Business Management, Bengaluru Symbiosis International (Deemed University) Pune
ABSTRACT
Current Account Deficit(CAD) has become a major threat to India’s external economic stability.
One of the major causes of 1991 economic crisis was the huge CAD and the inability of the
country to finance that deficit. Economy had to go through the painful process of
macroeconomic policy adjustments as a consequence of 1991 crisis. After attaining stability
during post reform period, the deficits started to increase again from 2012-13 onwards. These
changing trends in the pattern of CAD in India makes it interesting to analyze the trends in CAD
in the post reform period and also to identify the factors causing CAD in the Indian context.
Analysis of secondary data used in this study reveals that commodity imports cause swings in the
current account balance substantially. On the basis of these findings this study also recommends
few policy options to manage current account deficit efficiently.
1.Introduction
Current Account is a part of the Balance of Payments(BOP) statement of a country. Current account records the volume of trade in the goods and service between a country and the rest of the world. It also includes private and official transfers and investment income and compensation of employees. When the import of goods, services and capital exceeds exports a country is said to be in Current Account Deficit(CAD). Current account deficit management is a crucial part of
International Research Journal of Human Resources and Social Sciences ISSN(O): (2349-4085) ISSN(P): (2394-4218) Impact Factor- 5.414, Volume 5, Issue 03, March 2018 Website- www.aarf.asia, Email : [email protected] , [email protected]
© Associated Asia Research Foundation (AARF)
A Monthly Double-Blind Peer Reviewed Refereed Open Access International e-Journal - Included in the International Serial Directories.
Page | 10 macroeconomic policy decisions in a country. India has been experiencing current account deficit since 1970s.But CAD became a serious threat to the economy during the 1991 crisis when the it was 2.2% of GDP. One of the main reasons for the BOP crisis was the high current account deficit and the lack of capital flows to finance the deficit. The Liberalization, Privatization and Globalization(LPG) model implemented during the 1990s focused on attracting foreign investment through the opening up of the economy. Before 1991, current account deficit was mainly financed through debt.
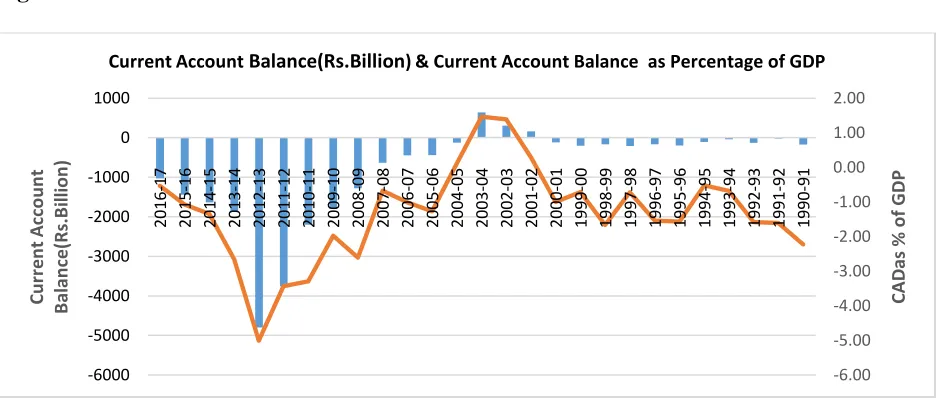
During 2011-12 and 2012-13 Current Account Deficit started becoming a threat to macroeconomic stability. In the financial year 2012-13 India witnessed a Current Account Deficit of Rs.4796.10 Billion (4.8% of GDP) which was the highest since independence. From 2013-14 onwards CAD as percentage of GDP showed a declining trend. In 2013-14 the CAD as percentage of GDP fell to 2.65% reaching a level which is very close to RBI’s comfort zone of 2.5% of GDP.CAD as percentage of GDP went below the RBI’s 2.5% threshold by recording 1.34%,1.07% and 0.53% in financial years 2014-15,2015-16 and 2016-17 respectively. Beating this decline trend, CAD surged to 2.4% of GDP in Q1 of financial years 2017-18 mainly due to increasing imports. The purpose of this paper is to analyze the current account balance trends in India and identify the factors responsible for the occurrence of current account deficit in India.
This paper is divided into 4 Sections. Section 1 deals with the introduction to the concept ofcurrent account deficit. Section 2 summarizes the review of existing literature on current account deficit along with identification of the research gaps and the objectives of the study. Research methodology along with detailed analysis of data are included in Section 3. Section 4 includes summary of findings and conclusion.
2.Review of Literature
Banday, U. J., &Aneja, R. (2016) in their paper attempts to test the twin deficit hypothesis in the
Indian context. Cointegration and granger causality tests are used for testing the hypothesis.
Budget and current account deficit data for the period 1990 to 2013 have been used for the
analysis. Cointegration test identifies a long run co- movement of both the variables and Granger
causality test reveals a bi directional relastihip between fiscal and current account deficits.
© Associated Asia Research Foundation (AARF)
A Monthly Double-Blind Peer Reviewed Refereed Open Access International e-Journal - Included in the International Serial Directories.
Page | 11
Tastan, S., & Aric, K. H. (2016) in their paper checks whether current account deficit is
sustainable in Brazil, India and South Africa. Quarterly data on current account balance as
percentage of GDP have been used in this study. Sustainability has been checked using
intertemporal budget constraint approached developed by Trehan and Walsh (1991) and Hakkio and Rush (1991). The study finds that it is difficult to achieve sustainability in India and South Africa. The main reasons for unsustainability in India is the high budget deficit, inadequate
government policy reforms and huge merchandise trade deficit.
Thomas, M. P. (2016) in her paper investigates the impact of service trade on economic growth
and current account deficit in India. Balance of Payments Constrained Growth Model of Thirwall Section has been used to measure the impacts. This paper compares the growth rate of goods sector and service sector with the balance of payments equilibrium growth rate. The paper identifies that growth rate of service sector is at par with BOP equilibrium growth rate, but the goods sector growth rate is higher than the BOP equilibrium growth rate and thereby causing a deficit in BOP.
Huntington, H. G. (2015).in this paper investigates the relationship between crude oil trade and
current account deficit. This study is based on data collected from 91 countries for the time
period from 1984-2009.Pooled Generalized Least Square Regression(GLS) in the study. The
dependent variable used in the study was current account balance as a percentage of GDP and the
independent variables were age dependency ratio, government budget balance as percentage of
GDP, trade openness, real GDP per capita and net oil export balance as percentage of GDP.The
study finds that oil exports are significant in explaining current account surpluses while oil
imports are not significant in explaining current account deficits in importing countries.
Tiwari, A. K. (2015) in his paper discuses about the sustainability of India’s current account
deficit by specifically looking at impact of oil and non-oil commodity exports and imports. The
data used in the study covers time period 1970 to 2007.Cointegration analysis along with unit
root test with structural breaks used in the study reveals sustaining current account deficit is
possible in the case of non-oil exports and non-oil imports while the same is not possible in the
case of oil exports and imports. This study recommends suitable policy measures to regulate oil
© Associated Asia Research Foundation (AARF)
A Monthly Double-Blind Peer Reviewed Refereed Open Access International e-Journal - Included in the International Serial Directories.
Page | 12
Mathew, D. J. (2013) in his paper analyses the trends and challenges to India’s BOP. Trends
analysis was done for data covering the period 1990-91 to 2011-12. This paper analyses the
trends in current and capital accounts during the study period. It identifies the positive impact of
invisibles balance and software services on India’s BOP. Major concern raised by the paper was
the volatility of FDI inflows occurred during and after the 2007-08 financial crisis. The paper
identifies increase in external debt and rupee depreciation as the major challenges in the external
sector and urges policy maker to implement suitable monetary, fiscal and exchange rate policies
to maintain macroeconomic stability.
Ramphul, O. (2013) in his paper attempts to identify the factors affecting current account deficit
in India and the possibility of sustaining current account deficit in the long run. The paper covers
an extensive time period from 1950 to 2010.Cointegration between variable was checked using
Auto RegressiveDistributed Lagged (ARDL) approach. The results of the study confirm cointegrating relationship between India’s current account inflows and outflows in the long run. Granger causality test through vector error correction models also identifies a bi directional causal long term relationship between India’s current account inflows and outflows. Fiscal deficit, real effective exchange rate and interest rate were identified as significant determinants of current account deficit in India.
Rangarajan, C.(2013),explores the trends in gold demand in India and its impact on CAD. The
paper is written during the 2012-13 period when the current account deficits and gold imports
were at the peak. This paper offers certain policy prescriptions to reduce the import of gold.
According to Rangarajan by ensuring a good real return on other financial investments, investors
appetite for gold can be curtailed. Maintaining real return on assets is only possible if inflation is
under control. Increasing the import duty on gold and promoting transparent polices for buying
and selling of gold are the other measures suggested by the paper to reduce gold imports.
© Associated Asia Research Foundation (AARF)
A Monthly Double-Blind Peer Reviewed Refereed Open Access International e-Journal - Included in the International Serial Directories.
Page | 13 finance CAD. The corrective measures suggested in this article includes reducing gold import by increasing the import duty and encouraging the consumption of renewable energy resources instead of oil.
Callen, M. T., &Cashin, M. P. (1999) in their working paper explores the possibility of
sustaining India’s external instability. The initial part of this paper looks at the trends in India’s
current account deficit by dividing the period into three different time frames; independence to
1970,1980s to 1991 and then 1991 to 1999.India’s external instability sustainability was assessed
using solvency, sustainability and optimality of capital flows. The study identifies that India’s
current account deficit up to the period 1991 was not sustainable whereas post 1991 CAD
became sustainable mainly because of the policy changes adopted during the 1991 crisis.
Most of the existing studies cover time period up to 2011-12. But the trends in current account balance underwent substantial changes after that time period. CAD was the highest in 2012-13 and from 2015-16 onwards CAD reduced substantially. Existing studies do not look at these recent changes in the current account balance trends. A study covering time period from 1990-91 to 2016-17 will help in creating a comprehensive understanding the trends in CAD.
Objectives of the study
1. To analyze the trends in Current Account Balance in India 2. To identify the causes of Current Account Deficit in India 3.Research methodology and Data Analysis
The methodology used in this study is analysis of secondary data of different macroeconomic variables. The data have been collected from secondary sources like Websites of RBI, Planning commission, World Bank etc. Annual data have been used and time period from 1990-91 to 2016-17 have been covered. Bloomberg terminal data also have been used for analysis.
© Associated Asia Research Foundation (AARF)
A Monthly Double-Blind Peer Reviewed Refereed Open Access International e-Journal - Included in the International Serial Directories.
Page | 14 Current Account Balance Trends
[image:6.612.74.544.437.636.2]To understand current account balance trends, two variables have been used; Current Account balance (absolute amount) and Current Account Balance as percentage of GDP.Out of the 67 years from 1950-51 to 2016-17, India recorded current account surplus in 11 years. Five out of these 11 yearscurrent account surplus was less than Rs.0.07 Billion. This leads to the conclusion that for most of the time in the post-independence period, India witnessed current account deficits. Substantial increase in current account deficit started emerging since 1988-89. During the 45-year period between 1950-51 to 1994-95, highest current account deficit was recorded in 1990-91 which was Rs.173.67 Billion (2.2% of GDP). From 1991-92 to 2000-01, current account deficit as percentage of GDP remained below 2%. During 2001-02,2002-03 and 2003-04 India’s current account witnessed a transition from deficit to surplus. After recording surplus for three consecutive years, Current account moved back into the deficit territory in 2004-05 and ever since then the country has been witnessing deficit in the current account. As far as the magnitude deficit has been concerned current deficit remained above the RBI comfort zone of 2.5% of GDP from 2008-09 to 2013-14 except for the year 2009-10. In 2012-13 Indian economy witnessed the highest current account deficit in the history amounted to Rs.4796 Billion (4.8% of GDP). A declining trends can be seen in CAD from 2013-14 onwards both in absolute terms and as percentage of GDP.
Figure 3.1.1: Current Account Balance Trends:1990-91 to 2016-17
Source: Handbook of Statistics on Indian Economy, RBI
-6.00 -5.00 -4.00 -3.00 -2.00 -1.00 0.00 1.00 2.00 -6000 -5000 -4000 -3000 -2000 -1000 0 1000 2016 -17 2015 -16 2014 -15 2013 -14 2012 -13 2011 -12 2010 -11 2009 -10 2008 -09 2007 -08 2006 -07 2005 -06 2004 -05 2003 -04 2002 -03 2001 -02 2000 -01 1999 -00 1998 -99 1997 -98 1996 -97 1995 -96 1994 -95 1993 -94 1992 -93 1991 -92 1990 -91 CAD as % o f GDP Cu rr e n t A cc o u n t B al an ce (R s. B ill io n )
© Associated Asia Research Foundation (AARF)
A Monthly Double-Blind Peer Reviewed Refereed Open Access International e-Journal - Included in the International Serial Directories.
Page | 15 Composition of Current Account
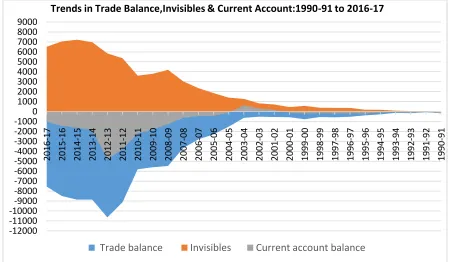
[image:7.612.69.518.205.467.2]The current account of country comprises of two sub accounts; trade balance account and invisibles account. Trade balance account shows the difference between merchandise export and import. This account could be in surplus or deficit depending on whether merchandise export is greater than merchandise import and vice versa. Invisible account comprises of trade in services, transfers and investment income.
Figure 3.1.2: Composition of Current Account
Source: Handbook of Statistics on Indian Economy, RBI
India’s trade balance has been in deficit throughout the study period. The highest trade balance of Rs. -10644.56 Billion was recorded in 2012-13 and the lowest deficit of Rs.-64.94 Billion was in 1991-92.Substatial increase in trade deficit started from 2008-09 onwards. Trade deficit almost doubled between 2008-09 and 21012-13. Trade deficit has been exhibiting a declining trend since 2012-13.
-12000 -11000 -10000-9000 -8000 -7000 -6000 -5000 -4000 -3000 -2000 -10000 1000 2000 3000 4000 5000 6000 7000 8000 9000 2016 -17 2015 -16 2014 -15 2013 -14 2012 -13 2011 -12 2010 -11 2009 -10 2008 -09 2007 -08 2006 -07 2005 -06 2004 -05 2003 -04 2002 -03 2001 -02 2000 -01 1999 -00 1998 -99 1997 -98 1996 -97 1995 -96 1994 -95 1993 -94 1992 -93 1991 -92 1990 -91
Trends in Trade Balance,Invisibles & Current Account:1990-91 to 2016-17
© Associated Asia Research Foundation (AARF)
A Monthly Double-Blind Peer Reviewed Refereed Open Access International e-Journal - Included in the International Serial Directories.
Page | 16 Invisibles account generally shows an increasing trend during the study period. Decline in invisibles balance was observed only during five years (2000-01,2009-10,2010-11,2015-16,2016-17). Year 2014-15 witnessed the highest balance in the invisibles account.
Composition of Trade Balance
[image:8.612.74.542.292.640.2]Trade balance is the major factor which influences current account balance. Understanding the trends in trade balance would provide deeper insights to structural changes happening in current account balance. Indian economy has always shown merchandise trade deficit. Merchandise imports showed a year on year upward trend throughout the study period except in 2015-16 and 2016-17. Merchandise exports also showed a continuously increasing trend except in in 2015-16 and 2016-17.
Figure 3.1.3: Composition of Trade Balance
Source: Handbook of Statistics on Indian Economy, RBI
-15000 -12500 -10000 -7500 -5000 -2500 0 2500 5000 7500 10000 12500 15000 17500 20000 22500 25000 27500 30000 32500 2016 -17 2015 -16 2014 -15 2013 -14 2012 -13 2011 -12 2010 -11 2009 -10 2008 -09 2007 -08 2006 -07 2005 -06 2004 -05 2003 -04 2002 -03 2001 -02 2000 -01 1999 -00 1998 -99 1997 -98 1996 -97 1995 -96 1994 -95 1993 -94 1992 -93 1991 -92 1990 -91
Export,Import&Trade Balance(Rs.Billion):1990-91 to 2016-17
© Associated Asia Research Foundation (AARF)
A Monthly Double-Blind Peer Reviewed Refereed Open Access International e-Journal - Included in the International Serial Directories.
Page | 17 Composition of Imports
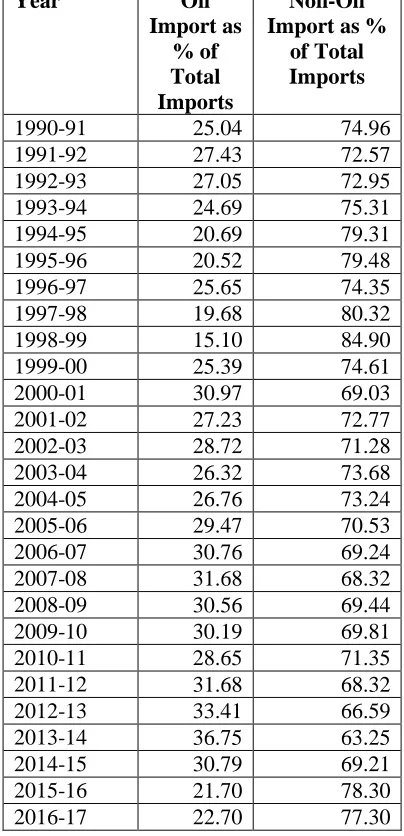
[image:9.612.205.407.191.609.2]Since imports have always been higher than exports for India, a deeper exploration of the composition of imports is helpful in understanding the impact of Imports on trade balance and current account balance.RBI classifies imports into oil and non-oil for the purpose of tracking the changes in value and volume of these two types of imports.
Table 3.1.1: Composition of Imports
Year Oil
Import as % of Total Imports
Non-Oil Import as %
of Total Imports
1990-91 25.04 74.96
1991-92 27.43 72.57
1992-93 27.05 72.95
1993-94 24.69 75.31
1994-95 20.69 79.31
1995-96 20.52 79.48
1996-97 25.65 74.35
1997-98 19.68 80.32
1998-99 15.10 84.90
1999-00 25.39 74.61
2000-01 30.97 69.03
2001-02 27.23 72.77
2002-03 28.72 71.28
2003-04 26.32 73.68
2004-05 26.76 73.24
2005-06 29.47 70.53
2006-07 30.76 69.24
2007-08 31.68 68.32
2008-09 30.56 69.44
2009-10 30.19 69.81
2010-11 28.65 71.35
2011-12 31.68 68.32
2012-13 33.41 66.59
2013-14 36.75 63.25
2014-15 30.79 69.21
2015-16 21.70 78.30
2016-17 22.70 77.30
© Associated Asia Research Foundation (AARF)
A Monthly Double-Blind Peer Reviewed Refereed Open Access International e-Journal - Included in the International Serial Directories.
Page | 18 Trends in Crude Oil Price and Crude Oil Import
[image:10.612.70.536.220.451.2]The proportion of oil import in total imports became substantial since 2000-01. From 2000-01 to 2014-15 oil imports accounted for more than one fourth of total imports. In 2012-13 and 2013-14, the ratio of oil imports crossed 33% of total imports. It is interesting to note that Indian economy recorded the highest trade and current account deficits in 2012-13. Indiawitnessed fourth highest trade deficit and second highest merchandise imports in its history in the year 20113-14.
Figure 3.1.4: Indian Basket Crude Oil Price and Imports
Source: Handbook of Statistics on Indian Economy, RBI
Oil prices remained above $80/bbl from 2010-11 to 2014-15. Oil import value also started increasing substantially during this period. The proportion of oil imports in total imports also remained above 30% during this period except for year 2010-11. During the period 2011-12 to 2014-15, trade deficit was also very high. The fall in oil prices started since 2013-14 has led to a substantial fall in the oil import value. Oil prices fell from $84.16/bbl in 2014-15 to less than $50/bbl in 2015-16 and 2016-17. From its peak in 2013-14 Oil import value fell by more than 40% by 2016-17.
0.00 1000.00 2000.00 3000.00 4000.00 5000.00 6000.00 7000.00 8000.00 9000.00 10000.00 11000.00
0.00 10.00 20.00 30.00 40.00 50.00 60.00 70.00 80.00 90.00 100.00 110.00 120.00
Oi
l Im
p
o
rt(
R
s.
B
ill
io
n
)
C
ru
d
e
Oil
Pr
ic
e
($/
b
b
l)
© Associated Asia Research Foundation (AARF)
A Monthly Double-Blind Peer Reviewed Refereed Open Access International e-Journal - Included in the International Serial Directories.
Page | 19 Trends in Gold Prices and Gold Imports
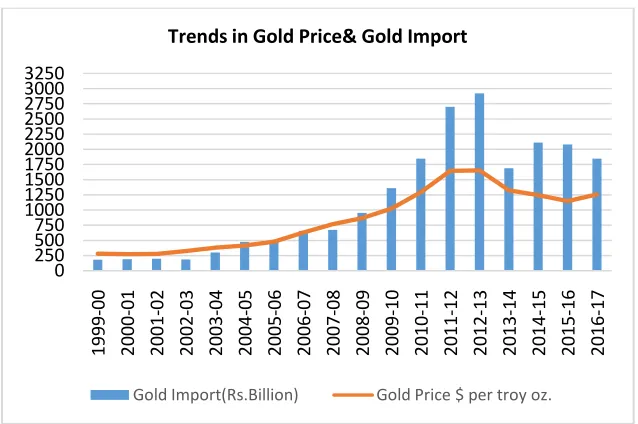
[image:11.612.71.390.201.413.2]A peculiar component which has been creating swings in India’simport and trade deficit is gold. India is one of the largest importers of gold in the world.Gold imports are contributing to the large current account deficit. During periods of volatile and uncertain capital flows, large gold imports lead to depletion of forex reserves and thereby threatens external Stability of the economy(RBI,2013)
Figure 3.1.5: Gold Price and Import
Source: Handbook of Statistics on Indian Economy, RBI
The increase in global gold prices during and after the financial crisis led to increase in value of gold imports to India during 2008-09 to 2012-13. During 2011-12 and 2012-13 when the trade deficits were very high, the contribution of gold imports to trade deficit was greater than 25%. During these two years the current deficits were also the highest in the history of Indian economy. Due to fall in global oil prices along with various measures taken by the government, gold imports came down substantially compared to the peak in 2012-13.
Combined Impact of Gold and Oil Imports
The combined impact of gold and oil on total imports was the highest in 2012-13. Trade and current account deficits were also the highest in this year. The proportion of gold in total imports remained high in 2010-11,2011-12 and 2012-13. Oil imports as proportion of total imports was
0 250 500 750 1000 1250 1500 1750 2000 2250 2500 2750 3000 3250
1999
-00
2000
-01
2001
-02
2002
-03
2003
-04
2004
-05
2005
-06
2006
-07
2007
-08
2008
-09
2009
-10
2010
-11
2011
-12
2012
-13
2013
-14
2014
-15
2015
-16
2016
-17
Trends in Gold Price& Gold Import
© Associated Asia Research Foundation (AARF)
A Monthly Double-Blind Peer Reviewed Refereed Open Access International e-Journal - Included in the International Serial Directories.
[image:12.612.162.452.143.598.2]Page | 20 the highest in 2013-14 followed by 2012-13. The reduction in the proportions of gold and oil imports led to a declining trend in trade deficit in 2015-16 and 2016-17.
Table 3.1.2: Oil and Gold Imports as percentage of Total Imports Year Gold
Import as % of Total Imports
Oil Import as % of Total Imports
Gold+ Oil Import as % of Total Imports
Trade Balance (Rs.Billion)
1999-00 8.36 25.39 33.75 -773.59
2000-01 8.16 30.97 39.12 -567.37
2001-02 8.11 27.23 35.34 -549.55
2002-03 6.26 28.72 34.98 -516.97
2003-04 8.34 26.32 34.66 -633.86
2004-05 9.45 26.76 36.21 -1517.65
2005-06 7.26 29.47 36.73 -2296.64
2006-07 7.79 30.76 38.55 -2799.62
2007-08 6.65 31.68 38.33 -3676.64
2008-09 6.94 30.56 37.49 -5474.49
2009-10 9.96 30.19 40.15 -5599.65
2010-11 10.97 28.65 39.62 -5804.70 2011-12 11.51 31.68 43.19 -9121.29 2012-13 10.95 33.41 44.36 -10644.56
2013-14 6.22 36.75 42.97 -8848.45
2014-15 7.71 30.79 38.50 -8858.62
2015-16 8.34 21.70 30.05 -8495.31
2016-17 7.19 22.70 29.89 -7544.52
© Associated Asia Research Foundation (AARF)
A Monthly Double-Blind Peer Reviewed Refereed Open Access International e-Journal - Included in the International Serial Directories.
Page | 21 Invisibles Account
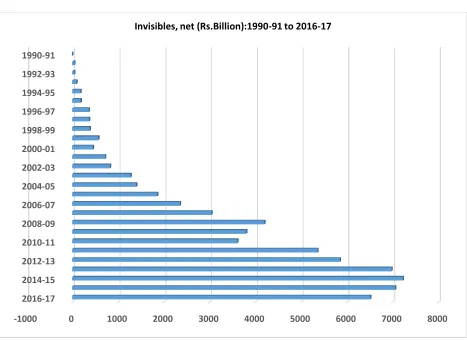
[image:13.612.73.540.255.595.2]Since the opening up of the economy, invisibles accounts’ contribution to the current account has been increasing. From a deficit of Rs. -4.33 billion in 1990-91 invisibles accounts value hit an all-time high of Rs.7225 billion in 2014-15. The current account surplus from 2001-02 to 2003-04 was mainly propelled by the invisibles’ contribution. During these three years the value of Invisibles Account was greater than the trade deficit which resulted in current account surpluses. Though there was a decline in value of invisibles during 2009-10 and 2010-11, it picked up afterwards. During the last two financial years invisibles value came down mainly because of reduction in services trade and transfers.
Figure 3.1.6: Invisibles Account
Source: Handbook of Statistics on Indian Economy, RBI
-1000 0 1000 2000 3000 4000 5000 6000 7000 8000
2016-17 2014-15 2012-13 2010-11 2008-09 2006-07 2004-05 2002-03 2000-01 1998-99 1996-97 1994-95 1992-93 1990-91
© Associated Asia Research Foundation (AARF)
A Monthly Double-Blind Peer Reviewed Refereed Open Access International e-Journal - Included in the International Serial Directories.
Page | 22 Composition of Invisibles
[image:14.612.157.458.247.647.2]A further decomposition of the invisibles account would help us in understanding the contribution of each of the sub components. Invisibles account has been mainly divided into three subaccounts- services trade account, transfers comprising of private and official transfers and income earned by various factors of production. Services account includes trade in services related to travel, transportation, insurance, Governments Not Included Elsewhere(GNIE), software, business, communication and finance. Transfers account includes private and official transfers. Income account is the sum of investment income and compensation of employees.
Table 3.1.3: Composition of Invisibles (In Rs. Billion)
Year
Invisibles Services Transfers
Income
2016-17 6516.46 4524.90 3754.86 -1763.30 2015-16 7057.69 4558.28 4097.20 -1597.79 2014-15 7225.49 4683.16 4016.63 -1474.30 2013-14 6977.09 4428.68 3947.25 -1398.84 2012-13 5848.46 3532.17 3483.93 -1167.64 2010-11 3608.17 2005.60 2420.63 -818.06 2009-10 3802.66 1711.94 2470.65 -379.93 2008-09 4198.20 2484.06 2043.38 -329.24 2007-08 3041.86 1562.45 1684.52 -205.09 2006-07 2355.79 1330.64 1357.49 -332.34 2005-06 1859.27 1026.11 1094.32 -261.16 2004-05 1395.91 688.31 931.35 -223.75 2003-04 1273.69 463.81 1016.96 -207.08 2002-03 823.57 176.44 814.03 -166.90 2001-02 713.81 158.89 755.60 -200.68 2000-01 451.39 79.05 599.67 -227.33 1999-00 570.28 176.70 547.89 -154.31 1998-99 386.89 91.14 445.42 -149.67 1997-98 369.22 49.43 451.83 -132.04 1996-97 362.79 26.21 454.25 -117.67 1995-96 184.15 -7.02 298.33 -107.16 1994-95 178.36 18.83 267.26 -107.73 1993-94 90.89 16.77 176.70 -102.58 1992-93 44.75 26.98 122.80 -105.03 1991-92 42.59 31.33 105.22 -93.96 1990-91 -4.33 17.61 45.39 -67.33
© Associated Asia Research Foundation (AARF)
A Monthly Double-Blind Peer Reviewed Refereed Open Access International e-Journal - Included in the International Serial Directories.
Page | 23 Growth in the services trade balance is consistent since 1990-91 except for 1995-96 when services trade recorded deficit. Global slow down along with appreciation of real exchange rate was the major cause of the decline. From 2005-06 to 2008-09 service trade balance improved. Though the trade balance reduced in 2009-10, it again recovered and continued the upward trend till 2014-15. There has been a decline in the service trade balance during the last two financial years. On an average transfers (government+ private) show an upward trend. The consistent surpluses in service and transfers accounts maintains healthy growth of the invisible account balances.
4. Summary of findings and Conclusion
© Associated Asia Research Foundation (AARF)
A Monthly Double-Blind Peer Reviewed Refereed Open Access International e-Journal - Included in the International Serial Directories.
Page | 24 Bibliography
1. Banday, U. J., &Aneja, R. (2016). How budget deficit and current account deficit are interrelated in Indian economy. Theoretical & Applied Economics, 23(1).
2. Callen, M. T., &Cashin, M. P. (1999). Assessing external sustainability in India (No. 99-181). International Monetary Fund.
3. Huntington, H. G. (2015). Crude oil trade and current account deficits. Energy
Economics, 50, 70-79.
4. Mathew, D. J. (2013). Trends and Challenges of India’s Balance of Payments.MPRA
Paper No. 51167, page no 1-12.
5. Ramphul, O. (2013). Sustainability of India’s current account deficit.Journal of
International Economic Studies .No. 27, 77–91
6. Rangarajan,C(2013). India: Global Gold Trading Hub, Reserve Bank of India
7. Tastan, S., & Aric, K. H. (2016). Sustainability of Current Account Deficits in BRICs Countries. Journal of Business Economics and Finance, 5(2).
8. Thomas, M. P. (2016). Impact of services trade on India's economic growth and current account balance: Evidence from post-reform period (No. 164). FIW Working Paper.
9. Tiwari, A. K. (2015). Reassessment of sustainability of current account deficit in India. South-Eastern Europe Journal of Economics, 10(1).