Downloaded from: http://researchonline.lshtm.ac.uk/4650921/ DOI:10.1101/188920
Usage Guidelines
Please refer to usage guidelines at http://researchonline.lshtm.ac.uk/policies.html or alterna-tively [email protected].
Available under license: Creative Commons Attribution Non-commercial http://creativecommons.org/licenses/by-nc/3.0/
Methods paper template
PlasmidTron: assembling the cause of phenotypes
1
from NGS data
2
Andrew J. Page*, Alexander Wailan, Yan Shao, Kim Judge, Gordon Dougan, Elizabeth J. Klemm, 3
Nicholas R. Thomson, Jacqueline A. Keane 4
5
Infection Genomics, Wellcome Trust Sanger Institute, Wellcome Genome Campus, Hinxton, 6
Cambridge, UK. 7
*Corresponding author: [email protected]
8 9
ABSTRACT
10
When defining bacterial populations through whole genome sequencing (WGS) the samples often 11
have detailed associated metadata that relate to disease severity, antimicrobial resistance, or even 12
rare biochemical traits. When comparing these bacterial populations, it is apparent that some of 13
these phenotypes do not follow the phylogeny of the host i.e. they are genetically unlinked to the 14
evolutionary history of the host bacterium. One possible explanation for this phenomenon is that 15
the genes are moving independently between hosts and are likely associated with mobile genetic 16
elements (MGE). However, identifying the element that is associated with these traits can be 17
complex if the starting point is short read WGS data. With the increased use of next generation WGS 18
in routine diagnostics, surveillance and epidemiology a vast amount of short read data is available 19
and these types of associations are relatively unexplored. One way to address this would be to 20
perform assembly de novo of the whole genome read data, including its MGEs. However, MGEs are 21
often full of repeats and can lead to fragmented consensus sequences. Deciding which sequence is 22
part of the chromosome, and which is part of a MGE can be ambiguous. We present PlasmidTron, 23
which utilises the phenotypic data normally available in bacterial population studies, such as 24
antibiograms, virulence factors, or geographic information, to identify sequences that are likely to 25
represent MGEs linked to the phenotype. Given a set of reads, categorised into cases (showing the 26
phenotype) and controls (phylogenetically related but phenotypically negative), PlasmidTron can be 27
used to assemble de novo reads from each sample linked by a phenotype. A k-mer based analysis is 28
performed to identify reads associated with a phylogenetically unlinked phenotype. These reads are 29
then assembled de novo to produce contigs. By utilising k-mers and only assembling a fraction of the 30
raw reads, the method is fast and scalable to large datasets. This approach has been tested on 31
plasmids, because of their contribution to important pathogen associated traits, such as AMR, hence 32
the name, but there is no reason why this approach cannot be utilized for any MGE that can move 33
independently through a bacterial population. PlasmidTron is written in Python 3 and available 34
under the open source licence GNU GPL3 from https://goo.gl/ot6rT5 . 35 36 37
DATA SUMMARY
38 391. Source code for PlasmidTron is available from Github under the open source licence GNU 40
GPL 3; (url – https://goo.gl/ot6rT5 ) 41
42
2. Simulated raw reads files have been deposited in Figshare; (url – 43
https://doi.org/10.6084/m9.figshare.5406355.v1 ) 44
45
3. Salmonella enterica serovar Weltevreden strain VNS10259 is available from GenBank; 46
accession number GCA_001409135. 47
48
4. Salmonella enterica serovar Typhi strain BL60006 is available from GenBank; accession 49
number GCA_900185485. 50
51
5. Accession numbers for all of the Illumina datasets used in this paper are listed in the 52
supplementary tables. 53
54
I/We confirm all supporting data, code and protocols have been provided within the article or 55
through supplementary data files. ☒ 56
57
IMPACT STATEMENT
58 59
PlasmidTron utilises the phenotypic data normally available in bacterial population studies, such as 60
antibiograms, virulence factors, or geographic information, to identify sequences that are likely to 61
represent MGEs linked to the phenotype. 62
63
INTRODUCTION
When defining bacterial populations through whole genome sequencing (WGS) the samples often 65
have detailed associated metadata that relate to disease severity, antimicrobial resistance, or even 66
rare biochemical traits. When comparing these bacterial populations, it is apparent that some of 67
these phenotypes do not follow the phylogeny of the host i.e. they are genetically unlinked to the 68
evolutionary history of the host bacterium. One possible explanation for this phenomenon is that 69
the genes are moving independently between hosts and are likely associated with mobile genetic 70
elements (MGE). However, identifying the element that is associated with these traits can be 71
complex if the starting point is short read WGS data. With the increased use of next generation WGS 72
in routine diagnostics, surveillance and epidemiology a vast amount of short read data is available 73
and these types of associations are relatively unexplored. One way to address this would be to 74
perform assembly de novo of the whole genome read data, including its MGEs. However, MGEs are 75
often full of repeats and can lead to fragmented consensus sequences. Deciding which sequence is 76
part of the chromosome, and which is part of a MGE can be ambiguous (1). 77
A number of recent methods have been developed to address the problem of assembling some of 78
these MGEs, from NGS data (1). plasmidSPAdes (2) detects plasmids by analysing the coverage of 79
assembled contigs to separate out chromosomes from plasmid like sequences. By filtering the 80
dataset, a higher quality assembly is possible. However, if the copy number of the plasmids are 81
similar to the chromosome, it is not possible to separate out plasmids. Unicycler (3) is a hybrid 82
assembler which can combine short and long read data to produce fully circularised chromosomes 83
and plasmids. It essentially fixes many of the deficiencies of SPAdes (4) and fine tunes it for 84
assembling bacteria. Recycler (5) takes an assembly graph and aligned reads to search for cycles in 85
the graph which may correspond to plasmids. The method is only partially implemented with 86
substantial work required on the researcher's part to generate input files in the correct formats. It is 87
shown to work well on small simple plasmids, however it does not scale to larger more complex 88
plasmids. All of these software applications utilise SPAdes within their methods, work on a single 89
sample at a time, and require no a priori knowledge about the samples themselves. 90
We present PlasmidTron, which utilises the phenotypic data normally available in bacterial 91
population studies, such as antibiograms, virulence factors, or geographic information, to identify 92
sequences that are likely to represent MGEs linked to the phenotype. Given a set of reads, 93
categorised into cases (showing the phenotype) and controls (phylogenetically related but 94
phenotypically negative), PlasmidTron can be used to assemble de novo reads from each sample 95
linked by a phenotype. A k-mer based analysis is performed to identify reads associated with a 96
phylogenetically unlinked phenotype. These reads are then assembled de novo to produce contigs. 97
By utilising k-mers and only assembling a fraction of the raw reads, the method is fast and scalable 98
to large datasets. This approach has been tested on plasmids, because of their contribution to 99
important pathogen associated traits, such as AMR, hence the name, but there is no reason why this 100
approach cannot be utilized for any MGE that can move independently through a bacterial 101
population. The method is tested on simulated and real datasets, compared to other methods, and 102
the results are validated with long read sequencing. PlasmidTron is a command-line tool, is written 103
in Python 3 and is available under the open source licence GNU GPL3 from https://goo.gl/ot6rT5 . 104
105 106
METHOD
107
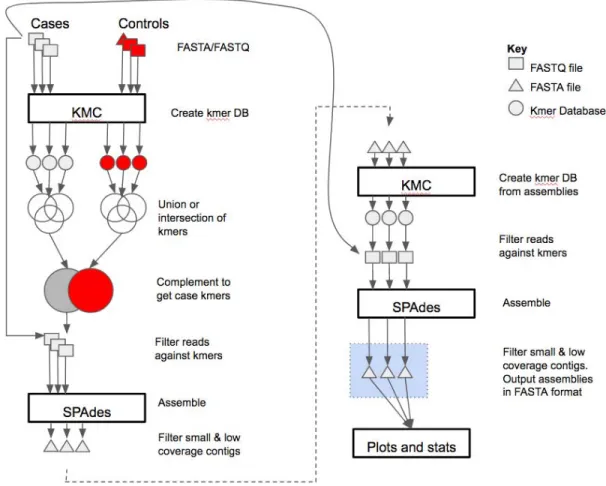
PlasmidTron takes two spreadsheets as input, one containing paired ended reads in FASTQ format 108
for samples displaying the phenotype (cases), the other containing FASTA or FASTQ files for samples 109
not displaying the phenotype (controls). The full method is shown in Figure 1. A k-mer analysis of 110
each of the samples is performed using KMC (syntax versions v2.3.0 or v3.0.0) (6,7) to produce 111
databases of k-mer counts. k-mers occurring less than 5 times are excluded by default since 112
assembly is more error prone below this level of coverage. A union is taken of the cases k-mer 113
databases to produce a new database of all k-mers ever seen in any of the trait samples, and 114
similarly for the controls. The two sets are then subtracted from each other, leaving only k-mers 115
uniquely present in the cases dataset. The raw reads, plus their mates, which match these unique k-116
mers are extracted from each sample where each read must be covered by a defined percentage of 117
k-mers. Each set of reads is assembled de novo with SPAdes. The assembly contigs are filtered to 118
remove small contigs (default 300 bases), and low coverage contigs (below 10X). This is because a 119
single erroneous k-mer can draw in reads on either side equating to approximately the fragment size 120
of the library. The resulting sequences can be fragmented so a second scaffolding step is 121
undertaken. A k-mer database is generated for each assembly and the raw reads, plus their mates, 122
are extracted for a second assembly with SPAdes. This allows for gaps of up to twice the fragment 123
size to be closed. A final filtering step of the assembled sequences is performed, as previously 124
described. An assembly in FASTA format is created for each of the trait samples, along with a plot of 125
the shared k-mers in each sample, indicating the level of identity between samples. Parallelisation 126
support is provided by GNU parallel (8). 127
128
RESULTS
129
To evaluate the effectiveness of PlasmidTron three datasets were used including: 1) simulated reads 130
to show the impact of copy number variation in identifying plasmids, 2) the effectiveness of different 131
methods in recalling plasmid type sequences on real world data, and 3) identification of a novel AMR 132
plasmid with subsequent validation using long read sequencing. All experiments were performed 133
using the Wellcome Trust Sanger Institute compute infrastructure, running Ubuntu 12.04. 134
135
IMPACT OF COPY NUMBER VARIATION
136
Simulated reads were generated to show the impact of copy number variation compared to other 137
methods. A trivial set of simulated perfect reads was generated. A reference genome, which was 138
sequenced using the PacBio RSII for Salmonella enterica serovar Weltevreden (S. Weltevreden) 139
(accession number GCA_001409135), was shredded using FASTAQ (v3.15.0) 140
(https://github.com/sanger-pathogens/fastaq) to generate perfect paired-ended reads with a read 141
length of 125 bases and a mean fragment size of 400 bases. The reference contains a single 142
chromosome (5,062,936 bases) and single plasmid (98,756 bases), where the chromosome depth of 143
coverage was fixed at 30X, and the plasmid depth of coverage was varied from 1 to 60X in steps of 2. 144
The break point for the plasmid was varied, in steps of 500 bases, to simulate a circular genome. 145
146
The results of PlasmidTron (v0.3.5) were compared to 4 other methods, recycler (v0.6), Unicycler 147
(v0.4.0), SPAdes (v3.10.0), and plasmidSPAdes (v3.10.0). SPAdes (v3.10.0) was used as the assembler 148
for each of these methods. recycler required pre-processing steps using bwa (v0.7.12) (9) and 149
samtools (v0.1.19) (10). SPAdes and Unicycler are not dedicated plasmid assemblies and are 150
agnostic to the underlying structures being sequenced, however they provide a good baseline for 151
what is possible, though the final plasmid sequences are contained in a large collection of 152
chromosome sequences. plasmidSPAdes and PlasmidTron are dedicated plasmid assemblers, and 153
recycler is post assembly plasmid analysis tool, with each employing a fundamentally different 154
analysis strategy. 155
156
Each resulting assembly was measured based on the percentage of plasmid assembled, how 157
fragmented the plasmid was, and the proportion of non-plasmid bases to plasmid bases (signal to 158
noise ratio). The assemblies are blasted (v.2.6.0) (11) against the expected plasmid sequence, with 159
an e-value of 0.0001. Blast hits of less than 200 bases long or less than 90% identity were excluded. 160
Recycler identified no plasmids on the real or simulated data, which appears to be due to the large 161
complex size of the plasmid. 162
163
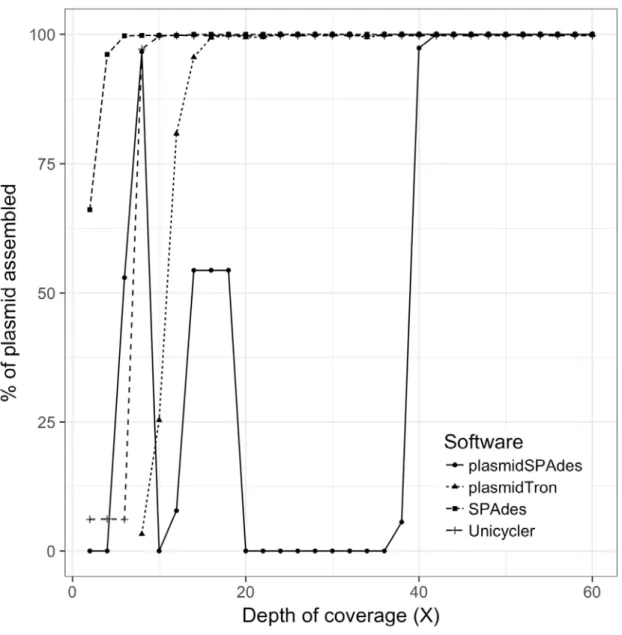
Figure 2 shows that as the copy number of the plasmid in the input reads changes, the percentage of 164
the plasmid recovered changes. plasmidSPAdes only begins to start identifying plasmid sequences at 165
40X, recovering the full plasmid sequence. Below this level the plasmid copy number is too similar to 166
the chromosome coverage so the algorithm filters it out. The SPAdes and Unicycler assemblers 167
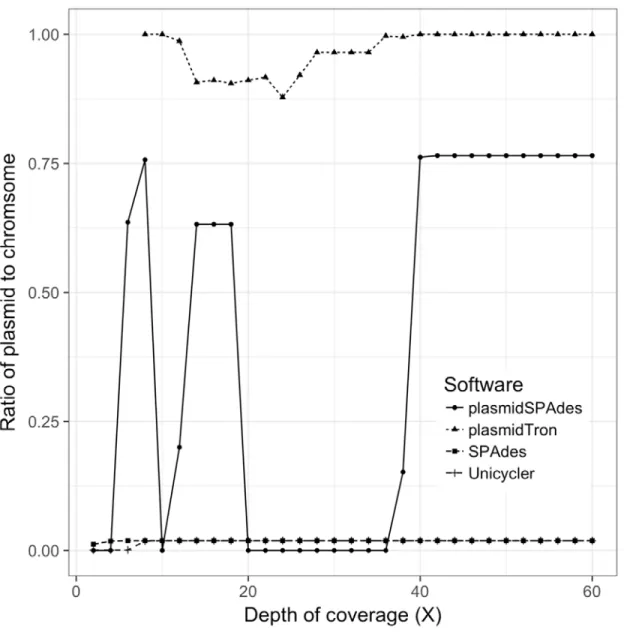
identify all of the plasmid sequence with less than 10X coverage, however the plasmid sequences 168
are fragmented and makes up only ~1.9% of the final assembly as show in Figure 3. PlasmidTron 169
requires slightly more coverage (16X) to generate an assembly which covers the full plasmid 170
sequence. At 16X more than 90% of the resulting assembly contains plasmid sequences, increasing 171
to 100% at 40X. 172
173
RECOVERY OF TYPING SEQUENCE
174
A real dataset of 114 isolates of S. Weltevreden, was sequencing using Illumina as described in (12). 175
The samples are clonal, with most sharing a similar plasmid, although the payload of the plasmid 176
itself varies greatly. To get a baseline for what plasmids are present in the input dataset, all of the 177
samples were compared to the PlasmidFinder (13) database (retrieved 2017-07-25) using Ariba 178
(v2.10.0) (14), providing the Incompatibility group. PlasmidFinder identifed one plasmid group, 179
IncFIIS, as present in 89.5% of samples. plasmidSPAdes, Unicycler, SPAdes, Recycler and PlasmidTron
180
were provided with the dataset and the results were searched for the IncFIIS sequence using blastn,
181
with full details listed in Supplementary Table 1. In 4 cases PlasmidFinder failed to identify the 182
sequence, when it was found by 2 or more other applications. SPAdes and Unicycler identify the 183
sequence in 88.6% and 87.7% of samples. plasmidSPAdes identifies the plasmid sequence in just 184
8.8% of samples. Recycler failed to identify the plasmid sequence in any sample. PlasmidTron 185
identified the plasmid sequence in 87.7% of cases where the chromosome sequence of S. 186
Weltevreden strain VNS10259 was used as the control, giving identical results to Unicycler. The 187
benefit though over Unicycler is that the majority of the assembled sequences correspond only to 188 the plasmid. 189 190
OUTBREAK AMR
191PlasmidTron was used to analyse an outbreak of 87 Salmonella enterica serovar Typhi (S. Typhi) 192
samples with a resistance profile which had not been previously observed in the haplotype (H58, 193
4.3.1)(15). Further analysis using PlasmidFinder, as previously described, indicated that the antibiotic 194
resistance may reside on an IncY plasmid, a plasmid type which had not been associated before with 195
this haplotype. The chromosomes of 6 complete reference genomes for S. Typhi were used as the 196
controls (accessions GCA_000195995, GCA_000007545, GCA_001157245, GCA_000245535, 197
GCA_001302605, GCA_000385905) for PlasmidTron, and 87 Illumina sequenced outbreak samples 198
were used as cases (Supplementary Table 2). For each outbreak sample, PlasmidTron identified 199
similar sequences, split over 4-5 contigs. One contig carried the IncY sequence and a second carried 200
AMR genes. Subsequent resequencing of 1 sample (ERS1670682) using long read technology (Oxford 201
Nanopore MinION), revealed that these 4 sequences comprised a single plasmid (accession number 202
GCA_900185485.1), which was identical in all of the outbreak strains. The sequences generated by 203
PlasmidTron recovered an average of 96% of the plasmid sequence. The fragmentation (mean 4.6) of 204
the plasmid in the Illumina sequenced samples was due to repeats which could not be resolved with 205
short read sequencing. Overall 65% of the sequences in the resulting assemblies were part of the 206
plasmid sequence, with the remainder resulting from a phage recombination in the main 207
chromosome. This indicates the power of PlasmidTron to rapidly, accurately and cost effectively 208
extract sequences of clinical importance from short reads alone. 209
210 211
CONCLUSION
212
We can utilise the wealth of phenotypic data usually generated for bacterial population studies, be it 213
routine diagnostics, surveillance or outbreak investigation, to reconstruct plasmids responsible for a 214
particular phenotype. Rather than just identifying that an AMR or virulence gene exists in a sample, 215
PlasmidTron can reconstruct all of the sequences of the plasmid it is carried on, providing more 216
insight into the underlying mechanisms. We demonstrated with simulated and real sequences that 217
PlasmidTron more accurately reconstructs large plasmids compared to other methods. We present 218
the results of a real outbreak of S. Typhi where PlasmidTron was used to identify the plasmid 219
sequence carrying a novel AMR resistance profile, not previously described in S. Typhi H58/4.3.1, 220
and validated the results using long read sequencing. Whilst plasmid assembly remains difficult with 221
short reads, PlasmidTron allows for phenotypic data to be utilised to greatly reduce the complexity 222
of the challenge. 223
224
AUTHOR STATEMENTS
225
This work was supported by the Wellcome Trust (grant WT 098051). Thanks to Martin Hunt, Kathryn 226
Holt and Ryan Wick for their helpful discussions and assistance with this work. Thanks also to Daryl 227
Domman for naming the software. 228
229 230
ABBREVIATIONS
231
MGE: mobile genetic element 232
WGS: whole genome sequencing 233
AMR: anti-microbial resistance 234 235 236
REFERENCES
237 2381. Arredondo-Alonso S, Schaik W van, Willems RJ, Schurch AC. On the (im)possibility of 239
reconstructing plasmids from whole-genome short-read sequencing data. Microb Genomics. 240
2017 Aug 18; 241
2. Antipov D, Hartwick N, Shen M, Raiko M, Lapidus A, Pevzner PA. plasmidSPAdes: assembling 242
plasmids from whole genome sequencing data. Bioinformatics. 2016 Nov 15;32(22):3380–7. 243
3. Wick RR, Judd LM, Gorrie CL, Holt KE. Unicycler: Resolving bacterial genome assemblies from 244
short and long sequencing reads. PLOS Comput Biol. 2017 Jun 8;13(6):e1005595. 245
4. Bankevich A, Nurk S, Antipov D, Gurevich AA, Dvorkin M, Kulikov AS, et al. SPAdes: A New 246
Genome Assembly Algorithm and Its Applications to Single-Cell Sequencing. Vol. 19. 2012. 455– 247
477 p. 248
5. Rozov R, Brown Kav A, Bogumil D, Shterzer N, Halperin E, Mizrahi I, et al. Recycler: an algorithm 249
for detecting plasmids from de novo assembly graphs. Bioinformatics. 2017 Feb 15;33(4):475– 250
82. 251
6. Deorowicz S, Kokot M, Grabowski S, Debudaj-Grabysz A. KMC 2: fast and resource-frugal k-mer 252
counting. Bioinformatics. 2015 May 15;31(10):1569–76. 253
7. Kokot M, Długosz M, Deorowicz S. KMC 3: counting and manipulating k-mer statistics. 254
Bioinformatics. 2017 Sep 1;33(17):2759–61. 255
8. Tange O. GNU Parallel - The Command-Line Power Tool. Login USENIX Mag. 2011 Feb;36(1):42– 256
47. 257
9. Li H. Aligning sequence reads, clone sequences and assembly contigs with BWA-MEM. 258
ArXiv13033997 Q-Bio [Internet]. 2013 Mar 16 [cited 2017 Jul 26]; Available from: 259
http://arxiv.org/abs/1303.3997 260
10. Li H, Handsaker B, Wysoker A, Fennell T, Ruan J, Homer N, et al. The Sequence Alignment/Map 261
format and SAMtools. Bioinformatics. 2009;25(16):2078–2079. 262
11. Camacho C, Coulouris G, Avagyan V, Ma N, Papadopoulos J, Bealer K, et al. BLAST+: architecture 263
and applications. BMC Bioinformatics. 2009;10:421. 264
12. Makendi C, Page AJ, Wren BW, Le Thi Phuong T, Clare S, Hale C, et al. A Phylogenetic and 265
Phenotypic Analysis of Salmonella enterica Serovar Weltevreden, an Emerging Agent of 266
Diarrheal Disease in Tropical Regions. PLoS Negl Trop Dis. 2016 Feb;10(2):e0004446. 267
13. Carattoli A, Zankari E, Garcia-Fernandez A, Larsen MV, Lund O, Villa L, et al. In Silico detection 268
and typing of plasmids using plasmidfinder and plasmid multilocus sequence typing. Antimicrob 269
Agents Chemother. 2014;58(7):3895–3903. 270
14. Hunt M, Mather AE, Sánchez-Busó L, Page AJ, Parkhill J, Keane JA, et al. ARIBA: rapid 271
antimicrobial resistance genotyping directly from sequencing reads. Microb Genomics. 2017 Sep 272
4; 273
15. Wong VK, Baker S, Connor TR, Pickard D, Page AJ, Dave J, et al. An extended genotyping 274
framework for Salmonella enterica serovar Typhi, the cause of human typhoid. Nat Commun. 275 2016 Oct;7:12827. 276 277 278
DATA BIBLIOGRAPHY
279Parkhill J et al, Salmonella enterica subsp. enterica serovar Typhi str. CT18, 2001, EMBL accession 280
number GCA_000195995. 281
282
Deng W et al, Salmonella enterica subsp. enterica serovar Typhi str. Ty2, 2006, EMBL accession 283
number GCA_000007545. 284
Ong SY, Salmonella enterica subsp. enterica serovar Typhi str. P-stx-12, 2012, EMBL accession 286
number GCA_000245535. 287
288
Xu D et al, Salmonella enterica subsp. enterica serovar Typhi str. Ty21a, 2013, EMBL accession 289
number GCA_000385905. 290
291
Muhamad Harish S et al, Salmonella enterica subsp. enterica serovar Typhi str. PM016/13, 2015, 292
EMBL accession number GCA_001302605. 293
294
Page AJ, Salmonella enterica serovar Weltevreden str. VNS10259, 2016, EMBL accession number 295
GCA_001409135. 296
297
Page AJ, Salmonella enterica serovar Typhi str. BL60006, 2017, EMBL accession number 298
GCA_900185485. 299
300
Page AJ, Salmonella enterica serovar Typhi str. ERL12148, 2017, EMBL accession number 301
GCA_001157245. 302
303 304
FIGURES AND TABLES
306
Figure 1:The PlasmidTron algorithm. FASTQ files are denoted as squares, FASTA files as
307
triangles and k-mer databases as circles.
308 309
310
Figure 2: The percentage of the plasmid sequence which was assembled with different
311
software applications as the depth of coverage of a plasmid increases in the raw data.
313
314
Figure 3: The ratio of the plasmid sequence to the chromosome sequence in the final
315
assembly produced by each software application as the depth of coverage of the plasmid
316
increases in the raw reads. This is akin to the signal to noise ratio.
317 318