78: 5–10 (2016) 116–125 | www.jurnalteknologi.utm.my | eISSN 2180–3722 |
Jurnal
Teknologi
Full Paper
A
COMPARATIVE
STUDY
ON
GENE
SELECTION
METHODS
FOR
TISSUES
CLASSIFICATION
ON
LARGE
SCALE
GENE
EXPRESSION
DATA
Farzana Kabir Ahmad*
Computational Intelligence Research Cluster, School of
Computing, College of Arts and Sciences, Universiti Utara
Malaysia, 06010 UUM Sintok, Kedah, Malaysia
Article history
Received 30 November 2015 Received in revised form
30 March 2016 Accepted 3April 2016
*Corresponding author
Graphical abstract
Abstract
Deoxyribonucleic acid (DNA) microarray technology is the recent invention that provided colossal opportunities to measure a large scale of gene expressions simultaneously. However, interpreting large scale of gene expression data remain a challenging issue due to their innate nature of “high dimensional low sample size”. Microarray data mainly involved thousands of genes, n in a very small size sample, p which complicates the data analysis process. For such a reason, feature selection methods also known as gene selection methods have become apparently need to select significant genes that present the maximum discriminative power between cancerous and normal tissues. Feature selection methods can be structured into three basic factions; a) filter methods; b) wrapper methods and c) embedded methods. Among these methods, filter gene selection methods provide easy way to calculate the informative genes and can simplify reduce the large scale microarray datasets. Although filter based gene selection techniques have been commonly used in analyzing microarray dataset, these techniques have been tested separately in different studies. Therefore, this study aims to investigate and compare the effectiveness of these four popular filter gene selection methods namely Signal-to-Noise ratio (SNR), Fisher Criterion (FC), Information Gain (IG) and t-Test in selecting informative genes that can distinguish cancer and normal tissues. In this experiment, common classifiers, Support Vector Machine (SVM) is used to train the selected genes. These gene selection methods are tested on three large scales of gene expression datasets, namely breast cancer dataset, colon dataset, and lung dataset. This study has discovered that IG and SNR are more suitable to be used with SVM. Furthermore, this study has shown SVM performance remained moderately unaffected unless a very small size of genes was selected.
Keywords: DNA microarray, Gene selection, Classification, Feature selection, Filter based gene selection method
Abstrak
DNA microarray merupakan satu ciptaan teknologi baru yang mampu menyediakan peluang untuk mengukur gen pada skala besar sekaligus. Walau bagaimanapun, mentafsir data ekspresi gen pada skala besar terus menjadi isu yang sangat mencabar kerana sifat semula jadinya" dimensi saiz yang tinggi dan sampel rendah". Data microarray melibatkan beribu-ribu gen, n di dalam sampel saiz yang sangat kecil, p yang merumitkan proses analisis data. Oleh sebab itu, kaedah pemilihan ciri juga dikenali sebagai kaedah pemilihan gen telah menjadi satu keperluan utama dalam proses pemilihan gen yang penting untuk maksimumkan kuasa diskriminatif antara tisu kanser dan normal. Kaedah pemilihan ciri boleh distrukturkan kepada tiga kumpulan asas; a) kaedah penapis; b) kaedah pembungkus dan c) kaedah terbenam. Di antara kaedah-kaedah ini, kaedah pemilihan penapis gen menyediakan cara yang mudah untuk mengira gen yang bermaklumat dan sekaligus mengurangkan dataset microarray pada skala besar. Walaupun gen teknik pemilihan penapis telah biasa
digunakan dalam menganalisis microarray dataset, teknik-teknik ini telah diuji secara berasingan dalam kajian yang berbeza. Oleh itu, kajian ini berhasrat untuk menyiasat dan membandingkan keberkesanan empat popular kaedah pemilihan penapis gen iaitu Signal-Noise-Ratio (SNR), Fisher Criterion (FC), Information Gain (IG) dan t-Test dalam memilih gen bermaklumat yang boleh membezakan kanser dan tisu normal. Dalam kajian ini, pengelas biasa Support Vector Machine (SVM) telah digunakan untuk melatih gen yang dipilih. Kaedah-kaedah pemilihan gen diuji pada tiga skala besar set data ekspresi gen, iaitu kanser dataset payudara, dataset kolon dan dataset paru-paru. Kajian ini telah mendapati bahawa IG dan SNR adalah lebih sesuai untuk digunakan dengan SVM. Tambahan pula, prestasi SVM dalam kajian ini telah menunjukkan kekal sederhana dan tidak terjejas kecuali gen dengan saiz yang sangat kecil dipilih.
Kata kunci: Microarray DNA, pemilihan gen, klasifikasi, pemilihan ciri-ciri, kaedah pemilihan berdasarkan gen penapis
© 2016 Penerbit UTM Press. All rights reserved
1.0 INTRODUCTION
Over the past decades, extensively studies on cancer have been carried out by many researchers from different fields [5, 8]. However, due to morphological and genetic heterogeneity of the disease, cancer is still perceived by many patients as a life-threatening event. Furthermore, it is very difficult to differentiate patients since patients who undergo similar regimen treatments may develop different clinical outcome [8, 12].
To manage such challenges, several
computational methods have been extensively used for decades to understand and provide better assessment in cancer diagnosis. In the early days, Artificial Neural Network (ANN), Support Vector
Machine (SVM), Decision Tree and other
computational techniques have been used to predict the probability of cancer recurrence and survivability on clinical data [5, 13]. Although numerous studies have been conducted in this area,
the accuracy and performance of these
computational models are still questionable. Furthermore, an additional option to probe deeper into cellular mechanisms is compulsory since this devastating disease mainly initiated from accumulation of gene alterations that disrupt the normal cellular activities and ultimately cause tumor growth
To address this problem, the recent invention of DNA microarray technology has provided enormous opportunities to measure a large-scale of the expressions of thousands of genes at once. This new development has modernized the approach of biological research in such a way that cancerous cells can be analyzed simultaneously. Moreover this technology has brought a great impact in cancer research by understanding the biological aspect of cancer based on their molecular features. Consequently, microarray technology acts as a blueprint that helps to reveal how the genome works and unlock the biological functions.
Although microarray technology offers a new platform in investigating cancer, analyzing
large-scale of gene expression data generated by this device is not an easy task [4]. Analyzing and interpreting large scale of gene expression data remain a challenging issue due to their innate nature of “high dimensional low sample size” [4, 11]. Microarray data mainly involved thousands of genes,
n in a very small size sample, p. In addition, this data are often overwhelmed, over fitting and confused by the complexity of data analysis [2]. Due to the nature of this microarray data, it is common that a large number of genes are may not informative for classification because these genes can be either irrelevant or redundant.
For such a reason, feature selection methods also known as gene selection methods become apparently need for both domains: biology and computation/statistics. Selecting significant genes that present the maximum discriminative power between cancerous and normal cells or between different types of cancerous cells is a central step towards understanding the underlying biological process which becomes one of the vital research areas in microarray data analysis. The identification of a small number of key genes can help biologists to get a better understanding of the disease mechanism. On the other hand, computational and statistic experts are more concern in dealing with the noisy data with redundant features and avoiding the over-fitting issues, which often happen when there are only small number of samples. Thus, gene selection can significantly ease computational burden of the classification task by removing the meaningless the number of genes and significantly enhance the classification accuracy [11].
Hence, this study aims to explore filter gene selection methods in determining the informative genes which are most predictive to its related class for tissue classification. Four popular filter gene selection methods namely Signal-to-Noise ratio (SN), Fisher Criterion (FC), Information Gain (IG) and t-Test are examined using common classifiers, SVM. These gene selection methods are tested on three large scales of gene expression dataset, namely breast cancer dataset, colon dataset, and lung dataset.
2.0 PREVIOUS WORKS
At present, microarray technology has amazed researchers with the dawn of data-rich era by the emergence of many online resources. Various institutions either commercial entities or academic organizations have contributed to the development and creation of public repositories, for instance the Array Express(http://www.ebi.ac.uk/arrayexpress), which are accessible from European Bioinformatics Institute (EBI). Consequently, the development of the
high-throughput technologies such as DNA
microarray has led to incremental growth in the secondary datasets.
The trend of this growth can be perceived from National Center for Biotechnology Information (NCBI) public repositories as shown in Figure 1. This modernized approach has created data-rich era, whereby various kind of public databases have been created since 1980 till 2012.
Figure 1 National Center for Biotechnology Information (NCBI) public repositories
In addition, this figure also shows that the used and demand of these databases have been increase since the years 1980. The emergence of these big data requires researchers to analyze and explore large-scale gene expression profile to identify
gene markers that present the maximum
discrimination power between cancerous and normal cells. Hence, microarray data management and analysis has becomes a complicated and challenging task. Furthermore, conventional data management seems to be impractical as this kind of data involves many attributes and features. Consequently, data mining and machine learning techniques were implemented to discover the hidden patterns and extract useful information from these massive large scale gene expression datasets.
Indisputably, identifying hidden patterns and obtaining useful knowledge from these gene expression data is a complicated process. This is mainly due to the nature of gene expression data that contains large number of features, p in a very
small sample size, n. This scenario is known as high-dimensionality problem. To address this issue, many previous researchers have applied a dimensionality reduction approach. Dimensionality reduction is the common approach to eliminate irrelevant and redundant features from large datasets. Generally,
dimensionality reduction approach can be
categorized mainly into two main categories; (1) feature extraction and (2) feature selection.
The main these approaches is that feature extraction plan to recreate an innovative feature space with lower dimensional space that are mimic the nature of original features. There are several popular feature extraction techniques which include Canonical Correlation Analysis (CCA), Linear Discriminant Analysis (LDA) and Principle Component Analysis (PCA). In contrast, the feature selection approach aims to choose only a small subset of features that can possibly minimize redundant features and optimize its relevancy to classify the target data into a correct class. Information Gain, Relief, Fisher Score and Lasso are common representative of feature selection techniques. Although both feature extraction and feature selection objective is to improve learning performance, lowering computational complexity, building better generalizable models, and decreasing required storage, normally feature selection and feature extraction are presented separately in research field.
Ideally, feature extraction aims to recapture the information from primary feature space and to reorganize it in new feature space to reduce large number features space dimensions. Although, this technique can obtain less number of features, it is quite hard to associate the new features with primary feature space. Therefore subsequence analysis on these new features is tricky as there is no solid significance for the transformed features obtained from wrapper feature extraction techniques. On the other hand, feature selection selects a subset of features from the original feature set without any transformation, hence maintains the physical meanings of the original features. For such its unique characteristics, feature selection is superior in terms of better readability and interpretability. Furthermore, this property has its significance in many practical applications such as finding relevant genes to a specific disease. For such reasons, feature selection is used in this study to determine the informative genes which could lead to better accuracy performance for tissue classification.
Feature selection is a widely employed technique for reducing dimensionality among practitioners. It aims is to choose a small subset of the relevant features from the original ones according to certain relevance evaluation criterion, which usually leads to better learning performance (e.g., higher learning accuracy for classification), lower computational cost, and better model interpretability. The key idea of gene selection techniques is to allow the learning algorithm focuses only on those aspects of the
training data that are useful for analysis and future prediction.
In addition, there are several others major objectives of feature selection methods which include, i) to avoid over fitting and improve model performance, for example selecting highly informative genes that could enhance the accuracy of classification model, ii) to provide faster and more cost-effective models, and iii) to gain a deeper insight into the underlying processes that generated the data. Even though, feature selection techniques have many benefits, but it also introduces extra complexity level, which requires thoughtful experiment design to address the challenging tasks yet provide fruitful results. As a result, feature selection techniques have been used in a typical classification task in order to separate healthy patients from cancer patients based on their gene expression „„profile‟‟ (binary approach), or to distinguish among different types of tumors (multiclass approach), in which the task is even more complicated [4, 11.
Principally, feature selection methods search through the subsets of features by using some evaluation functions in order to find the optimal features among the competing 2m candidate
subsets. However this procedure is exhaustive, too costly and practically unreasonable, even for a medium-sized feature set size (m). As a result, appropriate feature selection method is introduced to address the NP hard problem of massive gene expression data. This study defines features set and class label asF
f1,f2, f3,...,fm
and
c
c
c
c
K
C
1,
2,
3,
...,
, where m and K are the numbersof features and labels, respectively.
mxnn
x x x
X 1, 2,...., , is the data where n is the
number of instances.
Generally, feature selection methods can be structured into three factions, which are filter methods, wrapper methods and embedded methods. Filter methods rank each feature according to some univariate metric, and only the highest ranking features are used while the remaining low ranking features are eliminated. A wrapper method on the other hand, embeds a gene selection method within a classification algorithm. In the wrapper methods, a search is conducted in the space of genes, evaluating the goodness of each found gene subset by the estimation of the accuracy percentage of the specific classifier. Lastly, embedded method performs feature selection by iteratively training a classifier with the current set of features and removing the least important feature. This method mainly built the search mechanism into the classifier model. The three fraction of feature selection methods namely, filter method, wrapper method and embedded method are explained in detail below.
2.1 Filter Based Gene Selection Method
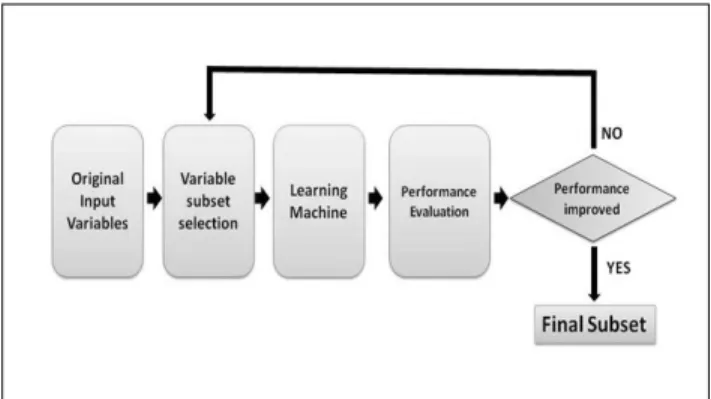
As discussed earlier, filter based gene selection method is one of the fraction of feature selection. This method mainly relies on the characteristics of data to identify relevant and significant features without involving any classification algorithms. In recent years, filter methods have become increasingly popular as these methods can reduce the dataset size before classification. There are typically two main steps in a filter algorithm. First of all, filter method will ranks all features based on certain principles or standards. This assessment of feature could be constructed in either univariate or multivariate scheme. In the univariate scheme, each feature is sorted individually of the feature space, while features are evaluated in a batch form for the multivariate scheme. In the second step, the features with highest rankings are chosen to induce classification models. Figure 2 shows the steps involved in filter based gene selection method.
Figure 2 The steps involved in filter based gene selection method
Various kind of filter gene selection techniques have been used in ranking and selecting significant genes such as correlation based filter (CFS) [6], Bayesian scoring functions, signal-to-noise ratio [7], Euclidean distance, Information Theory based scoring, fold change analysis, t-test, information gain, Whitney rank sum, Gini index and many others [10, 11].These techniques mainly rely on general characteristics of the training data to select some features without involving any learning algorithm. Therefore, the results of filter model will not affecting any classification algorithm [11]. Regardless, the prominent used of filter based methods in identifying informative genes in microarray data analysis the performance of each technique is quite different.As a result, different types of univariate technique appear to be significant when it was trained over various datasets.
Moreover univariate filter methods have been widely utilized in microarray data analysis. This trend can be clarified by a number of reasons for instance the output the result provide by univariate gene rankings is intuitive and easy to understand. These
simplify version of output could fulfill the aims and expectations of biology and molecular domain experts who demand for validation of result using laboratory techniques. In addition, filter methods also offer less computational time to generate results which is an extra point to be preferred by domain experts.
2.2 Wrapper Based Gene Selection Method
Quite different from filter techniques that select the features/genes independently, a wrapper method embeds a gene selection method within a classification algorithm as one component. In the wrapper methods, a search is conducted in the space of genes, in order to evaluate the quality of classifier performance till a desired accuracy percentage is obtained. Later the classifier will only tested using a new set of data with only selected subset of features/genes. Given a particular classifier, the following stages are executed in a common wrapper method:
Stage 1: examining a subset of features,
Stage 2: assessing the selected subset of features based on the performance of the classifier,
Stage 3: iterating Step 1 and Step 2 until the desired outcome is obtained.
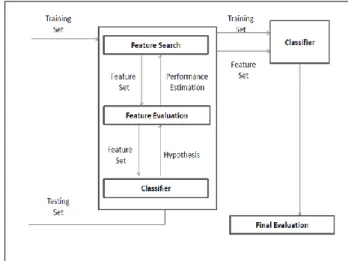
Figure 3 demonstrated a general framework for wrapper methods gene classification, and it contains three main elements:
I. Feature selection search – mechanism to examine all possible feature subsets in receiving the relevant subset of features, II. Feature evaluation – assessing the significant
of features and its corresponding
performance on a selected classifier, and III. Induction algorithm- takes specific instances
and produces a model that generalizes beyond these instances
The predefined classifier works as a black box in wrapper models. A set of features/genes are produced in the feature search and the classifier‟s performance is evaluated in the feature evaluation component. In the next iteration, another set of feature/genes subset is picked again from feature search component. Feature/gene set with the highest estimated value is chosen as the final set to learn the classifier. Another set of testing data is later used to examine the performance of the classifier.
Generally, wrapper methods can be allocated into diverse groups, deterministic and randomized search algorithm. Genetic Algorithm (GA) is a randomized search algorithm that aims to optimize the feature space by mimicking the evolution of genetics process. This algorithm has been employed in many binary and multi-class cancer discrimination. Furthermore, a wide range of search strategies also have been used, which include hill-climbing,
best-first, and branch-and-bound. Although wrapper approach is very common in any machine learning applications, it has not being comprehensively used in DNA microarray tasks, and only few works in the field have applied this method.
Figure 3 A general framework for wrapper methods
Some studies have discovered that wrapper models obtains better analytical accuracy compare to the filter [10, 11], however its computational cost is high and must carefully addressed. Additionally, the wrapper results are highly associated with type of classifier selected by researchers. Since this study aim to select features that maximize the quality of any classifier, therefore the selected subset of features using wrapper approach is inevitably biased to the predefined classifier.
2.3 Embedded Based Gene Selection Method
Like wrapper method, embedded method also encapsulate feature selection component within the classifier. Accordingly, this method inherit have the advantages of the wrapper models in which
embedded method incorporate interaction
between feature selection and classification model and furthermore offers computationally inexpensive processing power.
Commonly, embedded methods can be classified under three types. The first type are pruning methods in which it firstly employed all features to train a model and then attempt to eliminate some features by setting the corresponding coefficients to 0, while maintaining model performance such as recursive feature elimination using support vector machine (SVM) [10, 11]. The second types are methods with a build-in mechanism for feature selection such as ID3 and C4.5. The third are regularization models with objective functions that minimize fitting errors and in the meantime force the coefficients to be small or to be exact zero. Features with coefficients that are close to 0 are then
eliminated.Based on the review that has been made and advantages of filter based method, this approach has been selected in this study in choosing significant genes. Next section elaborates the related works on comparative studies based on filter method.
2.4 Previous Comparative Studies of Filter Based Gene Selection Method
Gene selection methods have been widely used by many researchers in the past decades to select the most effective genes from high dimensional microarray data. As a result, many studies have used different types of genes selection method to obtain significant and optimal genes that can distinguish cancerous and normal tissue.
Among several gene selection methods as mentioned above, filter gene selection methods provide easy way to calculate the informative genes and can simply scale to large scale microarray datasets since it only have a short running time. In addition, the ranked genes obtained from these methods are also preferred by domain experts as it can easily be interpreted.
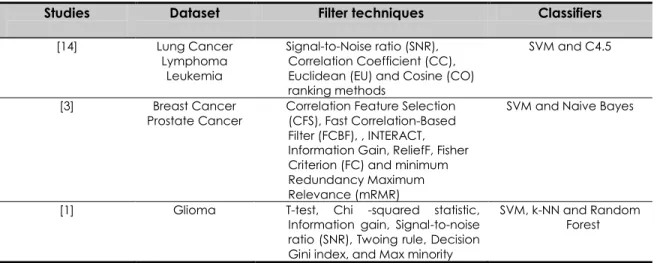
Although filter based gene selection techniques have been commonly used in analyzing microarray dataset, these techniques have been tested separately in different studies [9, 10, 11]. Thus, the comparative performances of different filter based gene selection methods are hardly perceived. Lately, a number of studies have conducted comparative studies of filter method on different datasets as shown in Table 1. This table presents a commonly filter based gene selection methods such as Signal-to-Noise ratio (SNR), Fisher Criterion (FC), Information Gain (IG) and t-Test that will be used in this study. In addition, SVM has been discovered as popular classification methods to distinguish cancer and normal tissues.
Table 1 Several studies have conducted comparative studies of filter method on different datasets
Studies Dataset Filter techniques Classifiers
[14] Lung Cancer Lymphoma
Leukemia
Signal-to-Noise ratio (SNR), Correlation Coefficient (CC), Euclidean (EU) and Cosine (CO) ranking methods
SVM and C4.5
[3] Breast Cancer
Prostate Cancer Correlation Feature Selection (CFS), Fast Correlation-Based Filter (FCBF), , INTERACT, Information Gain, ReliefF, Fisher Criterion (FC) and minimum Redundancy Maximum Relevance (mRMR)
SVM and Naive Bayes
[1] Glioma T-test, Chi -squared statistic, Information gain, Signal-to-noise ratio (SNR), Twoing rule, Decision Gini index, and Max minority
SVM, k-NN and Random Forest
3.0 METHODOLOGY
In the recent years, only a few studies have been conducted to compare the performance of filter based gene selection method. Therefore, this research aims to explore gene selection methods in determining the informative genes which could offer better predictive values to its related class in examining the large scale of gene expression data. This approach is essential for scientist to get deeper insight into molecular level, while able to identify genes that could lead to cancer progression. The research framework proposed in this study consists of three main phases, which are data pre-processing, gene selection, and the validation. Each of these phases is described in the following sections.
3.1 Phase 1 – Data Preprocessing
The data pre-processing phase encompasses of three main steps; (1) obtain microarray dataset (2) impute missing values and (3) normalized gene expression value. In the initial step, datasets used in this study are clearly determined from previous works. The proposed method is performed and tested on three large scales of gene expression datasets, namely breast cancer dataset, colon dataset, and lung dataset. These datasets are obtained from Kent Ridge Biological Data Set Repository. Each microarray datasets will be described by the following parameters. (1) Genes: the number of genes or attributes (2) Class: the number of classes, (3) Record: the number of samples in the dataset. Furthermore in this research, prior the subsequent analysis, the KNN imputation method is applied to
estimate missing values in microarray data. The key idea in implementing this method is to achieve maximum accuracy, while utilizing the small sample size to the fullest. Moreover, min-max normalization is used to normalize the datasets.
3.2 Phase 2 – Gene Selection
In this phase, four popular filter gene selection methods namely SNR, FC, IG and T-test are used to select the informative genes that can provide optimum discriminative power to classify cancerous tissues. During the feature selection phase, the number of selected genes is defined as 20, 50,100, 200 and 500 for all filter gene selection methods. To study the performance of these gene selection techniques, Support Vector Machine (SVM) is used as benchmarks classification algorithms. Details of each filter gene selection methods are given below, while Figure 4 shows the pseudocode of this gene selection process.
3.2.1 Signal-to-Noise Ratio (SN)
SNR computes the mean µ and the standard deviation, σ for each feature (gene) to identify the expression patterns with a maximal difference in mean expression between two groups and minimal variation of expression within each group. SNR has been used in cancer classification of gene expression data. For binary class, SNR is computed as described below:
𝑆𝑁𝑅 =𝜇+− 𝜇− 𝜎+− 𝜎−
where µ+, is the mean for class positive and µ- is the mean for class negative. σ+ and σ- are the standard deviation for class positive and negative respectively.
3.2.2 Fisher Criterion (FC)
FC on the other hand is a measurement that indicates how much the class distributions are separated. FC is calculated as follow:
𝐹𝐶 = (𝜇1− 𝜇2)2 𝜐1+ 𝜐2
where µi, is the mean and 𝜐i is the variance of the
given gene in class i (where class i include positive class, the normal tissue classification and negative class, tumour tissue classification).
3.2.3 Information Gain (IG)
Information gain (IG) is a univariate filter method that has been widely used in microarray data to identify informative genes. This method computes how well a given feature separates the training samples according to their class labels. It measures the expected reduction in entropy caused by splitting the samples according to a particular feature. For
feature F and samples S the information gain is computed by: 𝐼𝐺 𝐹, 𝑆 = |𝑆𝑣| |𝑆| 𝐸𝑛𝑡𝑟𝑜𝑝𝑦 𝑆 − 𝐸𝑛𝑡𝑟𝑜𝑝𝑦(𝑆𝑣) 𝑣=𝑣𝑎𝑙𝑢𝑒𝑠 𝐹 𝐸𝑛𝑡𝑟𝑜𝑝𝑦 𝑆 = −𝑝𝑖 𝑘 𝑖=1 . 𝑙𝑜𝑔2𝑝𝑖
where k is the number of different classes, and pi is
the proportion of S belonging to class i. Values(F) is the set of all possible values for feature F, and Sv is the
subset of S that is consisting of samples for which feature F has the value v.
3.2.4 T-test
Additionally, T-test is one of the most popularly used filter methods for feature selection. This method measures the statistical significance of a difference of a particular feature between the two classes. Genes with the largest t-test are then selected. T-test is computed as explained below:
𝑇 − 𝑡𝑒𝑠𝑡 = |𝜇𝑖 +− 𝜇 𝑖−| (𝜎𝑖+)2 𝑛+ + (𝜎𝑖−)2 𝑛−
where µi, σi, and n are the mean, standard deviation and sample size in the positive and negative classes.
3.3 Phase 3 – Validation
In the third phase, the performance of filter based gene selection method are analyzed and discussed. The performances of gene selection are evaluated using Receiver Operating Characteristics (ROC). At this phase, the accuracy, and specificity of each classifier is calculated. In this study, the sensitivity value is set to 90%. Additionally, in this experiment a tenfold cross-validation method is also carried out for each classification method to test its accuracy.
4.0 RESULT AND DISCUSSION
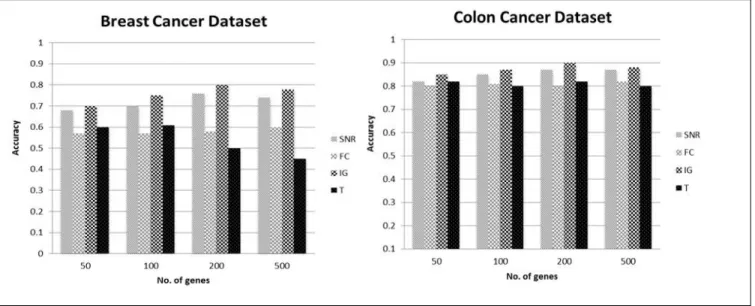
In this research, four popular filter gene selection methods namely SNR, FC, IG and t-Test are analyzed and compared to determine the effectiveness of these techniques in selecting informative genes that can distinguish cancer and normal tissues. In this experiment, SVM is used to classify the tissue.The number of selected genes is defined as 50, 100, 200 and 500 for all filter gene selection methods. In addition, to closely examine the effectiveness of filter based gene selection method, the large scale gene expressions were first classified using SVM without performing any feature selection.
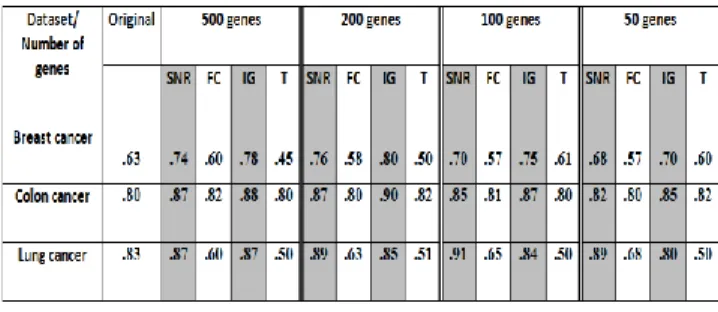
Table 2 shows the results of the ten-fold cross validation for each technique in order to test its accuracy. Figure 5 on the other hands illustrates the
detailed results for four different filter gene selection methods run on SVMs classifier, and tested on three different datasets.
Figure 4 Pseudocode of filter based gene selection method
The results in Table 2, Table 3 and Figure 5have shown that the SVM classifier has obtained a higher accuracy once the microarray datasets are per-processed using four filter gene selection techniques in comparison to the original data, with SNR and IG technique performed the best. It has also been noted that SNR and IG has improved the accuracy of breast cancer and colon dataset with an improvement of 11% and 21% respectively. In addition, SNR and IG have enhanced the accuracy up to 14% in lung cancer dataset.
Table 2 The accuracy results of SVM classifier on ten-fold cross validation
Table 3 The specificity results of SVM classifier on three datasets
Algorithm 1: Gene selection based on filter method
Input: Gene expression data, x = (x1, x2… xnp), where n is the number of gene and p is the number of sample size. The class labeled for each class is assigned to Y
⊂ {+1, -1}, where +1 represent normal tissues and -1 denotes to tumor tissues.
Output : Top T genes based on discriminative score
1:begin
2:S1: Achieve the microarray dataset with p samples and n, number of genes
3:S2: Number of genes selected , T(1-500), C = filter techniques (Fishercriterion, signal-to-noise, Information gain and t- test)
4 Ten-Cross-Validation 5:S3 = For i to 1 to p
Leave ith tissues sample out
6:Filter based techniques to determine the discriminative score
7:S4: Calculate the discriminative score by using different filter techniques, C
8:S4.1 Apply the formula of the filter techniques to calculate the score
9:S4.2 Rank the score
S4.3 Select the informative score
10:S5: Train the SVM classifier by taking only selected genes
11:S5.1 Test the classifier on the remaining p-1 sample tissues
12:S5.2 Record the results
13:S6: Calculate the ROC score
14:end for
15: S7: Repeat the process S2-S6 for every filter based gene selection techniques 16:end Classifier Gene selection technique Specificity (%) Breast
cancer cancer Colon cancer Lung
SVM
SNR 77% 86% 83%
Figure 5 SVM tested on three datasets; Breast cancer dataset (a), Colon cancer dataset (b)
Figure 6 SVM tested on three datasets; Lung cancer dataset (c)
Meanwhile the results have shown that there is not improvement even if the data has been pre-processed using FC and T-test for breast cancer and lung cancer datasets.However, minor accuracy change has been noted for these techniques (FC and T-test) when it have been applied on colon dataset as shown in Table 2. In addition, this study has demonstrates that all four filter based gene selection techniques have performed much better in colon dataset in comparison to other two dataset, namely breast cancer and lung cancer datasets. Moreover, the performance of SVM is reported reasonably consistent in respect to the change of number of genes in each training sets.
It also has been witnessed that the performance of SVMs is improved once the data is pre-processed compared to its performance when tested on the original data. However, it is interesting to note that
not all gene selection methods could enhance SVM classification performance. The results indicate that only certain gene selection improves the performance of SVM classification methods in general. This study has discovered that IG and SNR are more suitable to be used with SVM. IG is reported to be a significant gene selection technique mainly due to its goal which is to select a minimum set of attributes that represent close probability distribution of the data classes to the original distribution obtained when all attributes are used. Additionally, all four gene selection techniques performed considerably better in colon dataset in comparison to breast cancer and lung cancer datasets. This is mainly due to the small number of genes in colon dataset, compare to large number of genes in breast cancer and lung cancer in a small sample size, which cause high dimensionality problem.
5.0 CONCLUSIONS
This study aims to explore filter gene selection methods in determining the informative genes which could offer better predictive values in order to classify tissue to its related class. Four popular filter gene selection methods namely SN, FC, IG and t-Test are examined using common classifiers, SVM. These gene selection methods are tested on three large scales of gene expression datasets, namely breast cancer dataset, colon dataset, and lung dataset. Different experiments have been applied to compare the performance of the classification methods with and without performing feature selection.
The experimental results also have shown that SVMs performance in term of accuracy matrix has improved when tested on the pre-processed datasets rather than when ran on the original datasets. However, surprisingly the results indicate
that only certain gene selection could enhance the performance of SVM classifier. This study has discovered that IG and SNR are more suitable to be used with SVM. In a colon dataset, SVM has achieved a specificity of 86% with SNR feature selection technique while 90% of specificity is obtained for IG.
IG is reported to be a significant gene selection technique mainly due to its ability to select a minimum set of attributes that represent close probability distribution of the data classes to the original distribution obtained when all attributes are used. Furthermore, this study has shown SVM performance remained moderately unaffected unless a very small size of genes was selected. This result ensures that the number of genes can be reduced to a smaller size without jeopardize the accuracy performance of classification.
Acknowledgement
This research is fully supported by University grant. The authors fully acknowledged Ministry of Higher Education (MOHE) and Universiti Utara Malaysia for the approved fund which makes this important research viable and effective.
References
[1] Abusamra, H. 2013. A Comparative Study of Feature Selection and Classification Methods for Gene Expression Data of Glioma. Procedia Computer Science, Elsevier. 23: 5-41.
[2] Ahmad, F. K., Deris, S., Othman, N. H. and Norwawi, N. M. 2009. A Review of Feature Selection Techniques via Gene Expression Profiles. IEEE International Symposium on Information Technology (ITSim). 75-84.
[3] Bolon-Canedo,V., Sanchez-Marono, N., Alonso-Betanzos, A., Benitez, J. M., Herrera, F. 2014. A Review of Microarray Datasets and Applied Feature Selection Methods.
Information Sciences. 282: 111–135.
[4] Chen, K. H., Wang, K. J., Tsai, M. L., Wang, K. M., Adrian, A. M., Cheng, W.-C., Chang, K. S. 2014. Gene Selection for Cancer Identification: A Decision Tree Model Empowered by Particle Swarm Optimization Algorithm. BMC Bioinformatics. 15(1): 49-64.
[5] Cruz, J. A. and Wishart, D. S. 2006. Applications of Machine Learning in Cancer Prediction and Prognosis. Cancer Informatics. 2: 59-78.
[6] De Campos, L. M., Cano, A., Castellano, J. G., & Moral, S. 2011. Bayesian Networks Classifiers for Gene-Expression Data. Proceeding of IEEE International Conference on Intelligent Systems Design and Applications. 1200–1206. [7] Hu, H., Li, J., Wang, H. and Daggard, G. 2006. Combined
Gene Selection Methods for Microarray Data Analysis.
Knowledge-Based Intelligent Information and Engineering Systems. 425: 976-983. Springer-Verlag Berlin Heidelberg. [8] Kourou, K., & Fotiadis, D. I. 2015. Computational Modelling
in Cancer : Methods and Applications. Biomedical Data Journal. 1(1): 15–25.
[9] Lacroix, M., Toillon, R.A. and Leclercq, G. 2006. Breast Cancer, An Update. Endocrine-Related Cancer. 13(53): 293–325.
[10] Kumari, B., & Swarnkar, T. 2011. Filter versus Wrapper Feature Subset Selection in Large Dimensionality Microarray : A Review. International Journal of Computer Science and Information Technologies. 2(3): 1048–1053. [11] Lazar, C., Taminau, J., Meganck, S., Steenhoff, D., Coletta,
A., Molter, C., Nowé, A. 2012. A Survey on Filter Techniques for Feature Selection in Gene Expression Microarray Analysis. IEEE/ACM Transactions on Computational Biology and Bioinformatics. 9(4): 1106–19.
[12] Marylyn, R., & Kim, D. 2014. Data Integration for Cancer Clinical Outcome Prediction. Journal of Health & Medical Informatics. 4–5.
[13] Sweilam, N. H., Tharwat, A., & Abdel Moniem, N. K. 2010. Support Vector Machine for Diagnosis Cancer Disease: A Comparative Study. Egyptian Informatics Journal. 11(2): 81–92.
[14] Zhang, Z., Li, J., Hu, H., and Zhou, H. 2010. The Effectiveness of Gene Selection for Microarray Classification Methods. ACIIDS'10 Proceedings of the Second International Conference on Intelligent Information and Database Systems. 300-309. Springer-Verlag Berlin, Heidelberg.