ISM-Benchmark ver.3.1
- Statistical Information of Basic Data used in Diagnosis
1. How well is the ISM-Benchmark being used?
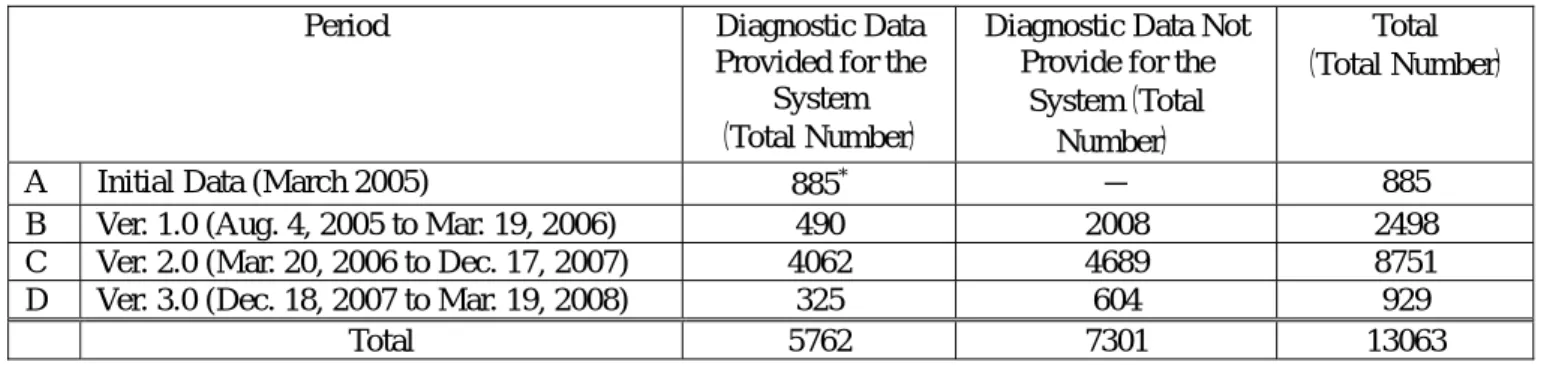
Table 1 shows the number of records collected from Aug. 4, 2005 to Mar. 19, 2008. By March 19, 2008, the number of records had exceeded 13,000. Among those records, more than 5,000 records (including 885 for initial data) are used by this system as basic data for diagnosis.
Table 1 Number of Diagnosis Performed (As of Mar. 19, 2008)
Period Diagnostic Data
Provided for the System (Total Number)
Diagnostic Data Not Provide for the
System(Total Number)
Total (Total Number)
A Initial Data (March 2005) 885* − 885
B Ver. 1.0 (Aug. 4, 2005 to Mar. 19, 2006) 490 2008 2498
C Ver. 2.0 (Mar. 20, 2006 to Dec. 17, 2007) 4062 4689 8751
D Ver. 3.0 (Dec. 18, 2007 to Mar. 19, 2008) 325 604 929
Total 5762 7301 13063
* Initial data (885) was collected from a questionnaire that was conducted at the time this system was developed.
The ISM-Benchmark is a comparative and quantitative assessment tool which shows scores of the security measures and the chart where the user company can check its position compared with others. In the comparative assessment it might be possible that the result may change depending on which data the user company will be compared.
Considering rapidly changing information security environment, ISM-Benchmark ver.3.1 was designed to use the data of the past two years as basic data for diagnosis. The duplicated data was removed from the data collected from Mar. 20, 2006 to Dec. 17, 2007, reaching 2165 records. The following sections show the statistical information for 2165 records.
2. Comparing Information Security Measures Implemented by each Group
Based on Information Security Risk Index1, the user companies (or user organizations) are classified into three groups: Group I (high level IT security measures are required), Group II (Medium level IT security measures are required) and Group III (Not thorough level IT security measures are required.) Organizations whose Information Security Risk Index is 0.6 or above are classified as Group I while those with -0.79 and below are classified as Group III. The rest is Group II.
Table 2 shows total scores and relevant information of each group. Frequency distribution of total scores is shown in Figure 1 and scores for 25 items related to security measures in Figure 2.
1
Information Security Risk Index indicates risks to which organization is being exposed. Information Security Risk Index is calculated based on several factors, including the number of employees, sales figures, the number of critical information held and degree of dependence on information technology.
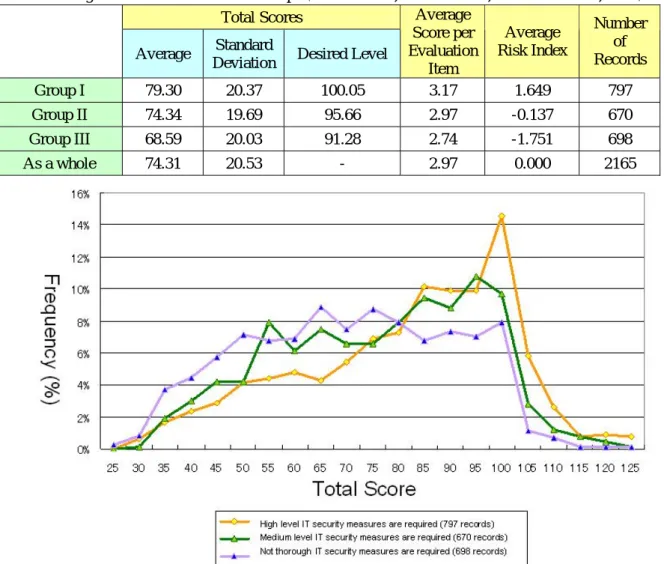
Table 2 Average Total Scores2 for each Group (2165 records, from Mar. 20, 2006 to Dec. 17, 2007) Total Scores
Average Standard
Deviation Desired Level
Average Score per Evaluation Item Average Risk Index Number of Records Group I 79.30 20.37 100.05 3.17 1.649 797 Group II 74.34 19.69 95.66 2.97 -0.137 670 Group III 68.59 20.03 91.28 2.74 -1.751 698 As a whole 74.31 20.53 - 2.97 0.000 2165
Figure 1 Frequency Distribution of Total Scores (2165 records, from Mar. 20, 2006 to Dec. 17, 2007)
Figure 2 Scores for 25 Items (2165 records, from Mar. 20, 2006 to Dec. 17, 2007)
2
Based on your answer to 25 questions (5 sections) related to security measures, your score is calculated. The highest score is 125 points with each question giving 5 points at best. If your score was 75, it would mean that you got an average of 3 points for each question. 3 points mean that your organization are implementing the measure but does not review the state of implementation.
Figure 2 shows no big difference in the average scores of three groups. On the contrary, Figure 1 shows clear differences. Among the Group I, organizations that marked 96 to 100 points accounted for 14.6% while those that marked 76 points or above accounted for 62.6%. For this group, as total score increases, so does frequency. It means that most of the organizations in Group I are implementing security measures required. On the other hand, among the Group II, organizations that marked 91 to 95 points accounted for 10.7% while those that marked 76 points or above accounted for 51.9%. As far as the Group III is concerned, organizations that marked 61 to 65 points accounted for 8.7% while those that marked 76 points or above accounted for 38.7%; organizations in this group are distributed evenly between 40 and 100 points, representing the different levels of security measures implemented.
When we consider the security measures, not only technical security measures but organizational and human security measures are important. However the result shows that regardless of group, organizations are putting emphasis on technologic countermeasures ("Malware", "ICT Network" etc), and not on organizational security measures such as "Business Continuity" and so on.
3. Comparing Information Security Measures Implemented by each Group
(Organization-Size-Based)
According to Japanese Law of Small and Medium Enterprise Basic Law , the definition of SME is as follows:
- Small-sized organization: Manufacturing: 300 employees or less, Wholesale: 100 employees or less, Retail sales: 50 employees or less
- Medium-sized organization: 20 employees or less for all three industries
In this section, we classified organizations into two groups: those with more than 300 employees and those with 300 employees or less. Table 3 shows ratios pertaining to the number of organizations diagnosed (Ratio A) and number of business establishments that was derived from the statistical data provided by Statistics Bureau of Ministry of Internal Affairs and Communications (Ratio B). Small-seize organizations that accounted for 91% in Ratio B marked 12.29% in Ratio A, which is much lower than 91%. On the other hand, organization with more than 300 employees and those with 20 to 300 employees marked much higher ratio than actual one (in Table 3, 0.20 versus 39.68, 8.80 versus 48.04.)
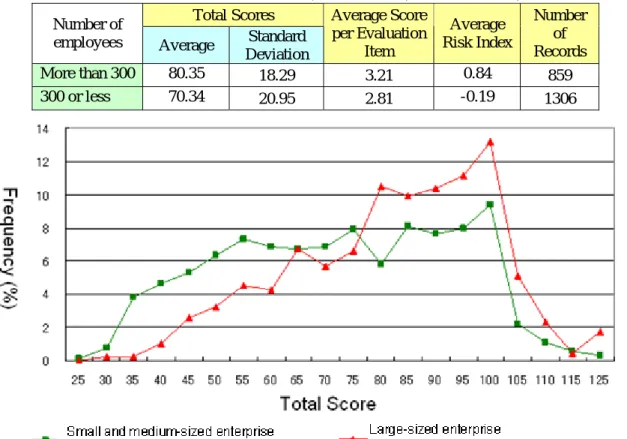
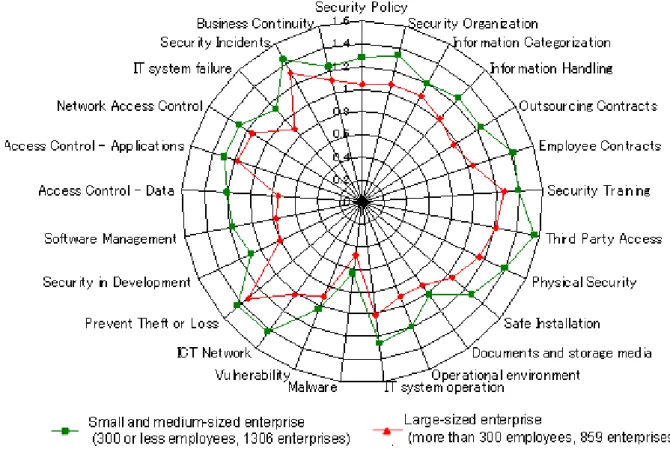
Table 4 shows average total scores for each size of organizations. Figure 3 shows frequency distribution of total scores for each size of organizations. Figure 4 shows scores for 25 items that were marked by each size of organizations and Figure 5 shows variance for each item of security measures. The smaller the variance, the smaller the dispersion in scores. In those tables and figures, large organizations refer to those with more than 300 employees and small- and medium-sized organizations refer to those with 300 employees or less.
In Table 4, average total score of large organizations is approximately 10 points higher than that of small- and medium-sized organizations. As for average score per evaluation item, large organizations marked 0.4 points higher than small- and medium-sized organizations did (3.21 versus 2.81.) Among the large organizations, those marked 96 to 100 points accounted for 13.2% and those that marked 76 points accounted for 64.7%.
Number of Employees Number of Organization Diagnosed Ratio A (for the number of
organization diagnosed)
Ratio B (for the number of
establishments) (based on the statistical data)
More than 300 859 39.68% 0.20%
20 to 300 1040 48.04% 8.80%
20 or less 266 12.29% 91.00%
Table 4 Scores for 25 Items (2165 records, from Mar. 20, 2006 to Dec. 17, 2007) Total Scores
Number of
employees Average Standard Deviation Average Score per Evaluation Item Average Risk Index Number of Records More than 300 80.35 18.29 3.21 0.84 859 300 or less 70.34 20.95 2.81 -0.19 1306
Figure 3 Frequency Distribution of Total Scores (2165 records, from Mar. 20, 2006 to Dec. 17, 2007)
Figure 5 Variance for Scores for 25 Items (2165 records, from Mar. 20, 2006 to Dec. 17, 2007)
The figures and tables show that large organizations are in more advanced stages than small- and medium-sized organizations in terms of information security. Regardless of the size of organization, the items that marked high points were "Malware", "Vulnerability", "Network Access Control" and "Access Control ‒Data." On the other hand, the worst three were "Business Continuity", "Software Management (selection, purchase etc)" and "Security in Development." The items that showed big differences between large organizations and small- and medium-sized organizations were "Security Organization", "Physical Security", "Security Incidents" and "Security Policy." The result shows that organizations in both groups are implementing technologic countermeasures, but the implementation levels of managerial and physical security measures differ greatly between large organizations and small- and medium-sized organizations.
4. Comparing Information Security Measures Implemented by each Business Industry
Industry classification applied by ISM-Benchmark is based on Japan Standard Industry Classification that was provided by the Ministry of Internal Affairs and Communications. Although Japan Standard Industry Classification defines 24 types of industries, some of them may have little records to compare and therefore, we selected the following ten categories:(1) Agriculture, Forestry and Fisheries (2) Building Industry
(3) Manufacturing
(4) Electric Power Supply, Gas Service, Heat Supply, Waterworks, Traffic (5) Information Service
(6) Tel-Communication, Broadcasting, ISP/ASP, Publishing/Newspaper (7) Wholesale/Retail Sales
(8) Financial/Insurance
(9) Real Estate, Restaurant/Travel/Hotel, Medical/Public Welfare, Education, Prep school (10) Other Services (including Government, Public Agency, Public-Interest Corporations)
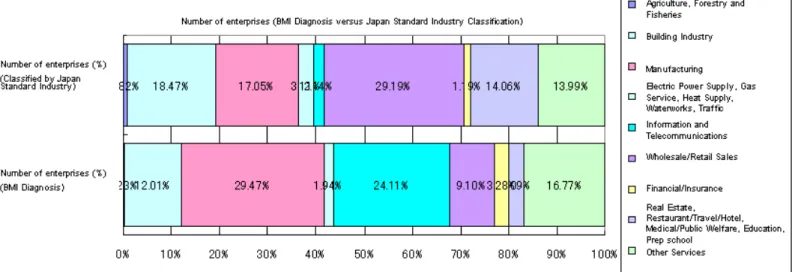
Table 5 shows ratio of number of organizations in each business industry. Figure 6 shows number of organizations and its ratio for each business industry. Among all the industries, "Manufacturing", "Information Service plus Tel-Communication, Broadcasting, ISP/ASP, Publishing/Newspaper, hereafter referred to as
Information and Telecommunications Networks ", " Building Industry",” Wholesale/Retail Sales " and " Financial/Insurance" accounted for 68% in the case of Japan Standard Industry Classification and 78% in the organizations who use ISM-Benchmark.
Table 5 Number of Organization Diagnosed (2165 records, from Mar. 20, 2006 to Dec. 17, 2007)
Item Business Industry
Number of organization (ISM-B Diagnosis) Number of organization (%) (ISM-B Diagnosis) Number of Organization by Japan Standard Industry Classification Number of Organization (%) by Japan Standard Industry Classification 1 Agriculture, Forestry and
Fisheries 5 0.23% 12,361 0.82%
2 Building Industry 260 12.01% 279,964 18.47%
3 Manufacturing 638 29.47% 258,409 17.05%
4
Electric Power Supply, Gas Service, Heat Supply, Waterworks, Traffic 42 1.94% 47,129 3.11% 5 Information Service 470 21.71% 6 Tel-Communication, Broadcasting, ISP/ASP, Publishing/Newspaper 52 2.40% 32,423 2.14% 7 Wholesale/Retail Sales 197 9.10% 442,536 29.19% 8 Financial/Insurance 71 3.28% 17,989 1.19% 9 Real Estate, Restaurant/Travel/Hotel, Medical/Public Welfare, Education, Prep school
67 3.09% 213,108 14.06%
10 Other Services (including
public institutions) 363 16.77% 212,046 13.99%
Total 2165 100% 1,515,965 100%
Note: The number of organizations and its ratio(%) by Japan Standard Industry Classification by Statistics Bureau of Ministry of Internal Affairs and Communications are based on the data that was effective as of 2007. ISM-B in this table indicates ISM-Benchmark. "Information and Telecommunications Networks" means Item 5 plus Item 6.
Figure 6 Numbers of Organizations for each Industry
Figure 7 shows average score for 25 items for 10 industries. Those marked high scores are "Information Service", " Financial/Insurance", "Tel-Communication" and "Electric Power Supply, Gas Service, Heat Supply, Waterworks, Traffic." Those marked low scores are "Agriculture, Forestry and Fisheries", " Real Estate, Restaurant/Travel/Hotel, Medical/Public Welfare, Education, Prep school.
Figure 7 Scores for 25 Items for 10 Industries
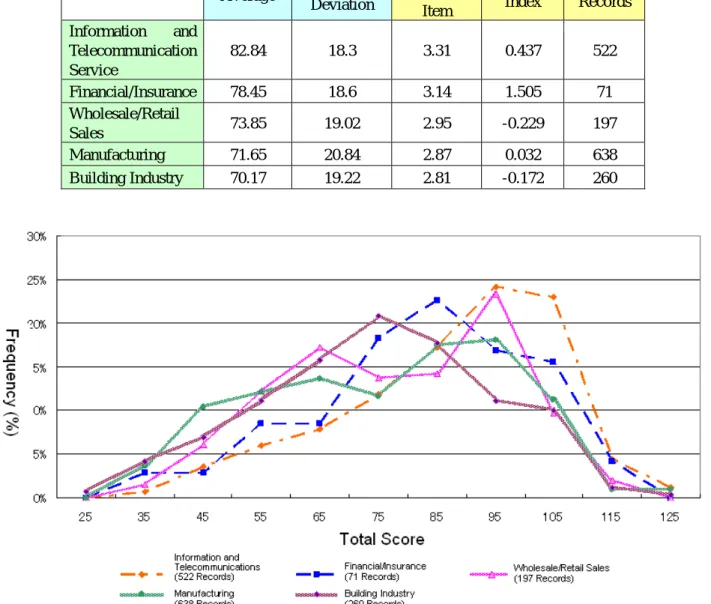
Among all the 2165 basis ISM-Benchmark basic data, "Manufacturing", "Information and Telecommunications Service", "Building Industry", "Wholesale/Retail Sales" and "Financial/Insurance"
accounted for 78%. Because these industries marked higher number of organizations diagnosed, we performed comparison of data pertaining to them. Table 6 shows average total scores and Figure 8 shows frequency distribution of total scores. Among those industries, "Information and Telecommunications Service" marked the highest score, followed by "Financial/Insurance." The item showed little dispersion among those industries was "Malware." The least addressed measures were "Business Continuity" and "Software Management (selection, purchase etc)." The security measures that showed a big difference between the top 2 and 3 industries were "Security Organization", "Outsourcing Contracts", "Physical Security" and "Prevent Theft or Loss."
Table 6 Data for each Industry (5 industries, 1688 records, from Mar. 20, 2006 to Dec. 17, 2007) Total Score Average Standard Deviation Average Score per Evaluation Item Average Risk Index Number of Records Information and Telecommunication Service 82.84 18.3 3.31 0.437 522 Financial/Insurance 78.45 18.6 3.14 1.505 71 Wholesale/Retail Sales 73.85 19.02 2.95 -0.229 197 Manufacturing 71.65 20.84 2.87 0.032 638 Building Industry 70.17 19.22 2.81 -0.172 260
Figure 8 Frequency Distribution of Total Scores for Five Industries (1688 records, from Mar. 20, 2006 to Dec. 17, 2007
5. Comparing Information Security Measures Implemented by each Group (First Classified
by Business Industry and then by the Size of Organization)
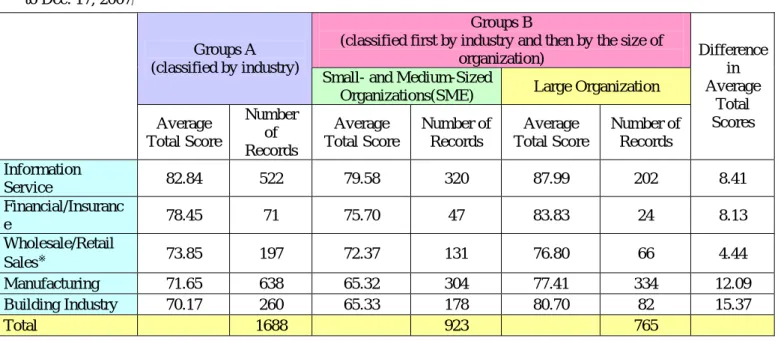
Table 7 shows average total scores for five industry groups ("Manufacturing", "Information and Telecommunications Service", "Building Industry", "Wholesale/Retail Sales" and "Financial/Insurance") and then by the size of organization (with more than 300 employees or with 300 employees or less).
As for average total scores, the ranking of five industries are the same between Groups A and SME in Groups B (see Table 6). However, as for "Wholesale/Retail Sales" and "Building Industry" are concerned, their ranking in Groups A and Large Organization in Groups B were replaced. This is because degree of difference in average total scores of large organization and that of small- and medium-sized organization varies depending on the industry. The industry that showed the biggest difference was "Building Industry (80.70 - 65.33 = 15.37)," followed by "Manufacturing (77.41 - 65.32 = 12.09)." The result shows that, as for these industries, the implementation level of security measures varies largely depending on the size of organization. The industry that showed little difference was "Wholesale/Retail Sales" (76.80 - 72.37 = approximately 4.4.)
Table 7 Data for groups classified by industry and the size of organization (1688 records, from Mar. 20, 2006 to Dec. 17, 2007)
Groups B
(classified first by industry and then by the size of organization)
Groups A (classified by industry)
Small- and Medium-Sized
Organizations(SME) Large Organization Average Total Score Number of Records Average Total Score Number of Records Average Total Score Number of Records Difference in Average Total Scores Information Service 82.84 522 79.58 320 87.99 202 8.41 Financial/Insuranc e 78.45 71 75.70 47 83.83 24 8.13 Wholesale/Retail Sales※ 73.85 197 72.37 131 76.80 66 4.44 Manufacturing 71.65 638 65.32 304 77.41 334 12.09 Building Industry 70.17 260 65.33 178 80.70 82 15.37 Total 1688 923 765
6. Conclusion
In this document, we performed comparison of diagnosis data from various angles. Regardless of methods applied for comparison, the security measure that showed the highest score was "Malware" and the least addressed measures were "Business Continuity", "Software Management (selection, purchase etc)" and "Security in Development." Security measures that showed big difference were "Security Organization", "Physical Security", "Third Party Access", "Security Policy", "Employee Contract" and "Outsourcing Contract".
Relevant Materials
1) Information Security Measures
http://www.ipa.go.jp/security/benchmark/
2) Information Security Governance (Ministry of Economy, Trade and Industry) http://www.meti.go.jp/policy/netsecurity/sec_gov-TopPage.html
3) Ministry of Internal Affairs and Communications, Bureau of Statistics 2006 Business Institution/Statistical Research
http://www.stat.go.jp/data/jigyou/2006/
4) Japan Standard Industry Classification(Revised in March 2002) http://www.stat.go.jp/index/seido/sangyo/