University of Mississippi
eGrove
Honors Theses Honors College (Sally McDonnell Barksdale
Honors College)
5-13-2019
Case Analyses of Accounting Concepts and
Methodologies by William Freeman
William Freeman
University of Mississippi
Follow this and additional works at:https://egrove.olemiss.edu/hon_thesis
Part of theAccounting Commons
Recommended Citation
Freeman, William, "Case Analyses of Accounting Concepts and Methodologies by William Freeman" (2019).Honors Theses. 1189.
Case Analyses of Accounting Concepts and Methodologies By William Alexander Freeman
A thesis submitted to the faculty of the University of Mississippi in partial fulfillment of the requirements of the Sally McDonnell Barksdale Honors College.
Oxford May 2019
Approved By
Advisor: Dr. Victoria Dickinson
Reader: Dr. Mark Wilder
ABSTRACT
WILLIAM FREEMAN: Case Analyses of Accounting Concepts and Methodologies (Under the direction of Victoria Dickinson)
The purpose of this honors thesis is to study different areas of accounting and create a deeper understanding of accounting in the real world. The University of Mississippi provides Sally McDonnell Barksdale Honors College Graduate the opportunity to craft a final thesis based on twelve different case studies. These case studies go on to cover real
life topics from specific companies accounts receivable to stockholder’s equity and other
areas in between. Along with these case studies, Honors Accountancy students compete in two case competitions where they are challenged with creating a plan to address different accounting issues. The plans are then presented to a team of accounting professionals representing multiple major accounting firms. The thesis program allows individual accounting students the opportunity to get a glimpse into accounting outside of academia and prepares students to engage in professional presentations and research.
TABLE OF CONTENTS
Introduction ...5
Case Study One ...7
Case Study Two ...23
Case Study Three ...30
Case Study Four ...38
Case Study Five ...43
Case Study Six ...48
Case Study Seven ...54
Case Study Eight ...61
Case Study Nine ...68
Case Study Ten ...74
Case Study Eleven ...80
INTRODUCTION
Summary of Findings: Throughout the thesis class, students focused and improved their knowledge in the areas of financial reporting, technical skills, theoretical concepts, and research. Each of these topics provided an opportunity to become more familiar with a topic beyond a typical academic setting. From the emphasis on work in Excel from the first case study, the class experienced beneficial learning that carried over into the internship the following year. The skills gained from that single case study impacted many students and provided them with advantages compared to many other undergraduates in the areas of Excel proficiency, but also in overall understanding of financial statements. The thesis class provided an opportunity to gain knowledge through a hand on and individual centered class structure.
Beyond, just the first case, each subsequent case allowed for familiarity with accounting subjects that had yet to be covered in other classes. Many of the topics the class saw were the first introductions to a focus. With help from Dr. Dickinson, the class began to understand the individual topics, and after a brief lesson, were encouraged to go solve the problems posed in the studies. After taking a week to understand the concepts and craft correct answers, the class members had a better grasp of the topics. The improved knowledge was solidified as students took these lessons into the Intermediate Accounting classrooms where they were already familiar with many of the concepts. Proof of the benefit of these classes could be seen through the performance of many of the students on the Intermediate exams. By participating in the thesis work, the class was more prepared for academic endeavors, and was more prepared for real world accounting problems. The
thesis provided the opportunity to see real-world scenarios and understand the purpose and necessity of accounting from a business, rather than academic lens.
Furthering the point on career preparedness, obtaining an internship at a prestigious accounting firm requires effort, intelligence, and networking skills. Working on the thesis and participating in the thesis class provided students avenues to improve on all these skills. The effort required to produce work for twelve different case studies, as well as two case study competitions gave students a taste of the demands of an accounting career. Then, having to complete case studies based on foreign concepts required the class to gather a greater intelligence with regards to the accounting industry. However, perhaps the most important portion of the thesis class was the improvement to networking skills. While the thesis cases were done mostly individually, there were opportunities to participate in case competitions. These case competitions required students to work in randomly assigned groups to create and present a solution to a problem. Having to work with others and accept
both the benefits and the challenges improved the classes’ professional and interpersonal
skills. Also, the class heard from and communicated with various professionals from different firms throughout the case study process. These interactions allowed students to expand their networks and feel out their preferred career choice. Overall, the thesis and the class provided an exceptional opportunity for students to improve their accounting knowledge, work ethic, and networking skills.
CASE STUDY ONE Home Heaters: Glenwood vs. Eads
Introduction: “Home Heaters” centered around two different companies who both sold
home heating units. The two companies are Eads Heater, Inc. located in Eads, CO, and Glenwood Heating, Inc. located in Glenwood Springs, CO. As the background to the case explains, both companies operate under similar economic conditions and have the exact same operations during the year. However, what makes them different is that each manager has a unique take on certain accounting choices when applying GAAP in the companies’ financial statements. The case encourages students to practically apply these different ways of using GAAP and notice how they affect the different financial statements. The other important aspect of the case was that it required students to get more familiar with Microsoft Excel and how to integrate charts and tables seamlessly into a word document. By working in Excel and Word to produce financial statements, there is an opportunity to improve upon basic accounting technology skills that will be vital in the future. The case study also highlights the differences between small decisions in GAAP and shows how those decisions can affect end of year financial statements. The differences can be seen in the following income statement, statement of retained earnings, and balance sheet. Then through the analysis of various ratios, there is evidence that Glenwood’s decision making is the more effective of the two companies.
Part A:
Table 1-1 Glenwood Updated Trial Balance
Debits Credits Cash $ 426.00 $ -Accounts Receivable 99,400
Allowance for Bad Debts 994.00
Inventory 62,800 Land 70,000 Building 350,000 Accumulated Depreciation-building 10,000 Equipment 80,000 Accumulated Depreciation-equipment 9,000 Accounts Payable 26,440 Interest Payable 6,650 Note Payable 380,000 Common Stock 160,000 Dividend 23,200 Sales 398,500
Cost of Goods Sold 177,000 Other Operating expenses 34,200 Bad debt expense 994 Depreciation Expense-building 10,000 Depreciation Expense-equipment 9,000
Rent Expense 16,000
Interest Expense 27,650 Provision for income tax 30,914
Total $991,584.00 $991,584.00
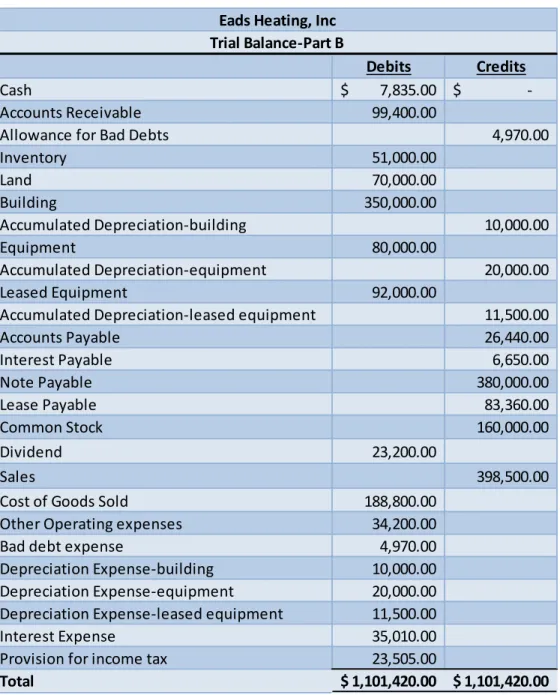
Glenwood Heating, Inc Trial Balance-Part B
Table 1-2 Eads Updated Trial Balance
Debits Credits Cash $ 7,835.00 $ -Accounts Receivable 99,400.00
Allowance for Bad Debts 4,970.00
Inventory 51,000.00 Land 70,000.00 Building 350,000.00 Accumulated Depreciation-building 10,000.00 Equipment 80,000.00 Accumulated Depreciation-equipment 20,000.00 Leased Equipment 92,000.00
Accumulated Depreciation-leased equipment 11,500.00
Accounts Payable 26,440.00 Interest Payable 6,650.00 Note Payable 380,000.00 Lease Payable 83,360.00 Common Stock 160,000.00 Dividend 23,200.00 Sales 398,500.00
Cost of Goods Sold 188,800.00 Other Operating expenses 34,200.00 Bad debt expense 4,970.00 Depreciation Expense-building 10,000.00 Depreciation Expense-equipment 20,000.00 Depreciation Expense-leased equipment 11,500.00 Interest Expense 35,010.00 Provision for income tax 23,505.00
Total $ 1,101,420.00 $ 1,101,420.00
Eads Heating, Inc Trial Balance-Part B
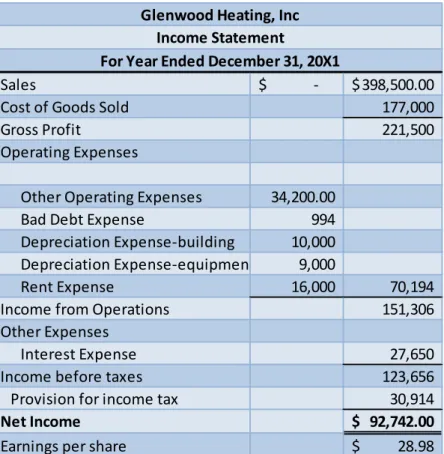
Table 1-3 Glenwood Income Statement
Sales $ - $ 398,500.00 Cost of Goods Sold 177,000
Gross Profit 221,500
Operating Expenses
Other Operating Expenses 34,200.00 Bad Debt Expense 994 Depreciation Expense-building 10,000 Depreciation Expense-equipment 9,000
Rent Expense 16,000 70,194 Income from Operations 151,306 Other Expenses
Interest Expense 27,650 Income before taxes 123,656 Provision for income tax 30,914
Net Income $ 92,742.00
Earnings per share $ 28.98 Glenwood Heating, Inc
Income Statement
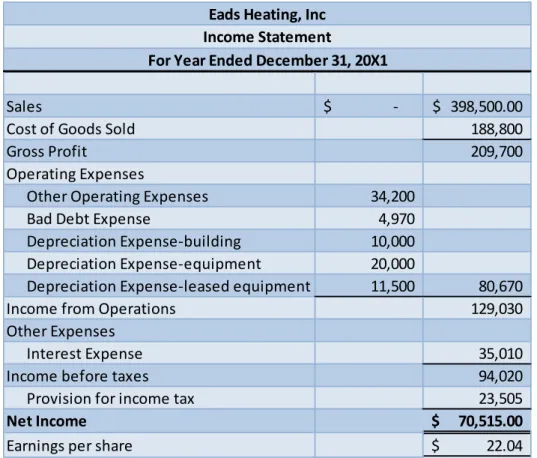
Table 1-4 Eads Income Statement
Table 1-5 Glenwood Statement of Retained Earnings
Sales $ - $ 398,500.00
Cost of Goods Sold 188,800
Gross Profit 209,700
Operating Expenses
Other Operating Expenses 34,200 Bad Debt Expense 4,970 Depreciation Expense-building 10,000 Depreciation Expense-equipment 20,000
Depreciation Expense-leased equipment 11,500 80,670 Income from Operations 129,030 Other Expenses
Interest Expense 35,010
Income before taxes 94,020
Provision for income tax 23,505
Net Income $ 70,515.00
Earnings per share $ 22.04
Eads Heating, Inc Income Statement
For Year Ended December 31, 20X1
Retained Earnings as of Jan 1, 20X1 $ -Add: Net income for 20X1 92,742.00
92,742.00
Less: Dividends (23,200.00)
Retained Earnings for Dec 31, 20X1 $ 69,542.00 Statement of Retained Earnings
For Year Ended December 31, 20X1 Glenwood Heating, Inc
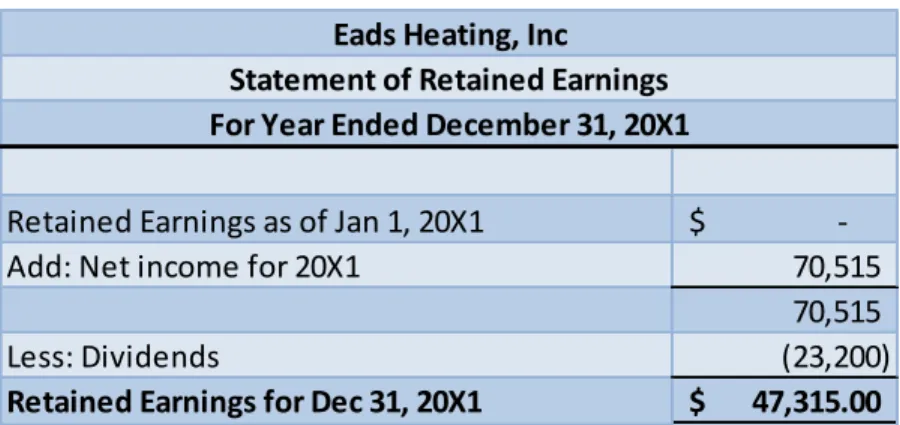
Table 1-6 Eads Statement of Retained Earnings
Retained Earnings as of Jan 1, 20X1 $ -Add: Net income for 20X1 70,515
70,515 Less: Dividends (23,200) Retained Earnings for Dec 31, 20X1 $ 47,315.00
For Year Ended December 31, 20X1 Eads Heating, Inc
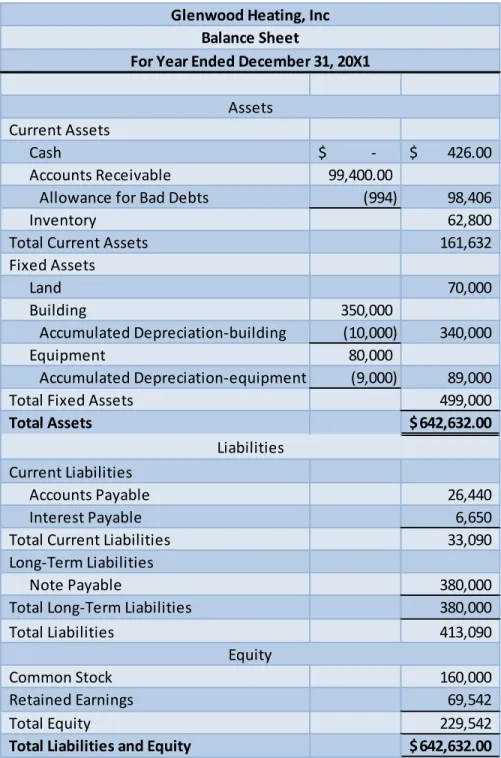
Table 1-7 Glenwood Balance Sheet
Current Assets
Cash $ - $ 426.00 Accounts Receivable 99,400.00
Allowance for Bad Debts (994) 98,406
Inventory 62,800
Total Current Assets 161,632
Fixed Assets Land 70,000 Building 350,000 Accumulated Depreciation-building (10,000) 340,000 Equipment 80,000 Accumulated Depreciation-equipment (9,000) 89,000
Total Fixed Assets 499,000
Total Assets $ 642,632.00
Current Liabilities
Accounts Payable 26,440
Interest Payable 6,650
Total Current Liabilities 33,090 Long-Term Liabilities
Note Payable 380,000
Total Long-Term Liabilities 380,000
Total Liabilities 413,090
Common Stock 160,000
Retained Earnings 69,542
Total Equity 229,542
Total Liabilities and Equity $ 642,632.00 Glenwood Heating, Inc
For Year Ended December 31, 20X1 Balance Sheet
Assets
Liabilities
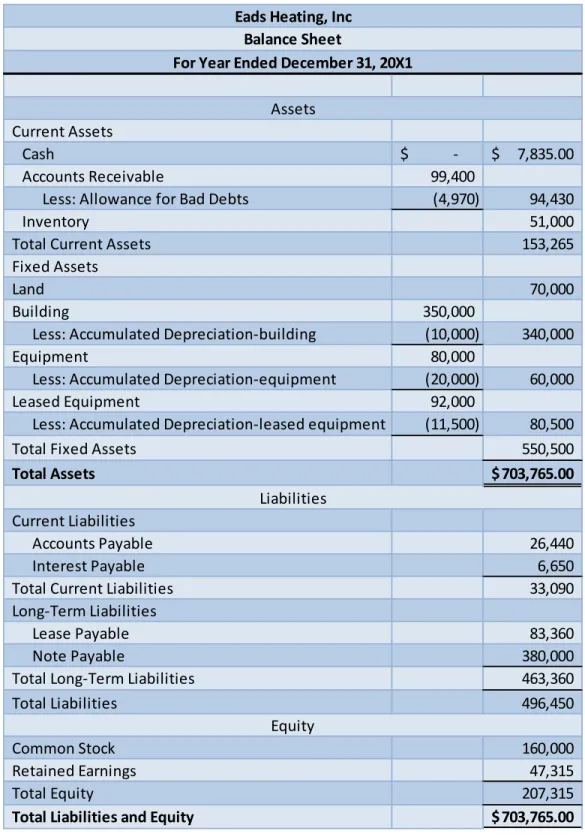
Table 1-8 Eads Balance Sheet
Current Assets
Cash $ - $ 7,835.00
Accounts Receivable 99,400
Less: Allowance for Bad Debts (4,970) 94,430
Inventory 51,000
Total Current Assets 153,265
Fixed Assets
Land 70,000
Building 350,000
Less: Accumulated Depreciation-building (10,000) 340,000
Equipment 80,000
Less: Accumulated Depreciation-equipment (20,000) 60,000
Leased Equipment 92,000
Less: Accumulated Depreciation-leased equipment (11,500) 80,500
Total Fixed Assets 550,500
Total Assets $ 703,765.00
Current Liabilities
Accounts Payable 26,440
Interest Payable 6,650
Total Current Liabilities 33,090
Long-Term Liabilities
Lease Payable 83,360
Note Payable 380,000
Total Long-Term Liabilities 463,360
Total Liabilities 496,450
Common Stock 160,000
Retained Earnings 47,315
Total Equity 207,315
Total Liabilities and Equity $ 703,765.00
Assets
Liabilities
Equity Eads Heating, Inc
Balance Sheet
Table 1-9 Important Investment Ratios
Additional Information
Part A: Table 1-10 Basic Transactions
Glenwood Eads Earnings Per Share 29.98 22.04
Return on Equity 0.4 0.34
Return on Assets 0.14 0.1
Current Ratio 4.88 4.63
Acid-Test Ratio 3.02 3.24
Debt Ratio 0.64 0.71
Debt to Equity Ratio 1.8 2.39 Asset tunrover ratio 0.62 0.57
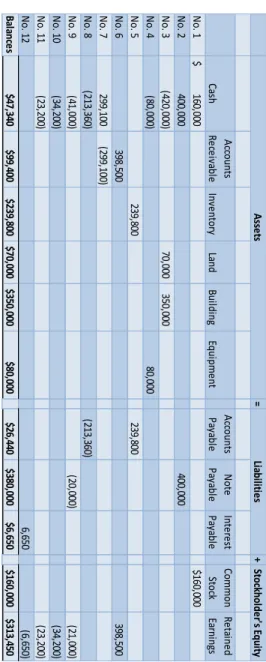
Table 1-11 Basic Trial Balance = + Ca sh A cc ou nts Re ce iv ab le In ve ntor y La nd Bu ild in g Eq uip me nt A cc ou nts Pa ya ble N ote Pa ya ble In te re st Pa ya ble Co mmo n Stoc k Re ta in ed Ea rn in gs N o. 1 16 0,0 00 $ 16 0,0 00 $ N o. 2 40 0,0 00 40 0,0 00 N o. 3 (4 20 ,0 00 ) 70 ,0 00 35 0,0 00 N o. 4 (8 0,0 00 ) 80 ,0 00 N o. 5 23 9,8 00 23 9,8 00 N o. 6 39 8,5 00 39 8,5 00 N o. 7 29 9,1 00 (2 99 ,1 00 ) N o. 8 (2 13 ,3 60 ) (2 13 ,3 60 ) N o. 9 (4 1,0 00 ) (2 0,0 00 ) (2 1,0 00 ) N o. 10 (3 4,2 00 ) (3 4,2 00 ) N o. 11 (2 3,2 00 ) (2 3,2 00 ) N o. 12 6,6 50 (6 ,6 50 ) Ba la nc es $4 7,3 40 $9 9,4 00 $2 39 ,8 00 $7 0,0 00 $3 50 ,0 00 $8 0,0 00 $2 6,4 40 $3 80 ,0 00 $6 ,6 50 $1 60 ,0 00 $3 13 ,4 50 A sse ts Lia bil iti es St oc kh old er 's Eq uit y
Debits Credits Cash $ 47,340.00 Accounts Receivable 99400 Inventory 239800 Land 70000 Building 350000 Equipment 80000 Accounts Payable 26440 Note Payable 380000 Interest Payable 6650 Common Stock 160000 Dividend 23200 Sales 398500
Other Operating Expenses 34200
Interest Expense 27650
Part B: Recording Additional Information Table 1-12 Glenwood Additional Information
Tr an sa ct io n Ca sh A cc o u n ts R e ce iv ab le A llo w an ce fo r B ad D e b ts In ve n to ry La n d B u ild in g A cc u mu la te d D e p re cia tio n B u ild in g Eq u ip me n t A cc u mu la te d D e p re cia tio n Eq u ip me n t B ala n ce s: P ar t A 47 ,3 40 $ 99 ,4 00 $ -$ 23 9,8 00 $ 70 ,0 00 $ 35 0,0 00 $ 80 ,0 00 $ P ar t B 1 ) B ad D e b ts 994 $ P ar t B 2 ) COG S (1 77 ,0 00 ) $ P ar t B 3 ) D e p re cia tio n B u ild in g 10 ,0 00 $ Eq u ip me n t 9,0 00 $ P ar t B 4 ) E q u ip me n t R e n ta l P ay me n t (1 6,0 00 ) $ P ar t B 5 ) I n co me T ax (3 0,9 14 ) $ B ala n ce s 426 $ 99 ,4 00 $ 994 $ 62 ,8 00 $ 70 ,0 00 $ 35 0,0 00 $ 10 ,0 00 $ 80 ,0 00 $ 9,0 00 $ A ss e ts A cc o u n ts P ay ab le In te re st P ay ab le N o te P ay ab le Co mmo n St o ck R e ta in e d Ea rn in gs 26 ,4 40 $ 6,6 50 $ 38 0,0 00 $ 16 0,0 00 $ 31 3,4 50 $ (9 94 ) $ (1 77 ,0 00 ) $ (1 0,0 00 ) $ (9 ,0 00 ) $ (1 6,0 00 ) $ (3 0,9 14 ) $ 26 ,4 40 $ 6,6 50 $ 38 0,0 00 $ 16 0,0 00 $ 69 ,5 42 $ Lia b ili tie s Eq u ity
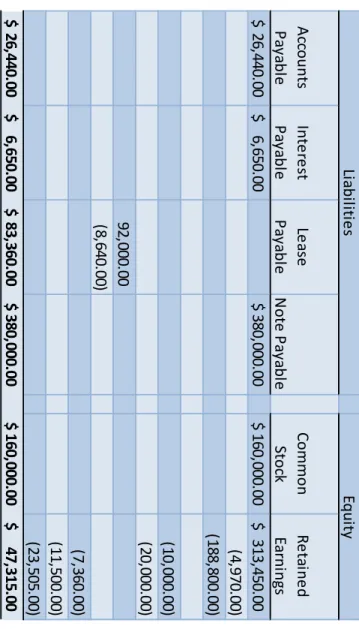
Table 1-13 Eads Additional Information A cc o u n ts P ay ab le In te re st P ay ab le Le as e P ay ab le N o te P ay ab le Co mmo n Stoc k R e ta in e d Ea rn in gs 26 ,4 40 .0 0 $ 6,6 50 .0 0 $ 38 0,0 00 .0 0 $ 16 0,0 00 .0 0 $ 31 3,4 50 .0 0 $ (4 ,9 70 .0 0) (1 88 ,8 00 .0 0) (1 0,0 00 .0 0) (2 0,0 00 .0 0) 92 ,0 00 .0 0 (8 ,6 40 .0 0) (7 ,3 60 .0 0) (1 1,5 00 .0 0) (2 3,5 05 .0 0) 26 ,4 40 .0 0 $ 6,6 50 .0 0 $ 83 ,3 60 .0 0 $ 38 0,0 00 .0 0 $ 16 0,0 00 .0 0 $ 47 ,3 15 .0 0 $ Lia b ili ti e s Eq u ity Tr an sa cti o n Ca sh A cc o u n ts R e ce iv ab le A llo w an ce fo r B ad D e b ts In ve n tor y La n d B u ild in g A cc u mu la te d D e p re cia ti o n B u ild in g Eq u ip me n t A cc u mu la te d D e p re cia ti o n Eq u ip me n t Le as e d Eq u ip me n t A cc u mu la te d D e p re cia ti o n Le as e B ala n ce s: P ar t A 47 ,3 40 .0 0 $ 99 ,4 00 .0 0 $ -$ 23 9,8 00 .0 0 $ 70 ,0 00 .0 0 $ 35 0,0 00 .0 0 $ 80 ,0 00 .0 0 $ P ar t B 1 ) B ad D e b ts 4,9 70 .0 0 P ar t B 2 ) COG S (1 88 ,8 00 .0 0) P ar t B 3 ) D e p re cia ti o n B u ild in g 10 ,0 00 .0 0 Eq u ip me n t 20 ,0 00 .0 0 P ar t B 4 ) E q u ip me n t Le as e 92 ,0 00 .0 0 Le as e P ay me n t (1 6,0 00 .0 0) D e p re cia ti o n 11 ,5 00 .0 0 P ar t B 5 ) I n co me T ax (2 3,5 05 .0 0) B ala n ce s 7,8 35 .0 0 $ 99 ,4 00 .0 0 $ 4,9 70 .0 0 $ 51 ,0 00 .0 0 $ 70 ,0 00 .0 0 $ 35 0,0 00 .0 0 $ 10 ,0 00 .0 0 $ 80 ,0 00 .0 0 $ 20 ,0 00 .0 0 $ 92 ,0 00 .0 0 $ 11 ,5 00 .0 0 $ A ss e ts
Conclusion: After completing the various financial statements for both companies, it is important to compare them through various ratio tests. These ratio tests help to show which company an individual is more likely to invest in or lend money too. In the
investing scenario, Glenwood’s earnings per share comes in higher than Eads’ by close to $8, so Glenwood has the advantage. The return on equity is also slightly higher for Glenwood, so they have a stronger equity position which is also a positive for an investment. Glenwood’s return on assets is also higher which shows Glenwood’s management is more effective at getting the most out of their assets when compared to Eads. The last ratio important to investing was the asset turnover ratio which showed that Glenwood manages to generate more revenue per dollar of asset. As an investor,
Glenwood is the better choice because they appear to be the more efficient company, as well as offer greater returns to investors than does Eads.
However, as a lender, there are different ratios that are important to recognize before an individual give’s money to one of the companies. Looking at the current ratio, it shows that Glenwood is more capable of covering its short-term and long-term liabilities.
However, Eads has a better acid-test ratio showing that it is fit for covering the immediate liabilities with its liquid assets. The debt ratio also shows that Eads is slightly more leveraged, and therefore has opened themselves to a greater financial risk. Lastly, the debt to equity ratio echoes the debt ratio showing that Eads has higher leverage. After looking at both companies, through investing and lending lenses, Glenwood appears to be a better investment due to its returns to investors. And even though Eads has the better ability to pay off its immediate liabilities, it has also financed more actions
with its debt putting itself in a riskier position. Unless an individual needed an immediate repayment of a loan, then Glenwood would be a safer company to lend to as well.
CASE STUDY TWO Molson Coors Brewing Company Profitability and Earnings Persistence
Introduction: Molson Coors Brewing Company—Profitability and Earnings Persistence Case Study focused on better understanding the income statement. From understanding why an income statement is classified, to recognizing the various aspects of the income statement, and to calculating performance ratios, the case study attempted to teach what makes up an income statement, and why it is arranged the way it is. The focus on the classifications helped to improve an individual’s understanding about why certain aspects of the income statement are separated to better represent the events and actions that occur within the company. The study also helps to teach about the importance of income statement items and their effect on performance. Learning about these specific distinctions helps to better understand how the business is running, and gives a clearer picture about the economic position that the company is in.
A. What are the major classifications on an income statement?
There are three main classifications on an income statement. They are the gross margin section, the operating expense section, and the non-operating expense section.
The gross margin section includes the taking away cost of goods sold from revenues, and the information helps to find out the profits strictly from the sales of goods and services. The operating expense section includes all the expenses that are crucial to the day to day running of the company and can stand alone in the business. It includes a company’s profits or losses. An investor could use this information to see how effectively a company can generate a profit from its main activities.
The last classification is the non-operating expense section which shows expenses not related to operations. It includes peripheral operational activities as taxes. The
classification helps to understand all aspects of the net income of a whole entity.
B. Explain why, under U.S. GAAP, companies are required to provide “classified” income statements.
U.S. GAAP requires companies to provide a “classified” balance sheet because it helps to make the income statement more transparent. With the “classified” or multi-step income statement, a company is required to list each of the expenses and revenue streams that are left out during a single step income statement. Giving more information allows investors to have a better understanding about where the company stands and gives a better insight into how the company runs. It also helps to prevent fraud, because with more detail, there is less of an opportunity to change the numbers.
C. In general, why might financial statement users be interested in a measure of persistent income?
Because persistent income is income that is common from one period to the next, investors can use it to recognize how stable a company’s profits are. A company that continues to show persistent and consistent income would most likely be a sound and safe investment, which would be attractive for an investor.
D. Define comprehensive income and discuss how it differs from net income.
Comprehensive income is a more inclusive measure of income that includes all income and expenses recognized during a time, not just those from daily operations. These other
incomes and expenses could stem from other gains and losses, sale of securities, and other non-normal business operations. It gives a more encompassing view of transactions across the entire business, not just the main activities shown by net income.
E. The income statement reports “Sales” and “Net sales.” What is the difference? Why does Molson Coors report these two items separately?
Sales or gross sales are the total of all the transactions in each period. In Coors case, the difference is an excise tax. Coors includes the excise tax to show the cost of taxes that is included in the price of the product. It could serve as a justification for why the price is what is, and as evidence that the price is not as high as it purely to increase the profit. For other businesses, net sales are all the transactions less sales returns and allowances and sales discounts. Both sales and net sales would be of interest to an investor, because if net sales are considerably lower than it could point to quality issues with the company’s product. A company then would be inclined to show both to ensure investors that its product quality is high, and customers are satisfied with their purchases.
F. Consider the income statement item “Special items, net” and information in Notes 1 and 8.
i. In general, what types of items does Molson Coors include in this line item?
It includes unusual or infrequent items, impairment or asset abandonment related losses, restructuring charges and other atypical employee-related costs, and fees on termination of significant operating agreements and gains/losses on disposal of investments.
special items as operating expenses. Do you concur with this classification? Explain.
The company chooses to include them on a separate line because they see them as unique events that are not important to their core activities. Separating the special items from other expenses helps investors to more accurately compare the company’s normal
revenues and expenses without being skewed by certain onetime events. I concur with the classification because most of the special items are related to specific assets that are important to the core operations of the company. While the may not be common occurrences, they are a result of day to day activities.
G. Consider the income statement item “Other income (expense), net” and the information in Note 6. What is the distinction between “Other income (expense), net” which is classified a nonoperating expense, and “Special items, net” which Molson Coors classifies as operating expenses?
The difference between the “Other income(expense), net” and “Special items, net” is that while many of the special items are tied directly to operations, the other income is more related to peripheral activities. Whether it is financing activities, foreign currency
exchanges, or gains and losses on non-operating assets, none of them are directly related to the main function of the company.
H. Refer to the statement of comprehensive income.
i. What is the amount of comprehensive income in 2013? How does this amount
Comprehensive income in 2013 is $760.2 million, which is $192.9 million greater than the net income of $567.3 million.
ii. What accounts for the difference between net income and comprehensive
income in 2013? In your own words, how are the items included in Molson Coors’ comprehensive income related?
The difference between net and comprehensive income stems from foreign currency translations, unrealized gains and losses on derivative instruments, pensions, ownership shares of unconsolidated subsidies, amortization of net prior service benefit and net actuarial gain to income, and reclassifications of derivatives. These items are
comprehensive income related because they still contribute to the firm’s profits or losses, even though they are not linked to direct operations. However, there are items that still make a difference in the profitability of the company, and therefore, are included in comprehensive income.
I. Consider the information on income taxes, in Note 7.
i. What is Molson Coors’ effective tax rate in 2013?
Effective Tax Rate = Income Tax expense/ Pre-tax income = 84.0 million/654.5 million
Conclusion:
After completing the Molson Coors Brewing Company—Profitability and Earnings Persistence Case Study, the income statement begins to make much more sense.
Understanding how an income statement is set up between the gross margin, operating, and non-operating is useful because it helps to paint a clearer picture of the happenings inside a company. And not only does that benefit investors, but through the classified income statement, it protects the company from fraudulent accounting practices by making the income statement so detailed. Learning about the different types of income such as net income, comprehensive income, and even persistent income, helped to distinguish the benefits of highlighting each, and how companies can use them to gather investors and sometimes even try and make the company more attractive than the typical net income bottom line would show. The case study also explained how a company can improve its consistency and stability by having a special items and other income/expense section, which would make the company more attractive to investors. All in all, the case study made clear how companies can use their income statements to make their business more attractive, but also ensure they faithfully represent the financial information of the company.
CASE STUDY THREE Pearson plc Accounts Receivable
Introduction: The Pearson case study focused on receivables and what they consist of. Looking at the balance sheet, income statement, and footnotes showed the different types of receivables as well the contra-accounts that decrease the receivables, such as Allowance (Provision) for Doubtful Accounts and Allowance (Provision) for Sales Returns and Allowances. The last part of the case study highlighted how to estimate certain bad debts for the upcoming year and using the estimates as well as the utilized values to construct t-charts. After completing the case, I gained a deeper understanding of how receivables worked, as well as how they are broken down. From the main accounts (trade) receivable to decreases in receivables from taking on a new business, I better understood the makeup of receivables. I also improved my knowledge of the entries and t-accounts that are used to display the changes in receivables and bad debts throughout the years. Lastly, I learned how to incorporate each of the estimated, as well as utilized, allowance for doubtful accounts and sales returns and allowances into a t-account for receivables to find gross receivables.
A. An account receivable is a claim held against a customer and another for money, goods, or services. An account receivable can also be known as trade receivables and loans and receivables.
B. Notes receivables are written promises to pay a certain sum of money on a specified future date. They may arise from sales, financing, or other transactions. They may also be short or long term. These differ from accounts receivable because they can be short term or long term and while accounts receivable is for goods and services, notes receivable is meant to pay a certain sum.
C. A contra-account on a balance sheet reduces either an asset, liability or owners’ equity. The two contra-accounts mentioned with Pearson’s trade receivables are the net of provisions for bad and doubtful debts and anticipated future sales. When managers are trying to decide how to estimate the balance in each contra-account, they can look at the previous year’s estimate and how accurate it was and then adjust from there. They can also do an aging analysis, or measure the
estimated allowance based on a percent of sales.
D. The percentage of sales approach to estimating uncollectible accounts receivable looks at sales as opposed to accounts receivable uses a percentage to decide how much will be uncollectible. The aging analysis method separates accounts into categories based on their age. From here each category that is farther away from its intended payment period becomes less and less likely to be received. The better method is to use the aging analysis, because even though the percent of sales method may offer a better way of matching expenses, aging analysis tends to
E. Despite a chance on note receiving payment, a company will still extend credit because if it operated under the belief that an account would be uncollectible that the total amount of sales would most likely decrease as those customers were unable to purchase product. A manager must recognize that while there is a risk in offering goods on credit, that it is a necessary and normal risk in today’s economy that runs on credit transactions.
F. i.
Provision for Doubtful Accounts
5,000,000 20,000,000 72,000,000 26,000,000 3,000,000 76,000,000
The first line represents the beginning balance of the provision for doubtful accounts.
The second line represents the estimate for the current years allowance for doubtful accounts.
The third line represents the exchange differences that resulted from the current year.
The fourth line represents the actual write-offs for the provision for doubtful accounts.
The fifth line represents the incurred provisions from the acquisition through business combination.
The sixth line represents the ending balance of the provision for doubtful accounts at the end of the year.
ii. 1) 12/31/08 Bad Debts Expense 26,000,000
Allowance for Doubtful Accounts 26,000,000
Bad Debts Expense is an Income Statement account, and Allowance for Doubtful Accounts is a Balance Sheet account.
2) Allowance for Doubtful Accounts 20,000,000
Accounts Receivable 20,000,000
Allowance for Doubtful Accounts is a Balance Sheet account, and Accounts Receivable is a Balance Sheet account.
G. i.
Provision for Sales Returns
443,000,000
372,000,000 425,000,000
354,000,000
ii. 1) 12/31/08 Sales Returns 425,000,000
Provision for Sales Returns 425,000,000
Sales Returns is an Income Statement account, and Provision for Sales Returns is a Balance Sheet account.
2) Sales Returns 443,000,000
Accounts Receivable 443,000,000
Sales Returns is an Income Statement account and Accounts Receivable is a Balance Sheet account.
ii. Estimated sales returns would show up in the revenues section of the income statement. It would be a part of sales that would be taken away to reach net sales.
H. Trade Receivables 1,342,00,000 5,624,000,000 5,219,000,000 20,000,000 443,000,000 1,284,000,000 Accounts Receivable 5,624,000,000 Sales 5,624,000,000 Cash 5,219,000,000 Accounts Receivable 5,219,000,000
Allowance for Doubtful Accounts 20,000,000
Accounts Receivable 20,000,000
Conclusion: Throughout the case, each step helped to further the understanding about what receivables are and what they consist of. The case helps to understand the definition of a receivable, which is claim held against a customer and another for money, goods, or services. Then it leads the student deeper and teaches him to recognize the
contra-accounts that deplete the receivable contra-accounts. Between allowance for doubtful contra-accounts, and allowance for sales returns and allowances, net receivables can be significantly decreased. Also, in learning about these allowances, the case highlights how to estimate these contra-asset accounts, and how to incorporate them into journal entries and t-accounts. Finally, after gathering information on how the contra-accounts are used, the case incorporates the numbers into an overall t-account for gross receivables. After finishing the case, it is much easier to look at an income statement or balance sheet and recognize what the accounts for receivables mean. By understanding how the allowance for doubtful accounts work, an investor would be able to see how risky some of the business ventures the company undertakes are. And, through looking at allowance for sales returns and allowances, an investor would also be able to see the quality of the goods being produces, because a high allowance would indicate many returns and low quality of goods. The Pearson case emphasizes the important aspects of receivables on an income statement, balance sheet, and finally in the footnotes, that would be important to a potential investor in seeing the health of a company.
CASE STUDY FOUR XXXXXXXX
Problem 6-8
Vendor A:
To find the cost that Vendor A will prove the service for, you must first find the present value of the ordinary annuity of $18,000. You know that you are trying to find the present value of the press, because the it will help you decide the present value of the press, and that is important for finding the cheapest purchase. You also know you are finding the ordinary annuity, because the first payment comes at the end of the year, and that makes the annuity and ordinary annuity. You find the cost in the following way:
Value=Payment X PVOA (10,10%)
Value=18,000 X 6.14457 (found by looking up 10 periods at 10% in the present value ordinary annuity table)
Value=110,602
Therefore, the present value of the ordinary annuity is $110,602. Then you must add back the additional down payment of $50,000 and the maintenance cost of $10,000.
Total Cost from Vendor A=110,602+50,000+10,000 Total Cost from Vendor A= $175,602
Vendor B:
To find the cost of vendor B, you will need to find the present value annuity due. Once again, you are trying to find the present value because you want to know what the cost of purchasing the press is today. You also know that you want to find the annuity due, because the first payment will be upon delivery which will be at the beginning of the year. To solve the problem, you do the following steps:
Value=Payment X PVAD (40,5%)
Value=9,500 X 18.01704 (found by looking up 40 periods at 5% interest on the present value annuity due table)
Value=171,162
Therefore, the total cost of purchasing from Vendor B, since they perform year end maintenance for no extra charge, is $171,162.
Vendor C:
For Vendor C, the full cash price or cost will be paid upon delivery, so you know that the cost of the press is $150,000. However, you also must account for the maintenance costs that differ each year.
For the first 5 years, maintenance costs are $1,000 a year. To find the present value of these cash flows, you need to perform a present value ordinary annuity due, since the payment occurs at the end of the year. The calculations for the first 5 years are as follows.
Value=1,000 X 3.79079 (found by looking up 5 periods at 10% interest in the PVOA table)
Value=3,791
The present value cost of maintenance is $3,791 for the first 5 years.
For the next 10 years maintenance costs are $2,000 a year. To find the present value, you take the same steps as the previous step, but you must take away the present value ordinary annuity factor of the first 5 years to separate the 10-year period by itself. The calculations are as follows.
Value=10-year payment X [PVOA (15,10%)-PVOA (5,10%) Value=2,000 X (7.60608-3.79079)
Value=7,631
So, the value of the next 10 years of maintenance will be $7,631.
Finally, for the last 5 years, cost of maintenance is $3,000 per year. To find what the present value of this annuity is, you do a similar operation to the previous step. You must take away the present value ordinary annuity factor of the 10-year period from the last period to get the present value of the final 5-year period. To do this, you use the following calculations.
Value=Last 5-year payment X [PVOA (5,10%)-PVOA (10,10%)] Value=3,000 X (8.5136-7.60608)
Value=2,722
So, the present value of the last five years of payments is $2,722.
To find the total cost of the purchase, you then must as each present value found and the original cash payment.
Total Cost from Vendor C=150,000+3,791+7,631+2,722 Total Cost from Vendor=164,144
Therefore, the cost of purchasing from Vendor C is $164,144.
After looking at the present values of all Vendor’s cash flows, Vendor C has the lowest, and Ellison should purchase from them.
CASE STUDY FIVE Palfinger
A. As a manufacturing company, Palfinger would have large warehouses and factories that would be considered buildings, they would own the land where these warehouses were located, and finally they would have heavy manufacturing machinery that would be included in the equipment classification. They would have an assembly line set up, vehicles for transportation, and storage equipment. B. The value of property, plant, and equipment on the balance sheet represents the
total of each of those categories less the respective accumulated depreciation. C. Palfinger reports its own buildings and investments in third-party buildings, Plant
and Machinery, and fixtures, fittings, and equipment in its notes.
D. The prepayments and assets under construction represents an asset that the
company did not purchase but built on their own. The prepaid portion comes from the Construction in Process account where the unfinished assets are treated as prepaid assets. There is no depreciation expense because the assets have yet to be capitalized as they are not fully finished in construction, and therefore the assets are not available for use. The reclassification value would represent assets that were finished up in construction and prepayments that have run out.
E. Palfinger depreciates assets through the straight-line depreciation method. The method seems reasonable because straight line depreciation is a commonly used and accepted accounting method for depreciation. There are several trade-offs management makes when selecting a depreciation method. One could be that the depreciation method chosen doesn’t accurately represent the amount of
production. Another trade off would be whether the company wants to recognize more profits now or later.
F. For replacement investments and value enhancing investments are capitalized and depreciated over either the new or the original useful life. The alternative
accounting method would be to capitalize and depreciate each individual improvement or enhancement as opposed to including the value in the original asset.
G. Parts:
i. The purchase of new property, plant and equipment:
PPE for 2007………. 149,990 PPE for 2006………. (98,130) Net Increase in
PPE………51,860 Total Accum. Depr. and Impairment for 2007……. 79,269 Total Accum. Depr. and Impairment for 2006…. (79,223) Total Purchase of New PPE 2007………$51,896 ii. The government grants are payments made to a company or
government assistance to a company. The grant is deducted from PPE because when the asset is purchased, the actual cost to the company is lower and therefore, the carrying value is lower, and this must be reflected in the balance sheet. By lowering the carrying value it would ensure the balanced sheet is balanced since the grant also has to be recorded.
iii. The company’s depreciation expense as stated in the notes is $12,557
iv. The net book value of disposals is the PPE of disposals in 2007 of $13,799 less the Depreciation and Impairment of disposals of $12,298 as reported in the notes. The NBV of disposals is then $1,501.
H. To calculate the gain, you need to subtract the NBV of the disposal from the proceeds on the sale of PPE.
Proceeds on Sale of PPE………. 1,655 NBV of Disposal………... (1,501) Gain………154 I. Table:
Method Year Book Value Depreciation
Expense NBV Straight Line 2007 10,673 1,880 8,793 Double Declining 2007 10,673 4,269 6,404 J. Parts:
i. To find the gain or loss, I used a journal entry for the sale
Cash 7,500
Equipment 10,673
The total income statement effect would be the loss on disposal of 1,293 added to the depreciation expense of 1,880. Therefore, the total income statement impact is a loss of 3,173.
ii. To find the gain or loss, I used a journal entry for the sale.
Cash 7,500
Accumulated Depreciation 4,269
Gain 1,096
Equipment 10,673
The total income statement effect of the gain on sale and the depreciation expense would be the depreciation expense of 4,269 less the gain of 1,096. Therefore, the total income statement impact is a loss of 3,200.
iii. The loss from using double declining balance is 27,000 euros more than using straight line.
CASE STUDY SIX Volvo
Introduction: Volvo Group- Research and Development Costs, helps to show how to account for research and development in a large company. The case makes students compare two different accounting systems, IFRS and US-GAAP, and shows how the accounting standards for these two areas differ. Not only that, but the case helps to delineate when to capitalize and when to expense certain research and development costs. The Volvo case highlights where on the financial statements research and development costs should be included. The inclusion of these research and development costs also helps students to see how capitalizing product development an effect on the balance has sheet and emphasizes how the financial statements would be different whether IFRS or US-GAAP is used. The Volvo case ensures that students gain a stronger grasp on how to account for Research and Development, and how it can affect the financial position of a company.
Questions:
A. The costs included in Research and Development expenses arise from costs put into trying to come up with potential advancements of products or new products altogether that ultimately never will realize a profit. However, if the research and development was successful, then the costs would be included in the intangible asset section of the balance sheet. So, the 13,193 million SEK, represents the amount of cost incurred on failed research and development programs.
B. When deciding what costs will be capitalized and which will be expensed, Volvo separates R&D into research costs and development costs. Research costs will always be expensed, and when it is too difficult to separate the research and development phases, then the entire cost will be expensed. Then when an asset is in the development phase, Volvo must determine several things. First, will the
asset be used internally or sold to customers, then Volvo must plan on selling the asset, and lastly, the asset must create future economic benefit for Volvo. Once Volvo can determine whether these aspects are met, then it can capitalize the development.
C. When determining the length of time for an amortization period for costs, Volvo would need to address how long it believes the developments will be useful. For instance, with software developments, after some period between three and eight years, the original development will become outdated, and therefore should be amortized because it will be lower in value. For each product or software
development, Volvo must decide how long the development will be relevant, how cutting edge the development is, and how long they can expect to receive and economic benefit from the development, and that will help Volvo determine an appropriate amortization period.
D. I believe that IFRS standards do a better job representing R&D costs on the financial statements. It makes more sense to me to capitalize costs that will ultimately see economic benefit, rather than simply expense them as soon as they occur. I think using IFRS would give a better representation of the intangible assets that a company has, and therefore, would better represent the financial position of the company.
E. Two Parts:
i. The amount of capitalized product and software costs, net of accumulated depreciation is 11,409. The line item where it is represented is the
ii. See Table-
Product and Software Development
Beg Bal. 12,381 Amortized 3,126 Amounts Capitalized 2,602 Amortized 448 End Bal. 11,409
F. Two Parts:
i. See Table-
(in SEK Millions) 2007 2008 2009 1) Product and software
development costs capitalized during the year
2,057 2,150 1,858
2) Total R&D expense on the income statement
11,059 14,348 13,193
3) Amortization of previously capitalized costs (included in R&D expense)
2,357 2,864 2,830
4) Total R&D costs incurred during the year = 1 + 2 - 3
10,759 13,634 12,221
ii. 2007: 2,057/10,759= 19.12%
2008: 2,150/13,634= 15.77% 2009: 1,858/12,221= 15.20%
i. See Table-
(in SEK millions) 2007 2008 2009 Net Sales, Industrial Operations 276,795 294,932 208,487 Total Assets, from Balance
Sheet
321,647 372,419 332,265
ii. See Table-
(for 2009) Volvo Navistar Total R&D Costs 12,221 433 Net Sales 208,487 11,300 Total R&D/Net Sales 5.86% 3.83%
Conclusion: The Volvo Group- Research and Development Costs Case leads students to better grasp how to account for Research and Development costs. Through using Volvo, a foreign company, it also helps to differentiate between IFRS standards and US-GAAP standards. The case teaches that IFRS appears to be the better accounting method because it expenses research costs, and only capitalizes development costs when the development will add economic benefit. This system ensures a more complete and applicable financial report, and better shows the financial position of the company. The case also teaches where and how research and development costs are included in the financial statements. Looking at the notes reveals that the total costs for research and development include the capitalized costs, the expenses, and then less the amortization of the capitalized intangible assets. Being able to put these together and understand what makes up the total, helps to understand what research and development is comprised of and if using IFRS, how successful research and development is at creating economic benefit. Overall, the case helps students to understand how accounting for research and development costs works, and the effect it can have on a company’s financial statements.
CASE STUDY SEVEN XXXXXXX Data and Analytics
Questions:
A. CaseWare Analytics started in Toronto in 1988 and was established as a software company that sells solutions to accounting, auditing, financial, risk, and governance professionals. They acquired the rights to IDEA from the CICA. IDEA stands for Interactive Data Extraction and Analytics. It is used to analyze large amounts of data from a variety of sources and gather information from each source to draw
conclusions. IDEA can take data from spreadsheets, databases, accounting programs, ERP systems, and T&E applications. It can then transform these inputs into PDFs, plain text, or even SAP for effective visualizations of the data. One of the major benefits of IDEA is that it can analyze data from almost any outside source. IDEA also ensures the integrity of the data through making it a read only access for non-authorized users and monitors for fraudulent activity. The program is user friendly as it gives step-by step instructions on how to continue the process, and it requires no programming knowledge. IDEA is also able to run on many Microsoft operating systems and does not require any special hardware.
B. Because IDEA emphasizes its user-friendliness, there are not many special skills that are needed to operate the software. Solid accounting or financial knowledge should be enough to operate the program, because it walks you through many of the steps. However, if any questions do arise, then CaseWare offers many tutorial videos on how to solve the issue. For me to gain the skills necessary to operate IDEA, it seems I that I would just need to download the program and begin to work through the
various operations it has. C. Three Parts
a. Auditors are tasked with looking over a variety of kinds of accounting information. From 10-K’s to receivables ledgers, an auditor needs to understand what is on the document and how it applies to the company’s financials. However, when uploading data, not all programs are able to read the uploaded information. Basic programs like Excel do not always have the power to read and analyze certain documents. But, with IDEA, when an auditor comes across a traditionally unusable report, due to its complexity, it can understand the information on the report, and give effective analysis.
Another aspect of an audit is ensuring that the client has not “managed” their financials or purposely attempted to commit fraud. While an auditor is tasked with looking for these things, there is always potential to overlook it.
However, IDEA reduces the chance that an inaccurate audit would occur. With the ability to analyze the entirety of a company’s data, the program would be able to quickly find any fraudulent activity and eliminate the chance of missing the crime.
The last instance where IDEA could be used would be for a massive, global company. The issue that an auditor would run into in this instance would be the massive amount of data that he or she would have to sift through. Imagining having to sit down and analyze thousands of documents. That would be daunting and would increase the chances to make a mistake.
amount of data to be uploaded, and could then analyze the data much quicker, with less mistakes than a human auditor.
b. Tax associates are constantly striving to find a way to reduce the amount of taxes their clients must pay. One way that they can reduce their clients overall taxable base, is by ensuring that they financial statements are not overstating the income on financial statements. Even minor mistakes on the recording of financials could inflate the overall income, and in turn create a larger taxable base. However, a tax associate can use IDEA to review the financial
statements. IDEA could find any areas where income could be overstated, and the tax associate could use this to correct the net income, thereby lowering the overall taxes paid.
For global companies, they are subjected to taxes in each country, state, and sometime city that they operate in. As a result, these companies pay billions of dollars in taxes every year. For this reason, they are always seeking out ways to minimize their taxable dollars. Sometimes, this means holding their cash in areas where tax rates are lower. Using IDEA’s analytics tools, tax associates could plug into the system the tax rates of various countries to establish a plan regarding how and where to keep a company’s money and operations. This would allow for these multi-billion-dollar companies to pay the least amount of tax possible and using the savings to continue to innovate and expand.
Another way the IDEA could be used in tax planning would be to help companies project new areas to expand into. With the analytics abilities of IDEA, a tax planner could input the varying tax levels of different countries, and the program would then output the total amount of expected taxes. Using IDEA in this way would help to properly prepare an organization for the possible tax burden. IDEA would be incredibly useful to these companies because it could quickly find out the total taxes, and then display how it found the numbers in clear visuals. It would make a tax planners job significantly easier because he or she could clearly show the client exactly what he expected to happen.
c. One job of audit, tax, and advisory accountants is financial statement analysis. The financial statements of clients can give each role in a firm valuable information about his task. However, when the financial statements of a company are thousands of pages long the task can be daunting, if not
impossible. But, with IDEA, the financial statements can be quickly uploaded and analyzed. The amount of time it would have taken to look over the
statements would be dramatically reduced, and analysis of the financials could be presented to the clients almost immediately. This would save the clients time and money and would make the firms services more valuable to them.
manufacturing company, the accountant would be required to go in and personally inventory many of the assets. They would then have to upload their findings to a program, then look at another program where the client’s assets were listed, and then make sure the numbers are all the same. In IDEA, these middle steps would be removed. The accountant could upload the inventory data directly into the IDEA program, which would already hold the client’s inventories, and then check if they were balanced. It would save time and would be a valuable tool for the valuating accountant.
In advisory, there are many instances where an accountant would need to present his or her findings or ideas to a client. In these cases, it is important for the accountant to have clear visuals and effective analysis. Without IDEA, the presenter would most likely have to use several different programs to create solid visuals, and then another program to come up with analysis. But, with IDEA, the accountant could do all these functions in a single program. It would streamline the whole process and would save the advisor time where he or she could focus on the actual meat of the presentation as opposed to just the setting up and organizing of it.
D. Currently, data aggregation and analysis require incredible amounts of time to input and then gather valuable information from the data. As accountants, we must constantly transfer data between several programs, each of which have a specific function and require additional time to gather valuable conclusions. The results of
using all these different programs is an inefficient business process. However, if our firm decides to invest in IDEA, much of the time waste can be eliminated. IDEA runs analytics on a variety of data types and would be the perfect program to streamline all our needed analysis. It also is a powerful presentation tool, and it creates clear visuals that would be valuable to our clients.
Ultimately, the time saved from using IDEA would allow for our entire accounting team to focus on more important jobs. Another attractive aspect is the ease with which IDEA can be learned. CaseWare, the developer of idea, touts that its product is user-friendly and requires no programming knowledge. The firm’s employees would be able to quickly transition from their old programs to IDEA with minimal training time. IDEA eliminates the main fear of a programming change by reducing the amount of time it would take to teach employees how to use the new program. The other positive aspect about IDEA, is that it would allow for more associates to work on bigger picture tasks and eliminate the need to spend hours on bookkeeping and presentation building. This would increase overall work efficiency, and
effectiveness as employees could work on more specific tasks that would provide greater benefit to the client. IDEA would help to reduce wasted time and busy work and could empower employees to spend time on higher functions that would be more valuable to the client. Especially in today’s world where advisory services are
becoming more desired, IDEA would allow our firm to use expend more resources on the advisory side and bring more benefit to our clients.
CASE STUDY EIGHT Rite Aid
Introduction: The Rite Aid case focuses on Long Term Debt and how it is handled in the financial statements, from the balance sheet to the notes. The case takes you into debt disclosures in the financials and makes you try and understand what each line means, and how to interpret the information that you are given. The case also emphasizes discounts and premiums on notes payable, and how that can affect year-end entries, as well as the overall interest expense a company will have to record each period. Using the financial statements brings a real-world scenario into typically, predictable and uninteresting notes payable problems. Understanding that the information given in the case allows for it to be a more meaningful representation of financials. Having to go step by step and break down payments allows for a better understanding of how the debt process works, and helps individuals visualize why certain debt agreements are made and how the economic environment effects the decisions. The Rite Aid case is a valuable case for aiding in overall understanding of long-term debt.
Questions:
A. Consider the various types of debt described in note 11, Indebtedness and Credit Agreement.
i. Secured debt is debt backed by collateral to reduce risk. Rite Aid would specify this debt because it would put certain assets it owns at risk.
Unsecured debt is debt not backed by any asset. Therefore, it is inherently riskier, and may take lawsuits to recover. Rite Aid should separate this form of debt to highlight the debt that if not paid, could result in civil suits.
ii. Guaranteed debt is debt that is backed by a third party in case the original party cannot cover their debts. Rite Aid’s subsidiaries are written in as the guarantor on many of the guaranteed debts.
iii. Senior means for debt that the debt takes precedence over all other debts and must be paid first in the instance that a company liquidates its assets. Fixed-rate means that the same amount of interest will be paid every period. Convertible means that the debt can be converted into a
predetermined amount of the company’s equity at certain times at the debt holder’s discretion.
iv. Rite Aid has so many different types of debt at different interest rates because they environment that they are agreeing to these contracts is different for each form of debt. It can change based on the market rate, who the agreement is with, and the total value of the debt. Each of these would cause the type of date and interest rates to be different.
B. Rite Aid’s total debt is $6,370,899. The debt maturing in the current year is $51,502. To reconcile the total debt that Rite Aid cites on its balance sheet, the current maturities must be combined with Long-term debt, and lease debt.
Current Debt + Long Term Debt + Leases = Total Debt 51,502 + 6,185,633 + 133,764 = 6,370,899 C. Consider the 7.5% senior secured notes due March 2017.
i. The face value of the note is $500,000, and that is known because the value does not change due to any amortization of a premium or a discount from 2009 to 2010.
ii. Cash 500,000
Note Payable 500,000
iii. Interest Expense 37,500 (500,000 * .075)
Cash 37,500
iv. Note Payable 500,000
Cash 500,000
D. Consider the 9.375% senior notes due December 2015. Assume that interest is paid annually.
i. The principal of the note is $410,000. The carrying value of the note is $405,951. The two values differ because the note was originally issued when the market rate was greater than the stated rate of the note. This causes the note to be issued at a discount and is why the carrying value is less than the principal.
ii. Rite Aid paid $38,438 in interest in the fiscal year 2009. This is found by multiplying the principal by the stated rate (410,000 * .09375).
iii. The interest expense for year ended February 27, 2010 is $39,143. This is found by taking the cash that is to be paid each year (which is constant) and adding to it, the discount from 2009 to 2010 (found in the footnotes),
Discount on Notes Payable 705
Cash 38,438
v. The total rate of interest can then be found by using algebra. 405,246 * Interest rate = 39,143
Interest Rate= 9.65%
We use the carrying value from 2009, because to find interest expense for the current year, you would use the previous year’s carrying value.
E. Consider the 9.75% notes due June 2016. Assume that Rite Aid issued these notes on June 30, 2009 and that the company pays interest on June 30th of each year.
i. Cash` 402,630
Disc on Note Payable 7,380
Note Payable 410,000
ii. To find the effective interest rate, you can use a financial calculator. The inputs will be:
N=8 I/Y=? PV=402,620 PMT=-39,975 FV=-410,000
As a result, your effective interest rate will be 10.12%. iii. See Table.
Date Interest Payment Interest Expense Bond Discount Amortization Net Book Value of Debt Effective Interest Rate 6/30/2009 - - - 402,620 10.12 6/30/2010 39,975 40,745 770 403,390 10.12 6/30/2011 39,975 40,823 848 404,238 10.12 6/30/2012 39,975 40,409 934 405,172 10.12 6/30/2013 39,975 41,003 1,028 406,200 10.12 6/30/2014 39,975 41,107 1,132 407,332 10.12 6/30/2015 39,975 41,222 1,247 408,579 10.12 6/30/2016 39,975 41,396 1,421 410,000 10.12
iv. Interest Expense 27,167
Discount on Note Payable 517
Interest Payable 26,650
v. The net book value would be the 402,620 plus the discount amortized of 517. Therefore, the net book value would be $403,137.
Conclusion:
After doing the Rite Aid case, I have a much better of long-term debt and its presentation on the balance sheet. At the beginning of the case, I was not able to connect the debt on the balance sheet and the financial statements, and really did not even know the
difference between secured and unsecured debt. However, after going through each question and being forced to work many of the problems backwards, the case gave me a better understanding of how the financials are linked. Overall, the case allowed me to learn more about notes, their interest payments, and how they link to a company’s overall debt.
CASE STUDY NINE Merck
Introduction:
The Merck Case Study emphasizes the need to understand stockholder’s equity. As one of the main ways that a company raises capital, stockholder’s equity is a vital part to any large-scale, successful corporation. The case attempts to differentiate between the different kinds of equity and what increases or decreases total equity. Using the financials given, the case ensures that we must look at common and preferred stock, and understand the difference between authorized, issues, and outstanding shares, and how each one has a specific impact on the financials. The case also makes sure that we understand how dividends work, and how they represent a decrease in stockholder’s equity. Lastly, the case shows us why a company would seek to repurchase their stock, and how that would affect the company’s financial position.
Questions:
A. Consider Merck’s common shares.
i. Merck has authorized 5,400,000,000 shares. ii. Merck has only issued 2,983,508,675 shares.
iii. The dollar value of common stock on the balance sheet is reported at 29.8 million dollars. This number originates from the 2,983,508,675 shares multiplied the par value of one cent.
2,983,508,675 shares X .01 =$29.8 million
iv. By looking at the balance sheet, it shows that there are 811,005,675 shares of Treasury Stock being held as of December 31, 2017.