Northumbria Research Link
Citation: Nnko, Noe, Yang, Longzhi, Chao, Fei and Naik, Nitin (2020) A Comparative Study of Genetic Algorithm and Particle Swarm optimisation for Dendritic Cell Algorithm. In: 2020 IEEE Congress on Evolutionary Computation (CEC). IEEE, Piscataway, NJ, pp. 1-8. ISBN 9781728169309, 9781728169293
Published by: IEEE
URL: https://doi.org/10.1109/cec48606.2020.9185497
<https://doi.org/10.1109/cec48606.2020.9185497>
This version was downloaded from Northumbria Research Link:
http://nrl.northumbria.ac.uk/id/eprint/44660/
Northumbria University has developed Northumbria Research Link (NRL) to enable users to access the University’s research output. Copyright © and moral rights for items on NRL are retained by the individual author(s) and/or other copyright owners. Single copies of full items can be reproduced, displayed or performed, and given to third parties in any format or medium for personal research or study, educational, or not-for-profit purposes without prior permission or charge, provided the authors, title and full bibliographic details are given, as well as a hyperlink and/or URL to the original metadata page. The content must not be changed in any way. Full items must not be sold commercially in any format or medium without formal permission of the copyright holder. The full policy is available online:
http://nrl.northumbria.ac.uk/pol i cies.html
This document may differ from the final, published version of the research and has been made available online in accordance with publisher policies. To read and/or cite from the published version of the research, please visit the publisher’s website (a subscription may be required.)
A Comparative Study of Genetic Algorithm and
Particle Swarm Optimisation for Dendritic Cell
Algorithm
Noe Elisa, Longzhi Yang
Department of Computer and Information Sciences Northumbria University
Newcastle upon Tyne, UK
Email:{noe.nnko, longzhi.yang}@northumbria.ac.uk
Fei Chao
Department of AI Xiamen University Xiamen, P.R. China Email: [email protected]Nitin Naik
Defence School ofCommunications of Information Systems Ministry of Defense, UK Email: [email protected]
Abstract—Dendritic cell algorithm (DCA) is a class of artificial immune systems that was originally developed for anomaly detection in networked systems and later as a general binary classifier. Conventionally, in its life cycle, the DCA goes through four phases including feature categorisation into artificial signals, context detection of data items, context assignment, and finally labeling of data items as either abnormal or normal class. During the context detection phase, the DCA requires users to manually pre-define the parameters used by its weighted function to process the signals and data items. Notice that the manual derivation of the parameters of the DCA cannot guarantee the optimal set of weights being used, research attention has thus been attracted to the optimisation of the parameters. This paper reports a systematic comparative study between Genetic algorithm (GA) and Particle Swarm Optimisation (PSO) on parameter optimi-sation for DCA. In order to evaluate the performance of GA-DCA and PSO-GA-DCA, twelve publicly available datasets from UCI machine learning repository were employed. The performance results based on the computational time, classification accuracy, sensitivity, F-measure, and precision show that, the GA-DCA overall outperforms PSO-DCA for most of the datasets.
Index Terms—Dendritic cell algorithm, particles swarm op-timisation, genetic algorithm, danger theory, artificial immune systems.
I. INTRODUCTION
Artificial immune systems (AISs) are computational intel-ligence models inspired by the principles and functioning of natural human immune systems (HIS). Generally, AISs are developed by exploiting the characteristics of HIS such as scalability, memory, learning, adaptation, self-organisation and robustness. In fact, AISs have been successfully applied to different engineering and computation applications including optimisation, anomaly detection, pattern recognition, industrial control systems, data mining, IoTs, and etc [1], [2].
Over the past few decades, different AISs for anomaly detection in networked systems have been developed; and they can generally be divided into two generations of models [3]. The first generation AISs are abstracted from the theory of self-nonself of HIS which articulates that, the immune system has the ability to discriminate between own cells (one-self)
This work has been supported by the Commonwealth Scholarship Com-mission (CSC-TZCS-2017-717) and Northumbria University, UK.
which are tolerated and foreign cells (non-self) which are eliminated [4]. Typical examples of the first generation of AISs include Negative selection algorithm (NSA), Positive selection algorithm (PSA), Immune network theory (INT) and Clonal selection algorithm (CSA) [1], [2]. A number of limitations have been identified for the first generation AIS algorithms, such as scalability, high rate of false positives and requires initial learning phase [3], [5].
The DCA was introduced to address the limitations of the first generation, as a second generation AIS algorithm, for anomaly detection in computer networks [6]. Briefly, the DCA is abstracted from Danger theory (DT) of HIS and the functioning of human dendritic cells (DCs) [6]. Since its invention, the DCA has been successfully applied to a wide range of anomaly detection applications with good perfor-mances, such as intrusion detection, robotic, fault detection in wind turbines, computer virus detection, amongst other [5]. This study therefore focuses on the optimisation of learning parameters of the DCA.
Conventionally, in its life cycle, the DCA goes through a number of phases including features categorisation into artificial signals, context detection of data items, context assignment and finally labeling of data into either normal or abnormal class. In particular, the context detection phase requires users to manually predefine the parameters used by its weighted function for processing the signals and data items; this can be a very difficult task and also often results in non-optimal solutions [7]. Genetic algorithm has therefore been recently used for parameters optimisation of the DCA, with better performance demonstrated compared to the convention-ally manual predefined values [7]. However, the performance analysis of the GA supported DCA (GA-DCA) was conducted by using only one publicly available dataset which may not be sufficiently rigorous to evaluate the general optimisation capability of GA for DCA on different binary classification datasets.
This work therefore systematically studied the efficacy of GA and particle swarm optimisation (PSO) on parameters optimisation for DCA using a number of publicly available
binary classification datasets. The selection of GA and PSO in this work were based on their ability to achieve the proper balance between exploitation and exploration of search space simply by setting well relatively fewer number of adjustable parameters as compared to other metaheuristic optimisation methods [8]. Briefly, GA is a population-based metaheuristic search technique used to find the best optimal solutions to optimisation problems by employing the bio-inspired operators such as mutation, crossover, elitism, fitness evaluation and selection [8]; the PSO is another population-based metaheuris-tic search method that is abstracted by simulating the social behavior of birds flocking or fish schooling [9].
In this study, both GA-DCA and PSO-DCA methods firstly apply feature selection process to the dataset. In contrast to the original DCA which categorises the selected features into three signals [6], this study uses the recent proposed work as reported in [10] which takes all selected features as system inputs as detailed in Section III. Then, the optimal set of parameters associated with the selected features are effec-tively searched by employing GA or PSO. The performance evaluation and comparisons between GA-DCA and PSO-DCA were conducted by using twelve binary classification datasets available at the UCI machine learning repository [11]. The results based on the computational time, classification accu-racy, sensitivity, F-measure and precision demonstrate that, the GA-DCA performs better on optimisation of the DCA for most datasets compared to PSO-DCA. Additionally, GA-DCA was least affected by the size of the dataset as it took relatively less time to converge compared to PSO-DCA.
This paper is structured as follows. Section II provides a literature review on biological underpinnings and the DCA algorithm. Section III details the application of GA and PSO on parameters optimisation of the DCA. Section IV reports the experimentation process and performance comparison of the results. Section V concludes this study and points out the possible future studies.
II. BACKGROUND
This section reviews the underpinning danger theory, bio-logical DCs and the DCA algorithm.
A. Danger Theory (DT)
DT articulates that, HIS relies not only on making a discrimination between self-cells and foreign cells but rather reacting to what might cause damage and things that might not [12]. The recognition of danger is based on the type of antigen detected. Antigen can be foreign molecules that are capable of causing HIS to generate immune response (i.e.; tolerance or elimination). In DT, the following three signals that are emitted from the tissue associated with certain antigens are used by HIS to discriminate between normal and abnormal situations.
• Pathogen-Associated Molecular Pattern (PAMP) - is any signal with a signature of abnormal behaviour which is usually produced by bacteria or viruses. Detection of PAMP is a confidence indicator of abnormality associated with an antigen.
• Danger Signal (DS) – is produced by distressed cells within the HIS and as a result it shows a degree of abnormality but with lower confidence than PAMP. • Safe Signal (SS) – is produced by healthy cells or when
cells die naturally and thus act as an indicator of normal bahaviour within the HIS.
B. Biological Dendritic Cells (DCs)
In HIS, the DCs coordinate antigens presentation from the external tissues (e.g. skin and lung) and the adaptive immune system (i.e., blood cells) [12]. DCs produce co-stimulatory molecules (csm) on their cell surface which limit the time they spend sampling antigens in the tissue. Usually, DCs exist in one of the following three states depending on the concentrations of SS, PAMP or DS in HIS.
1) Immature DCs (iDCs): are in their pure state in the HIS where they constantly collect antigens until they mature. 2) Full Mature DCs (mDCs): iDCs are transformed to mDCs when they are exposed to a greater quantity of either PAMP or DS than SS which causes immune reaction. 3) Semi-mature DCs (smDCs): iDCS are transformed to
smDCs when they expose to more SS than PAMP and DS which causes immune tolerance.
C. Dendritic Cell Algorithm (DCA)
The inspiration from the DT and the behaviour of DCs has led to the development of the DCA which is a population based binary classification system. Firstly, feature selection process is applied on the training data to select the most informative features, and many feature selection approaches have been proposed in the literature which can be readily used here, such as [13], [14] This is followed by four phases of the DCA, including signal categorisation, context detection, context assignment and labeling as introduced below.
1) Signal Categorisation: The selected features are cate-gorised into either PAMP, SS or DS based on their definitions derived from the biological behavior, with more details avail-able in [5], [6].
There are two common signal categorisation techniques used with the DCA in the literature, including the manual approach by relying on the expert knowledge of the problem domain [6], and the automatic methods such as PCA [15], fuzzy-rough set theory [16], GA shuffle mutation [17] or fuzzy inference systems [18]–[20]. After signal categorisation process, the DCA initialises a population of artificial DCs (often 100) in a sampling pool which are responsible for data items sampling [6]. Then, a pre-defined number of matured DCs (often 10) are selected in each cycle to for information aggregation.
2) Context Detection: Each DC in the sampling pool is assigned a migration threshold in order to determine the lifes-pan when sampling data items are taken from the data source. The migration threshold is determined from the characteristic behaviour of the dataset and the amount of data items the DCs can sample per cycle; this is usually initialised in a Gaussian distribution [15]. In this phase, the selected DCs use a weighted summation function for sampling based on
three sets of pre-defined weights to process the input signals to obtain three output context values termed as csm, mDC
andsmDC: Context[csm, smDC, mDC] = m X d=1 P3 i,j=1,1(cj∗w j i) P3 i,j=1,1w j i , (1) wherecj(j = 1,2,3), represents the PAMP, DS or SS signal values; and wji(i, j= 1,2,3) represents the weights of csm,
mDC andsmDC context, regarding PAMP, DS and SS. The weights are usually either pre-defined or derived empirically from the dataset.
Note that the DCs sample multiple data items overtime and thus the three output context values for the sampled data items are obtained in an incremental manner. Concurrently, DCs continuously compare the cumulative csm values with the assigned migration thresholds to determine its action next. When thecsmvalue of a DC exceeds the migration thresholds, it ceases sampling data, migrated to either asmDCormDC, and moves to the context assignment phase; otherwise, it keep sampling new data.
3) Context Assignment: In this phase, DCs use their cumu-lative context values ofmDCandsmDCcomputed from the detection phase to determine their contexts. If a DC has greater cumulative mDC thansmDC, it is assigned a binary value of 1, and 0 otherwise. Then, all the data items that this DC has sampled will also be assigned with this value. Finally, during the labeling phase, this information is used to determine the number of anomalous samples presented in the dataset, given that those with a binary value of 1 are potentially anomalous, otherwise very likely normal. Note that, once the DCs have completed their life cycle in DCA, they are reset and returned to the sampling population in order to maintain the population size.
4) Label Assignment: The processed data items by DCs are analysed by deriving the Mature Context Antigen Value
(M CAV) per data item. Firstly, the anomaly threshold is
computed from the training dataset by taking the ratio of the total number of anomaly class’s data samples to the total number of data items present. Then, the M CAV value is determined from the ratio of the number of times a data item is presented in the mDC (i.e., anomaly) context to the total number of presentation in DCs. If a data item has theM CAV
value greater than the anomaly threshold, it is classified into the anomaly class, otherwise classified as normal.
III. DCA PARAMETERSOPTIMISATIONUSINGGAAND
PSO
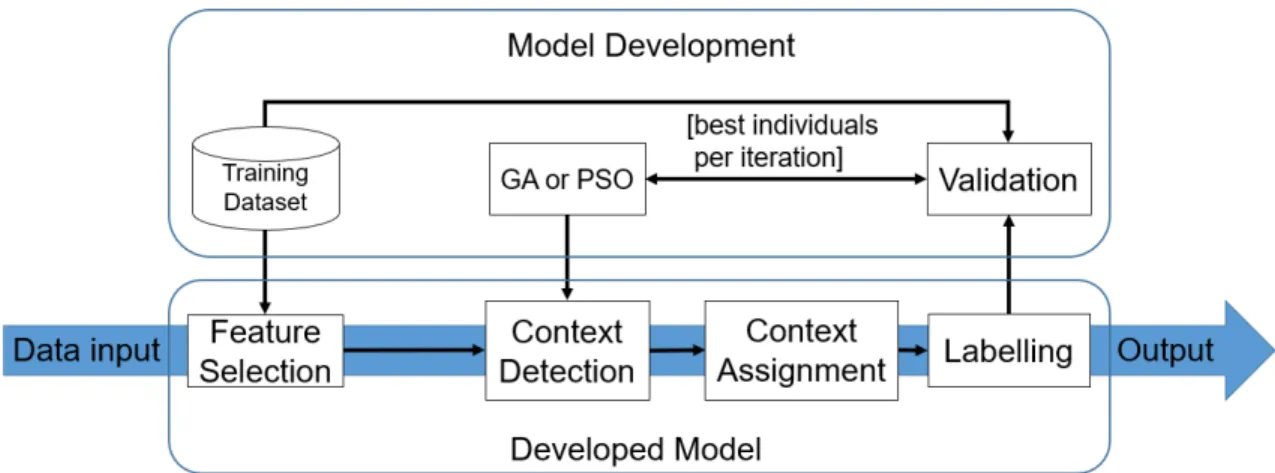
The DCA system with parameters optimisation is illustrated in Figure 1. Feature selection is firstly employed to select the most informative features from the dataset. In contrast to the original DCA which categorises the selected features into three signals of either PAMP, SS or DS, this study uses the recent proposed approach as reported in [10] which takes all selected features as system inputs as briefed in Section III-A. This amendment is made based on the finding that the direct use of features will not comprise the performance of the DCA
system, but improve system efficiency. Of course, this revision makes the determination of the weights very difficult as many more weights are required, but this can be readily solvable with the support of the automatic parameter optimisaion techniques. In particular, the optimal set of parameters associated with the selected features are effectively searched by employing the GA or PSO during context detection phase as detailed in Sections III-B and III-C, respectively. The last two phases of the optimised GA-DCA or PSO-DCA are exactly the same as the original DCA version, and thus this section focuses only on the optimisation of the parameters using GA and PSO during the context detection phase.
A. Context Detection
A recent study shows the DCA can perform competitively without categorising the features into either PAMP, SS or DS by [10]. Briefly, suppose that u features have been selected during the feature selection process, the migration threshold for aDC isth, andmdata instances have been sampled by a
DC overtime; its cumulative value ofcsm, denoted ascsmc, is determined by using a generalised weighted summation function: csmc= m X d=1 Pu j=1(xj∗w j csm) Pu j=1w j csm , (2)
wherexj is the normalised value of selected featuresj,wcsmj is the weight of attribute j regarding the csm. The weight
wj
csm is determined during the training process using GA or PSO in this work as discussed in the next Subsection III-B and III-C.
As soon as thecsmcvalue of the DC exceeds its assigned
th, it ceases sampling data items, migrates to the mature DC pool, and then computes the cumulativesmDCc andmDCc:
smDCc= m X d=1 Pu j=1(xj∗w j smDC) Pu j=1w j smDC , (3) mDCc= m X d=1 Pu j=1(xj∗w j mDC) Pu j=1w j mDC . (4)
Equations 2, 3, and 4 take very different set of weights, which can be summarised as:
W = w1smDC wsmDC2 ..wsmDCj ..wusmDC w1 mDC w2mDC ..w j mDC ..wumDC wcsm1 wcsm2 ..wcsmj ..wucsm . (5)
B. Parameters Optimisation Using GA
GA is a family of computational models inspired by natural evolution which heuristically search for optimal or near-optimal solutions for optimisation problems [21]. GA has been employed for parameters optimisation in machine learning models, such as neural networks [21], DCA weights generation [7] and rule base optimisation in fuzzy inference systems [22]– [24] with significant performances, in addition to its traditional use such as job shop planning and scheduling [25]. GA starts by randomly initialising a population of individuals (each representing a potential solution) in a pool for a given problem.
Figure 1: Parameters optimisation of the DCA by using GA/PSO
Then, it uses the techniques inspired by evolutionary biology, such as selection, mutation and crossover to evlove the indi-viduals. Gradually, more effective individuals are evolved over a number of iterations until a specified level of performance or maximum number of iterations is reached.
In this work, the main GA steps to optimise the parameters of the DCA as expressed in Equation 5 are summerised below.
1) Individual representation:In this work, an individual (I) within a population is designated as a possible solution that contains all the weights in Equation 5.
2) Initialisation of individual’s parameters:The population
P ={I1, I2, ..., IN} is randomly initialised from a Gaussian
distribution with a mean of 0 and a standard deviation of 5. Here,N is the size of population which is a problem-specific modifiable parameter, with a value between 10 and 50 being commonly used [22].
3) Objective function: In this work, GA used the classi-fication accuracy of the DCA as the objective function to determine the fitness of individuals.
4) Selection: The fitness proportionate selection method is adopted in this work for selecting individuals who reproduce. Therefore, the probability of an individual to become a parent is proportional to its fitness.
5) Reproduction: The single point crossover and mutation operations were applied to increase the likelihood of obtaining the global optimal solution while reducing the probability of stagnation.
6) Iteration and termination: The GA converges when the classification performance of the DCA exceeds the pre-specified threshold of the optimum accuracy or the pre-defined maximum number of iterations is reached. Subsequently, when GA terminates, the optimal weights are taken from the fittest individual in the current population. From this, the DCA can perform validation using this set of weights.
C. Parameters Optimisation Using PSO
PSO is a population based stochastic and metaheuristic optimisation method which is developed by simulating the social behavior of bird flocking (i.e.; birds randomly searching for food in an area) [9]. PSO starts by initialising a population
of random particles (i.e., potential solutions) and searches for optimal or near optimal solutions by going through a number of iterations. Each iteration updates the velocity and position of particles. However, unlike GA, PSO does not use crossover and mutation evolution operators, thus, diversifica-tion of soludiversifica-tions lies on the velocity of particles, direcdiversifica-tion of particles and the best regions in the search space. In fact, PSO has been successfully exploited for weights optimisation in artificial neural network, rule base optimisation in fuzzy inference systems, function optimisation, amongst other [26]. In PSO, the possible solutions (i.e.; particles) move through search space by following the best particle in the current iteration. Thus, two best values are used to update the position of particles in every iteration. The first best value is the best fitness value that a particle has achieved so far, called personal best (pbest); and the second one is called the global best value
(gbest), which is the best fitness value of the best particle in
the current iteration.
After determining the two best values, each particle updates its velocity (Vi(t+ 1)) and position (Xi(t+ 1)) using:
Vi(t+ 1) =
ωVi(t) +c1r1[pbest−Xi(t)] +c2r2[gbest−Xi(t)],
(6)
Xi(t+ 1) =Xi(t) +Vi(t+ 1), (7) where,i is an index of a particle;ω is the inertia coefficient;
c1andc2are acceleration coefficients (0≤c1, c2≤2);r1and
r2 are random values (0≤r1,r2≤1) which are regenerated every time along with velocity updates;Vi(t)is the velocity of a particle at timet;Xi(t)is the position (value) of a particle at timet;pbestis the particle’s individual best position at time
t;gbest is the swarm’s best particle in the current iteration at
timet.
In this work, the parameters used by the PSO are detailed below:
1) Particle representation:In this work, a particle (P) within a swarm is a designated solution that comprises of all the parameters of Equations 2, 3 and 4 in the DCA, as summarised in Equation 5.
2) Initialisation of particle’s parameters: The swarm S =
a Gaussian distribution with a mean of 0 and a standard deviation of 5. Here,M is the total number of particles in the swarm which is adjustable depending on a specific application, with a value between 10 and 30 being widely used [8]. Note that, the greater the initialised number of particles are used in the swarm, the more diverse the solutions are, as it allows bigger regions of the search space to be visited per iteration.
3) Objective function: In PSO, each particle computes its fitness value by using the objective function to be optimised. In this work, the objective function of each particle is the classification accuracy led by the DCA.
4) Acceleration coefficients: The acceleration coefficients
c1 and c2, and the random values r1 and r2, regulate the interaction among particles and the best particle in the swarm, as well as stochastic influence on the overall velocity of a particle. The parameter c1 is the cognitive component which represents how much confidence a particle has in itself and hence influencing it to return to its individual best values in the search space; whereas, c2 is the social component which represents the confidence a particle has in its peers and thus influences the particle movement towards the best values the swarm has covered so far. Low values forc1andc2allow the particles to explore the search space far from the best regions before being pulled back towards the best solutions [9].
Parameters r1 and r2 are random coefficients which are updated every time when the velocity is updated. Additionally, in PSO, it is common to define an upper and lower bounds for the velocity parameters for limiting the particles from ’flying’ out of solution space [9].
5) Inertia component: The inertia component (ω) helps to maintain the steady movement of particles in the same direction. Lower value of ω speeds up convergence while higher value encourages exploration of the search space. The value of inertia is usually set between 0.8 and 1.2 [9].
6) Neighborhood size: The neighborhood size sets the degree of interaction between the particles interaction within the swarm. If the neighborhood size is smaller, the particles interact less between each other, and vice versa. A large neighborhood size enables faster convergence but it is more susceptible to local optimal solutions. In contrast, a small neighborhood size usually leads to slower convergence but it has more reliable convergence towards a globally optimised solutions. In this work, in order to benefit the advantages of both large and small neighborhood sizes, the PSO algorithm starts the search operation with a small neighborhood size and then gradually increases the neighborhood size for later iterations.
7) Iteration and termination: Just like GA, PSO terminates when the classification performance of the DCA exceeds the pre-specified threshold of the maximum optimum accuracy or the pre-defined maximum number of iterations is attained. Subsequently, when the PSO terminates, the optimal param-eters are taken from the best particle in the current swarm. From this, the DCA performs validation using the optimal set of weights.
IV. EXPERIMENTAL VALIDATION AND COMPARATIVE STUDY
This section describes the setup of experiments, processes, and results analysis. All experiments were implemented in Java under NetBeans IDE 8.2. Then, the performance comparison were performed by using an HP workstation with Intelr XeonTME5-16030 v4 CPU @3.70 GHz and 32GB RAM. Each experiment was repeated ten times to ensure that the recorded result is the optimal or near optimal.
A. Benchmark Datasets
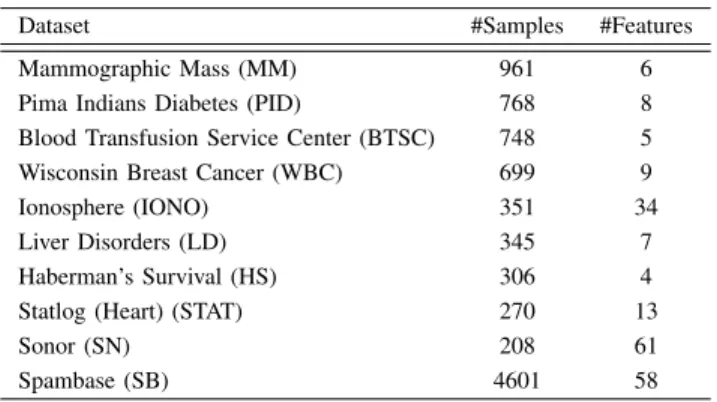
The datasets used to evaluate the performances of GA-DCA and PSO-GA-DCA were adopted from the UCI machine learning repository [11]. Table I presents the properties of these datasets. Note that, where the testing set is not provided, ten-fold cross-validation was used.
Table I: Benchmark Datasets
Dataset #Samples #Features Mammographic Mass (MM) 961 6 Pima Indians Diabetes (PID) 768 8 Blood Transfusion Service Center (BTSC) 748 5 Wisconsin Breast Cancer (WBC) 699 9 Ionosphere (IONO) 351 34 Liver Disorders (LD) 345 7 Haberman’s Survival (HS) 306 4 Statlog (Heart) (STAT) 270 13 Sonor (SN) 208 61 Spambase (SB) 4601 58
In addition to this, as DCA was invested for network se-curity, two larger and more complex benchmarked datasets in the field of network intrusion detection were used to compare the performances of GA-DCA and PSO-DCA:
KDD99 Dataset: an intrusion detection dataset, 41 features, 494,021 records of training set (i.e.; 97,278 normal and 396,743 anomalous), and 311,029 records in the testing set (i.e.; 60,593 normal and 250,436 anomalous) [27].
UNSW NB15 Dataset: an intrusion detection dataset, 49 at-tributes, 175,341 records of training set (i.e.; 56,000 normal and 119,341 anomalous), and 82,332 records in the testing set (37,000 normal and 45,332 anomalous) [28].
1) Dataset Pre-processing: The information gain method was exploited in this work to select the most informative fea-tures from each dataset [29]. Then, each selected feature was normalised by applying the simple min-max normalisation.
2) DCs Sampling: In each DCA cycle, 10 matured DCs were used to process the data items. The migration thresholds of DCs were initialised in a Gaussian distribution with a mean of 5.0 and standard deviation of 1.0. The anomaly threshold of each dataset was computed by taking the ratio of the total number of anomaly samples to the total number of samples presented in the dataset.
3) Parameters of GA and PSO: In this study, the parameter values used for the GA were; mutation rate of 0.1, crossover rate of 0.95, 100 number of iterations, and 20 individuals in a population.
The parameter values and coefficients used for the PSO include 100 number of iterations, 20 individuals in a swarm,c1 = c2 = 2.0,0≤r1,r2≤1, initial velocityV0 = 0, maximum velocity Vmax = 10 and ω = 0.95. The selection of these parameters values was made based on their commonality in many studies [9].
4) Measurement metrics: The performances of GA-DCA and PSO-DCA were firstly compared via accuracy, sensitivity and specificity. Generally, higher sensitivity means higher per-centage of the true positive generated by the DCA. Likewise, parameters with higher specificity usually lead to more true negative results from the DCA. Accuracy, Sensitivity and specificity are defined as follows:
Accuracy= T P+T N T P +T N+F P +F N Sensitivity= T P T P +F N Specif icity= T N T N+F P, (8)
where TP, FP, TN, and FN refer to true positive, false positive, true negative and false negative, respectively.
The performances of GA-DCA and PSO-DCA were also evaluated using precision, recall and F-measure to further investigate the quality of the generated optimal set of pa-rameters, especially for imbalance datasets. Note that, high accuracy usually indicates that the generated set of optimal weights by GA or PSO are better only when the dataset has similar numbers of samples for all classes and all classes are of the same level of importance. F-measure is more effective than accuracy for performance evaluation when a dataset is imbalanced. The precision, recall and F-measure are computed as follows:
P recision= T P
T P+F P
Recall= T P
T P+F N
F−measure= 2∗Recall∗P recision
Recall+P recision .
(9)
B. Results and Discussion
This section presents the experimental results and discusses the performances of GA-DCA and PSO-DCA.
1) Performance on Accuracy, Sensitivity and Specificity:
The classification accuracy, sensitivity and specificity for both GA-DCA and PSO-DCA are summarised in Table II, with the best performances highlighted in bold. Note that, the comparisons between the pre-defined weights [6] and GA-DCA optimised were performed in the previous work of [7], [10], [17].
It is clear from Table II that, GA-DCA produced higher overall classification accuracy on eight out of the ten utilsied
benchmark datasets while PSO-DCA performed better only on two datasets. Likewise, GA-DCA led overall higher sensitivity performances on seven datasets, better than PSO-DCA which performed better only on three datasets. The highest and lowest sensitivity produced by the GA-DCA are 99.18% on the Heart Statlog datset (STAT), and 95.18% on the Blood Transfusion dataset (BTSC), respectively, while the PSO-DCA produced highest and lowest sensitivity of 100.0% on Blood Transfusion Service Centre (BTSC) and 84.37% on Liver Disorders (LD), respectively. Although the performances of PSO-DCA regarding specificity for majority of the datasets are comparable to those of the GA-PSO, GA-DCA outperformed the PSO-DCA on four datasets and produced similar or no significantly different performances on the rest of the datasets. Therefore, the GA-DCA is more preferable in terms of clas-sification accuracy, sensitivity and specificity when compared to PSO-DCA. Furthermore, it is clear that GA is applicable for optimising the parameters of the DCA with effective classification performances.
Both GA-DCA and PSO-DCA methods are applicable to datasets with larger number of samples with good classifi-cation performances. PSO-DCA produced a superior perfor-mance on UNSW NB15 dataset while GA-DCA outperformed the PSO-DCA on the KDD99 dataset based on the three metrics. As an example, the validation process of the testing accuracy for the Liver Disorders (LD) dataset over 100 itera-tions under GA-DCA and PSO-DCA is illustrated in Figure 2. Notice that, up to iteration 58, both GA-DCA and PSO-DCA had reached the similar accuracy of about 92.0%; however, GA-DCA subsequently managed to jump to an approximate high accuracy of 98.55% from about iteration 80, whilst PSO-DCA stagnated and converged with the optimal accuracy of 92.31%.
Figure 2: LD dataset validation over 100 iterations
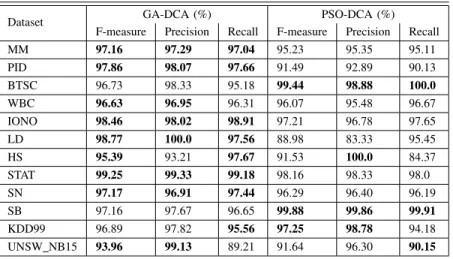
2) Performance on F-measure, precision and recall: The performances on F-measure, precision and recall for GA-DCA and PSO-DCA for all datasets are summarised in Table III with the best performances shown in bold font.
Table II: Accuracy, Sensitivity and Specificity
Dataset GA-DCA (%) PSO-DCA (%)
Accuracy Sensitivity Specificity Accuracy Sensitivity Specificity MM 97.09 97.04 94.57 95.11 95.11 92.05 PID 98.05 97.66 98.0 91.54 90.13 88.4 BTSC 97.46 95.18 96.67 99.73 100.0 99.65 WBC 96.83 96.31 97.40 96.35 96.67 92.21 IONO 98.02 98.91 100.0 97.44 97.65 99.11 LD 98.55 97.56 100.0 92.31 95.45 100.0 HS 96.41 97.67 100.0 95.10 84.37 100.0 STAT 99.26 99.18 100.0 98.15 98.0 100.0 SN 97.12 97.44 93.81 96.15 96.19 100.0 SB 97.17 96.65 95.34 99.89 99.91 100.0 KDD99 95.33 93.18 98.30 96.65 94.40 98.80 UNSW NB15 92.56 90.48 94.30 89.34 88.0 94.50 Table III: F-measure, Precision and Recall
Dataset GA-DCA (%) PSO-DCA (%) F-measure Precision Recall F-measure Precision Recall MM 97.16 97.29 97.04 95.23 95.35 95.11 PID 97.86 98.07 97.66 91.49 92.89 90.13 BTSC 96.73 98.33 95.18 99.44 98.88 100.0 WBC 96.63 96.95 96.31 96.07 95.48 96.67 IONO 98.46 98.02 98.91 97.21 96.78 97.65 LD 98.77 100.0 97.56 88.98 83.33 95.45 HS 95.39 93.21 97.67 91.53 100.0 84.37 STAT 99.25 99.33 99.18 98.16 98.33 98.0 SN 97.17 96.91 97.44 96.29 96.40 96.19 SB 97.16 97.67 96.65 99.88 99.86 99.91 KDD99 96.89 97.82 95.56 97.25 98.78 94.18 UNSW NB15 93.96 99.13 89.21 91.64 96.30 90.15 PSO-DCA based on the F-measure on eight out of ten utilised
datasets except for two datasets namely BTSC and Spambase. The highest and lowest F-measure led by the GA-DCA are 99.26% on the Heart Statlog dataset (STAT), and 95.39% on the Haberman’s Survival dataset (HS) respectively; the highest and lowest F-measure led by the PSO-DCA are 99.88% on BTSC, and 88.98% on Liver Disorders (LD), respectively. Similarly, the performances of the GA-DCA on precision and recall for seven datasets were better than that of the PSO-DCA. Therefore, from these results on F-measure, precision and recall, the GA-DCA is notably a better choice than PSO-DCA for parameters optimisation of the DCA when applied to bi-nary classification datasets which are significantly imbalanced. Whilst the PSO-DCA has produced better performance than GA-DCA on UNSW NB15 dataset, GA-DCA outperformed the PSO-DCA on the KDD99 dataset.
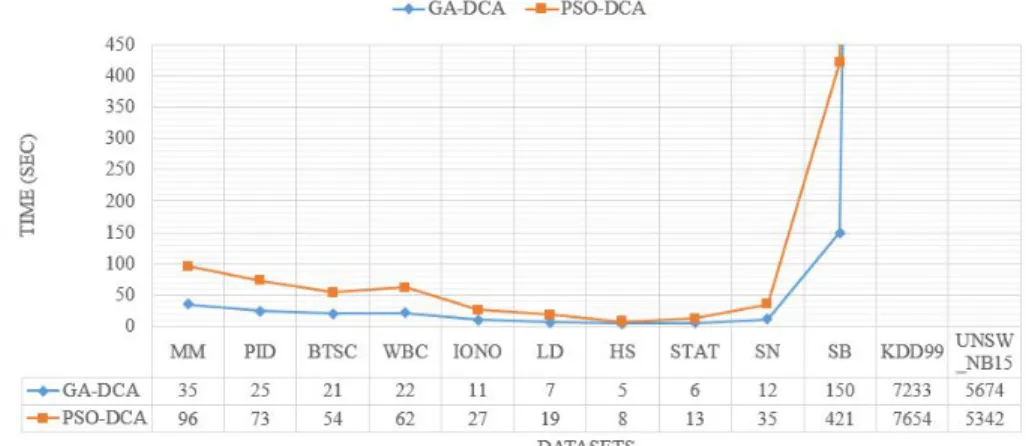
3) Performance on computational time: The training time consumed by GA and PSO to generate the optimal set of parameters of the DCA is shown in Figure 3. For fair compar-ison, both approaches were allowed to run over 100 number of iterations, with 20 individuals/particles per iteration. Clearly, it can be noticed that GA converged faster than PSO-DCA for
all datasets. This further signifies that the GA is more effective for parameters optimisation for the DCA. The higher time consumption observed on PSO can be explained by the fact that, it has to evaluate all particles in every iteration and move them towards the best regions in the search space and there are many particles, but GA only needs to select two parents for reproduction in each iteration. Additionally, the size of the dataset has a significant impact on the computational performances of both DCA and PSO-DCA, although, GA-DCA is generally less affected.
V. CONCLUSION
This study compared the performances of GA and PSO on parameters optimisation for the DCA in order to discover an efficient method to support DCA during its context detection phase. GA-DCA and PSO-DCA methods were evaluated using twelve publicly available binary classification datasets in the UCI machine learning repository. The performance results based on accuracy, sensitivity, F-measure and precision indi-cate that, DCA parameters optimisation by using GA produced better results compared to PSO. The PSO is more affected by stagnation and converge to local optimal solution compared to
Figure 3: Performance comparison on the training time in seconds
GA when used to train the DCA, as evidenced by the lower accuracy led by the PSO-DCA. Additionally, the relatively bet-ter F-measure result generated by GA-DCA shows its power in dealing with imbalance datasets. Time-wise, GA takes less training time than PSO to optimise the DCA, or in other words, the GA-DCA is less sensitive to the size of the dataset compared to PSO. The possible future work would further compare the performance of GA with other metaheuristic optimisation algorithms such as simulated annealing, artificial bee colony optimization, ant colony optimisation, to fully investigate the potential of optimisation algorithms for DCA enhancement.
REFERENCES
[1] Dipankar Dasgupta, Senhua Yu, and Fernando Nino. Recent advances in artificial immune systems: models and applications. Applied Soft Computing, 11(2):1574–1587, 2011.
[2] Wenjian Luo, Ran Liu, Hao Jiang, Dongdong Zhao, and Linli Wu. Three branches of negative representation of information: A survey.
IEEE Transactions on Emerging Topics in Computational Intelligence, 2(6):411–425, 2018.
[3] Julie Greensmith, Uwe Aickelin, and Jamie Twycross. Articulation and clarification of the dendritic cell algorithm. InInternational Conference on Artificial Immune Systems, pages 404–417. Springer, 2006. [4] David D Chaplin. Overview of the immune response.Journal of Allergy
and Clinical Immunology, 125(2):S3–S23, 2010.
[5] Zeineb Chelly and Zied Elouedi. A survey of the dendritic cell algorithm.
Knowledge and Information Systems, 48(3):505–535, 2016.
[6] Julie Greensmith, Uwe Aickelin, and Steve Cayzer. Introducing dendritic cells as a novel immune-inspired algorithm for anomaly detection. In
International Conference on Artificial Immune Systems, pages 153–167. Springer, 2005.
[7] Noe Elisa, Longzhi Yang, and Nitin Naik. Dendritic cell algorithm with optimised parameters using genetic algorithm. In2018 IEEE Congress on Evolutionary Computation (CEC), pages 1–8. IEEE, 2018. [8] Jui-Fang Chang and Ying-Jye Lee. Performance comparison between
genetic algorithm and particle swarm optimization based on back propagation network in forecasting exchange rate.Journal of Statistics and Management Systems, 13(4):805–821, 2010.
[9] Ahmed AA Esmin, Rodrigo A Coelho, and Stan Matwin. A review on particle swarm optimization algorithm and its variants to clustering high-dimensional data.Artificial Intelligence Review, 44(1):23–45, 2015. [10] Noe Elisa, Fei Chao, and Longzhi Yang. A study of the necessity of signal categorisation in dendritic cell algorithm. InUK Workshop on Computational Intelligence, pages 210–222. Springer, 2019.
[11] A ASUNCION. Uci machine learning repository. http://www. ics. uci. edu/mlearn/MLRepository. html, 2007.
[12] Polly Matzinger. The danger model: a renewed sense of self. science, 296(5566):301–305, 2002.
[13] Qian Guo, Yanpeng Qu, Ansheng Deng, and Longzhi Yang. A new fuzzy-rough feature selection algorithm for mammographic risk analy-sis. In2016 12th International Conference on Natural Computation, Fuzzy Systems and Knowledge Discovery (ICNC-FSKD), pages 934– 939. IEEE, 2016.
[14] Yanpeng Qu, Guanli Yue, Changjing Shang, Longzhi Yang, Reyer Zwiggelaar, and Qiang Shen. Multi-criterion mammographic risk anal-ysis supported with multi-label fuzzy-rough feature selection. Artificial intelligence in medicine, 100:101722, 2019.
[15] Feng Gu. Theoretical and empirical extensions of the dendritic cell algorithm. PhD thesis, University of Nottingham, 2011.
[16] Zeineb Chelly and Zied Elouedi. Rc-dca: A new feature selection and signal categorization technique for the dendritic cell algorithm based on rough set theory. InInternational Conference on Artificial Immune Systems, pages 152–165. Springer, 2012.
[17] Noe Elisa, Longzhi Yang, and Fei Chao. Signal categorisation for dendritic cell algorithm using ga with partial shuffle mutation. In
UK Workshop on Computational Intelligence, pages 529–540. Springer, 2019.
[18] Longzhi Yang, Fei Chao, and Qiang Shen. Generalised adaptive fuzzy rule interpolation.IEEE Transactions on Fuzzy Systems, 25(4):839–853, 2017.
[19] Longzhi Yang and Qiang Shen. Adaptive fuzzy interpolation with prioritized component candidates. InFuzzy Systems (FUZZ), 2011 IEEE International Conference on, pages 428–435. IEEE, 2011.
[20] Longzhi Yang and Qiang Shen. Closed form fuzzy interpolation.Fuzzy Sets and Systems, 225:1–22, 2013.
[21] Hongnian Zang, Shujun Zhang, and Kevin Hapeshi. A review of nature-inspired algorithms. Journal of Bionic Engineering, 7(4):S232–S237, 2010.
[22] Jie Li, Longzhi Yang, Yanpeng Qu, and Graham Sexton. An extended takagi–sugeno–kang inference system (TSK+) with fuzzy interpolation and its rule base generation. Soft Computing, 22(10):3155–3170, 2018. [23] Noe Elisa, Jie Li, Zheming Zuo, and Longzhi Yang. Dendritic cell algorithm with fuzzy inference system for input signal generation. In
UK workshop on computational intelligence, pages 203–214. Springer, 2018.
[24] N. Naik, R. Diao, and Q. Shen. Dynamic fuzzy rule interpolation and its application to intrusion detection.IEEE Transactions on Fuzzy Systems, 26(4):1878–1892, 2018.
[25] Longzhi Yang, Jie Li, Fei Chao, Phil Hackney, and Mark Flanagan. Job shop planning and scheduling for manufacturers with manual operations.
Expert Systems. e12315 10.1111/exsy.12315.
[26] Yudong Zhang, Shuihua Wang, and Genlin Ji. A comprehensive survey on particle swarm optimization algorithm and its applications.
Mathematical Problems in Engineering, 2015, 2015.
[27] KDD Cup 1999 Data. ”http://kdd.ics.uci.edu/databases/kddcup99/ kddcup99.html/. Accessed: 2019-12-16.
[28] Nour Moustafa and Jill Slay. Unsw-nb15: a comprehensive data set for network intrusion detection systems (unsw-nb15 network data set). InMilitary Communications and Information Systems Conference (MilCIS), 2015, pages 1–6. IEEE, 2015.
[29] Ian H Witten, Eibe Frank, Mark A Hall, and Christopher J Pal. Data Mining: Practical machine learning tools and techniques. Morgan Kaufmann, 2016.
View publication stats View publication stats