c
INTERACTION MINING MOBILE APPS
BY
BIPLAB DEKA
DISSERTATION
Submitted in partial fulfillment of the requirements
for the degree of Doctor of Philosophy in Electrical and Computer Engineering in the Graduate College of the
University of Illinois at Urbana-Champaign, 2017
Urbana, Illinois
Doctoral Committee:
Assistant Professor Ranjitha Kumar, Chair Assistant Professor Lav Varshney
Professor Brian Bailey Professor Andrew Singer
ABSTRACT
Millions of mobile apps are used by billions of users every day. Although the design of these apps play an important role in their adoption, the design process still remains complex and time intensive. At the same time, existing apps embody multiple solutions to numerous design problems faced by app developers. How do we make this design knowledge embedded in existing apps accessible to designers? And how can it help simplify the app design process?
This dissertation introduces interaction mining, a technique to capture the designs of mobile apps in a way that supports data-driven design applica-tions. It presents systems that implement interaction mining for Android apps without requiring any access to their source code making it possible to design mine apps at an unprecedented scale. It presents Rico, the largest publicly available mobile app design repository to date. It discusses how such repositories created using interaction mining can be used to train models that enable applications such as keyword and example-based search interactions for mobile screens and user flows. It also presents zero-integration perfor-mance testing (ZIPT), a novel technique for testing app designs. It demon-strates how ZIPT can be used to help designers understand which examples to draw from in the early stages of the app design process and perform com-parative testing at scale with low cost and effort in the later stages of the process.
ACKNOWLEDGMENTS
I would like to thank my advisor, Ranjitha Kumar, for her advice and guid-ance throughout the process of working on this dissertation. She challenged me to reach beyond low-hanging fruit and helped me develop a sense of what problems would be rewarding to solve. In fact, it was her enthusiasm for design that got me thinking about the problems that I explore in this disser-tation. I would also like to thank my committee members Brian Bailey, Lav Varshney, and Andrew Singer for their valuable feedback and suggestions on how to improve and better present my work.
I have been fortunate to have great collaborators. Zifeng (Forrest) Huang, contributed significantly to all the work presented in this dissertation. It was his initial expertise about all things mobile that gave me the confidence to start tinkering with designs of mobile apps. Chad Frazen contributed signif-icantly to Rico and single handedly developed the web interface for ZIPT. A big thank you to both of them. I would like to thank my collaborators and mentors at Google: Jeff Nichols, Yang Li, and Dan Afergan for their support and guidance throughout the Rico and ZIPT projects.
I am also grateful for other mentors I have had in graduate school. I would like to thank Rakesh Kumar for the things he taught me about research in the process of writing my first several papers in grad school, Jerry Talton for all the valuable feedback he has given me on my work, and Brian Lilly for his positive encouragement and for always being there when I needed advice on anything outside research.
I would also like to thank the several undergraduate and masters students in the data-driven design group who have worked with me and have con-tributed in ways big and small to my work. Thank you to Kedan Li, Jinda Han, Devin Ho, Sujay Khandekar, Abhishek Harish, Thomas Liu, Krishna Dusad, and Erik Luo.
my brother Angshuman. Finally, I thank my wife Mary for her immense support and patience as I dealt with the ups and downs in my research over the last several years.
TABLE OF CONTENTS
LIST OF TABLES . . . viii
LIST OF FIGURES . . . ix
CHAPTER 1 INTRODUCTION . . . 1
1.1 Challenges in the Current App Design Process . . . 2
1.2 Designing with Data-Driven Tools . . . 3
1.2.1 Food Logging in a Diabetes App . . . 3
1.2.2 Playlist Interactions in a Music App . . . 4
1.3 Contributions . . . 5
1.4 Overview . . . 7
1.5 Statement on Prior Publications . . . 7
CHAPTER 2 BACKGROUND AND RELATED WORK . . . 9
2.1 Mobile Apps . . . 9
2.1.1 The Mobile App Design Process . . . 9
2.1.2 Design Components of a Mobile App . . . 10
2.1.3 The Structure of a Mobile App . . . 11
2.2 Design Mining . . . 12
2.3 Data Mining Mobile Apps . . . 13
2.3.1 Mining Play Store Metadata . . . 13
2.3.2 Mining App Packages . . . 14
CHAPTER 3 INTERACTION MINING MOBILE APPS . . . 16
3.1 Goals for Interaction Mining . . . 16
3.2 ERICA: Interaction Mining for Android Apps . . . 17
3.2.1 Design Choices . . . 17
3.2.2 Implementation . . . 19
3.2.3 Data Collection . . . 23
3.3 Rico: Scaling Interaction Mining . . . 23
3.3.1 Crowdsourced Exploration of Apps . . . 25
3.3.2 Automated Exploration of Apps . . . 28
3.3.3 Benefits of Hybrid App Approach . . . 28
3.3.4 Data Collection . . . 30
CHAPTER 4 REPRESENTATIONS AND MODELS OF
MOBILE APP DESIGN . . . 33
4.1 App Design Representations . . . 33
4.1.1 Interaction Trace . . . 33
4.1.2 Interaction Graph . . . 35
4.2 The Rico App Design Dataset . . . 37
4.2.1 Rico Dataset Contents . . . 37
4.3 Identifying Unique UI Designs . . . 38
4.4 Modeling UI Similarity . . . 40
4.5 Discussion and Future Work . . . 41
CHAPTER 5 DESIGN SEARCH . . . 43
5.1 Finding App Design Examples in Practice . . . 43
5.2 Flow Search . . . 45
5.2.1 Identifying User Flows . . . 45
5.2.2 Flow Search Interface . . . 50
5.3 Example-Based UI Search . . . 50
5.4 Discussion and Future Work . . . 52
CHAPTER 6 ZERO-INTEGRATION PERFORMANCE TESTING . . . 54
6.1 Background . . . 54
6.2 Formative Study . . . 55
6.3 The ZIPT Platform . . . 56
6.3.1 Test Creation . . . 58
6.3.2 Visualizations and Metrics . . . 58
6.3.3 Implementation . . . 60
6.4 Case Studies in Using ZIPT . . . 61
6.4.1 Identifying Usability Issues . . . 61
6.4.2 Analyzing Comparative Performance . . . 64
6.5 Evaluation . . . 72
6.5.1 Potential Uses Cases . . . 73
6.5.2 Perceived Benefits . . . 74
6.5.3 Generated Design Insights . . . 74
6.6 Discussion and Future Work . . . 75
CHAPTER 7 CONCLUSION . . . 77
7.1 Future Directions . . . 78
7.1.1 Scaling Up Interaction Mining . . . 78
7.1.2 Interaction Mining in Other Interactive Domains . . . 79
7.1.3 Unified Design Exploration Platform . . . 79
7.1.4 Testbed for Studying Factors that Affect Usability . . . 79
7.1.5 Additional Data-Driven Mobile App Design Applications . . . 80
7.1.7 Non-Professional Use Cases . . . 83 REFERENCES . . . 84
LIST OF TABLES
3.1 The Android apps used in our evaluation of coverage
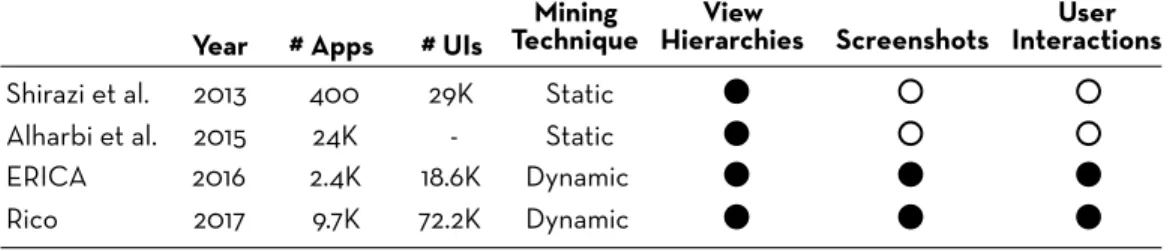
ben-efits of hybrid exploration . . . 29 4.1 Comparison of the Rico dataset with other app design datasets 36 6.1 Participant feedback about the overall usefulness of ZIPT
and its features. . . 73 7.1 The five classes of design applications that the Rico dataset
supports, correlated with the parts of the dataset intended
LIST OF FIGURES
3.1 ERICA’s architecture . . . 20
3.2 ERICA’s data collection infrastructure . . . 21
3.3 Coverage of human app exploration for three popular An-droid apps . . . 24
3.4 Automated crawlers are often stymied by UIs that require complex interaction sequences, such as the three shown here. . 25
3.5 Rico’s crowdsourcing web interface . . . 27
3.6 The performance of our hybrid exploration system com-pared to human and automated exploration alone, mea-sured across ten diverse Android apps . . . 29
3.7 Summary statistics of the Rico dataset . . . 31
4.1 Visual representation of an interaction trace . . . 34
4.2 Visual representation of an interaction graph . . . 35
4.3 Rico dataset contents . . . 37
4.4 Example UI screens that have the same design but different content . . . 39
4.5 Overall approach for example-based searching . . . 40
4.6 Procedure for training an autoencoder to learn UI layout similarity . . . 41
5.1 Example login flows in two online app design repositories . . . 44
5.2 Overall approach for detecting user flow examples in user interaction traces . . . 47
5.3 User flow examples detected using element-based detectors . . 48
5.4 User flow examples detected using layout-based detectors . . . 49
5.5 Search interface for finding and visualizing example flows found in the ERICA dataset . . . 51
5.6 Results from examples-based querying of the Rico dataset . . 53
6.1 An overview of ZIPT’s workflows . . . 57
6.2 Usability issue with the search bar in a transit app . . . 62
6.3 Usability issue in adding items to a list in a food logging app . 63 6.4 Usability issue with the scoped searching in the Foursquare app . . . 65
6.5 Usability issue with the visual search icon in Pinterest . . . 66 6.6 User flows for the store locator features in the Macy’s and
Best Buy apps . . . 67 6.7 Comparative evaluation of the store locator features in
Macy’s vs Best Buy . . . 68 6.8 Comparative evaluation of adding events in two
calendar-ing apps . . . 70 6.9 Comparative evaluation of adding songs to a new playlist
in Spotify vs YouTube Music . . . 71 7.1 Common locations of seven popular mobile UI elements . . . . 81 7.2 Generating Android UI source code from captured UI data . . 82
CHAPTER 1
INTRODUCTION
In today’s crowded app marketplaces, good design can be a key differen-tiator for apps [1], impacting their adoption and ultimately their success. App design, however, remains a complex process comprising multiple design activities: researchers, designers, and developers must all work together to identify user needs, create user flows (user experience design), determine the proper layout of user interface (UI) elements (UI design), and define their visual (visual design) and interactive (interaction design) properties [2]. To create durable and engaging applications, app builders must consider hun-dreds of solutions from a vast space of design possibilities, prototype the most promising ones, and evaluate their effectiveness heuristically and through user testing.
To aid designers in navigating such complex design processes, several recent works have proposed leveraging data-driven design tools in domains such as web design, fashion design, 3D modeling and graphic design. Such tools can assist designers throughout the different stages of the design process – helping them search for examples for design inspiration [3, 4], understand successful patterns and trends [3, 5], generate new designs [6, 7], and evaluate design alternatives [8].
Such data-driven design tools, however, remain largely unavailable to mo-bile app designers. This is primarily because of the lack of suitable design datasets to power such tools. While open design repositories (such as Thin-giverse [9] for 3D models) exist for some domains, no such large-scale design repository exists for mobile apps. Similarly, while designs for webpages can be programmatically mined at scale [3], mobile app designs remain siloed in closed-sourced apps, making them hard to access. Without scalable meth-ods to capture and suitably expose the designs of existing apps, the design knowledge embodied in them remains unutilized – an unfortunate situation given the many challenges in the app design process such data could help
overcome.
This dissertation develops a technique, interaction mining, that allows cap-turing and exposing the designs contained in existing apps. It involves using people to understand and interact with UIs, and machines to capture design and interaction data seamlessly in the background. It demonstrates how interaction mining can be implemented at scale to mine design repositories using thousands of existing Android apps and how such repositories can sup-port training machine-learning models that enable novel design interactions.
1.1
Challenges in the Current App Design Process
Early on in the design process, designers generate ideas on possible solutions to a design problem. They often look at relevant examples from existing apps. These examples serve as sources of inspiration and help understand the landscape of possible solutions [10, 11]. For instance, a designer working on a search interaction for a news app might want to broadly understand the different ways search is implemented in news apps or even other types of apps. However, there is no efficient way to find such examples at present. The designer would either depend on their memory and try to recollect search interactions that they have seen in the past or they would ask a colleague. However, there are only so many examples that a person can commit to mem-ory and retrieve at will. Even if they ended up getting a few good example suggestions, they would have to manually download the apps, interact with them and capture some of their screens. Only then would they be able to bring these examples into the design process. This is time consuming and laborious.
Another complication that arises is that even if a designer is able to find relevant examples, there is no easy way to understand how these examples perform under different scenarios or how they compare with one another. Perhaps the designer sees a scoped search interaction [12] in a popular app and decides to use that but might not realize that such an interaction works well only if the search scope is very clearly communicated to a user (an example app that violates this principle is shown in Figure 6.4). Usability tests could help understand such nuances, but running them takes a lot of time and effort, making them unattractive for testing examples. Thus,
early on, decisions about which examples to draw from are made based on guesswork and intuition. This is unfortunate given that the decisions being made at this stage are generally large in scope and mistakes made in these stages are harder to rectify in later stages.
1.2
Designing with Data-Driven Tools
This dissertation demonstrates the possibility of a future where data-driven design tools help overcome challenges in the design process. It demonstrates two such tools that leverage the data that interaction mining produces. The first is a design search engine that designers can use to find examples. It indexes designs from a large number of existing apps and allows keyword-based and example-keyword-based queries over them. Designers can visualize the different design components of the returned results, such as user flows, UIs, and animations.
The second application is zero-integration performance testing (ZIPT), a novel approach to performance testing app designs. It enables designers to understand the performance characteristics of different examples that they might be considering. It also can be used for comparative testing of one’s apps against those of others with significantly lower cost and effort than existing testing methods. Below we present two example of how these tools can help designers learn from the designs of others.
1.2.1
Food Logging in a Diabetes App
Suppose Jane is prototyping a food logging flow for a diabetes management app and wants to understand the space of possible designs. First, Jane must find a set of relevant apps to analyze. Using the search engine, Jane searches for“diabetes” and finds a number of existing diabetes management apps such as mySugr and Diabetes:M. Since the search interface also allows her to run queries with semantic keywords that describe the tasks supported by an app, Jane also searches for “food logging” and finds food journaling apps such as
Lose It! andMyPlate which also contain food logging flows. Thus designers can find apps in distal categories that contain relevant design features.
diabetes management and food journaling apps to measure user performance on their food logging flows. She defines a scripted usability test, where she instructs crowd workers to log the last meal they ate using the app they are assigned from the comparison set. Additionally, she specifies a set of open-ended survey questions to elicit feedback around the task experience.
After defining the tests, Jane deploys them on ZIPT. It recruits crowd workers from Amazon Mechanical Turk and allows them to complete the tasks on the different apps. As the crowd workers perform their chosen tasks, the platform captures design and interaction data streams in the background, and processes them into a multi-modal representation of user traces.
Once the tests are complete, Jane can review aggregate metrics and visu-alizations over the collected user traces, as well as the collated qualitative feedback. The performance results reveal that the meal logging flows found in the food journaling apps have statistically higher completion rates than those in diabetes management apps. Jane uses the platform’s interactive flow visualization to quickly identify and inspect interaction traces where users could not finish the task. Jane finds that many of these users had a hard time initiating the food logging flow in the diabetes apps, and notices that these medically oriented apps have information dense UIs. In contrast, Jane observes that the meal logging UIs in the food journaling apps are more min-imal, although the flows themselves involve more steps. Based on this data, Jane decides to start her design process with a food logging flow that has simple UIs modeled after the ones in the food journaling apps.
1.2.2
Playlist Interactions in a Music App
Suppose Susan is designing the functionality to add songs to a playlist in a music app. She searches for a “Add to playlist” flows in the search engine and reviews how users can do so in popular apps such asYouTube Music and
Spotify. She notices thatSpotify allows users to add a song to a new playlist in two ways. Users can “add to playlist” on a song and then specify that it is going to be part of a new playlist. Alternatively, they can “create new playlist” from a screen for managing playlists, and then navigate to a song and add it. YouTube Music, she notices, does not support the second use case.
She guesses that perhaps the second use case is not something that many users use. Although in the past she would have gone ahead with YouTube Music’s simpler design, she decides to run a quick test on ZIPT to see if this assumption is correct. She scripts a test where she asks users to add two songs to a new playlist and collects data from 50 users for both Spotify and
YouTube Music.
She discovers from the aggregate data that YouTube Music has a 80% completion rate versus 94% for that of Spotify. On inspecting the qualitative feedback, she discovers that several users on YouTube Music were confused by being unable to create empty playlists. One individual trace revealed that a crowd worker even used the help functionality of the app to learn how to create playlists. Based on this data, Susan decides to go the Spotify route and support both ways of adding songs to a new playlist.
1.3
Contributions
This dissertation advances knowledge of how to capture designs in an interac-tive domain and what applications such design data can enable. Specifically, it makes the following contributions:
• Design mining for interactive domains. Design mining in prior work has remained confined to non-interactive designs domains such as graphic designs, 3D models, or webpages (treated as static designs). This dissertation develops an approach,interaction mining, that brings design mining to an interactive domain – mobile apps – where designs change with user interactions. It demonstrates that by capturing and combining three types of data – a visual representation of the UI state, a structural representation of the UI state, and user interactions – it is possible to capture, analyze, and visualize the design of mobile apps. • An architecture for scalable interaction mining. This
disser-tation presents a web-based architecture for implementing interaction mining that promotes scalability in two ways. First, it requires no modification to an app’s source code, which makes it possible to mine any Android app. Second, using a web-based app usage model enables crowdsourcing human exploration of apps over the Internet, making it
possible to mine a large number of apps. Using this architecture, we collected and released a dataset that contains app designs from over 9700 Android apps, making it the largest dataset of its kind.
• Hybrid app exploration for higher coverage. Prior work has used either human or automated approaches for interacting with app UIs to explore their different states. This dissertation discusses the limitations of these two approaches and demonstrates that higher coverage of app states is possible by combining the two approaches.
• Automated identification of semantic user flows. Although user flow examples play an important role in the app design process, existing repositories of user flows do not scale because of manual curation. This dissertation develops a machine-learning-based approach that identifies user flow examples in interaction traces, and uses it to develop the larges user flow search engine that constains over 3000 examples of user flows in Android apps.
• Example-based searching for mobile UIs. This dissertation presents an unsupervised approach for training a deep-learning model to cap-ture similarity between mobile UI layouts. This enables example-based search interactions over UI datasets.
• Performance testing of examples. This dissertation brings design testing earlier into the design process. The zero-integration perfor-mance testing approach presented here enables designers to run tests on examples of interest in the ideation phase. This is in contrast to the current practice of testing for the first time after having invested the time and effort in building prototypes.
• Comparative testing with low cost and effort. Zero-integration performance testing can also be used in the later stages of the design process to compare the performance of designs in one’s apps to those in others. Used in this manner, it allows comparative testing at a signifi-cantly lower cost and effort compared to techniques that are currently available. For example, it costs 100×less than using a video-based re-mote usability testing platform such ashttp://www.usertesting.com.
1.4
Overview
This dissertation is divided into seven chapters, setting out the origins of design mining in the literature, motivating the development of platforms for interaction mining mobile apps, describing two applications that interac-tion mining enables, and sketching a future for how data-driven design tools enabled by interaction mining can transform the creative design process of mobile app design.
Chapter 2 provides an overview of the history of design mining in other do-mains, describes the technologies and components that constitute the design of a mobile app, presents the different use cases and techniques for mining mobile apps, and discusses the challenges in holistically capturing the design
of a mobile app.
Chapter 3 introduces interaction mining as a technique for capturing the design of mobile apps and discusses its design goals. It presents the de-sign choices and implementation details of two interaction mining systems, ERICA1 and Rico, developed for mining Android apps.
Chapter 4 describes two representations of mobile app designs that are captured by our interaction mining systems and describes how these repre-sentations can be used to train models that enable real-time design interac-tions. It also presents the details of the Rico mobile app design dataset that we publicly released.
The next two chapters introduce applications built using interaction min-ing data. Chapter 5 presents search engines for mobile app designs that sup-port keyword- and example-based search interactions. Chapter 6 presents the motivation and design rationale behind our system for zero-integration performance testing, ZIPT, and describes how it enables designers to learn from designs in the vast array of existing apps.
Finally, Chapter 7 sketches directions for future work.
1.5
Statement on Prior Publications
Materials presented in this dissertation have also appeared in three prior con-ference publications. The technique of interaction mining and the flow search 1ERICA is an acronym forEnablingRealtimeInteractionCapture forAndroid apps.
interface was published at the ACM User Interface Software and Technology (UIST) Conference in 2016 [13]. The work on scaling interaction mining, the Rico dataset, and our approach to example-based searching over UIs was published at UIST 2017 [14]. ZIPT was also published at UIST 2017 [15].
CHAPTER 2
BACKGROUND AND RELATED WORK
This chapter provides a broad overview of the technologies related to the design and implementation of mobile apps. It also presents a survey of prior work in design mining, summarizes prior work in mining mobile apps, and discusses the challenges in capturing the design of mobile apps.
2.1
Mobile Apps
Mobile apps are self-contained applications that run on devices equipped with a mobile operating system such as iOS [16] or Android [17]. Consumers can generally download apps to their devices from online app stores for their platforms. In recent years, apps have seen increasing popularity with con-sumers. Millions of apps are available in app stores for iOS and Android with over 90 billion app downloads and nearly 900 billion hours of app usage in 2016 alone [18].
2.1.1
The Mobile App Design Process
Given the sheer number of apps available today, it is very common for mul-tiple apps to exist that help users accomplish the same task. This has made it challenging for apps to stand out amongst other similar apps. Increasingly the user experience afforded by app has become a key criterion for their adoption and ultimately their success [1].
Designing compelling user experiences for mobile apps, however, still re-mains a complicated, time-consuming process. Popular apps are often de-signed by teams of multiple professionals including designers, user experience (UX) researchers, and engineers. The process generally starts with a design goal such as the addition of a new feature. From there on, app creation
hap-pens in four stages. In the first stage, designers generate ideas on potential solutions to the design problem. At this stage, they often look for examples of similar features in other apps for design inspiration. Often the generated ideas are combined, remixed, and iterated upon as well.
A few of the ideas generated in the ideation phase are prototyped. For mobile apps, this could involve low-fidelity prototypes such as paper proto-types or high-fidelity interactive, digital protoproto-types built using tools such as Invision [19], Origami [20], or Pixate [21]. To understand their effectiveness, these prototypes are tested using various methods such as heuristic evalua-tion [22], usability testing, or performance testing.
Once a design has been chosen based on the test results for prototypes, it enters the implementation stage where developers get involved. They help translate the design mock-ups to actual code and realize the vision of the de-signers for the app. Once implemented, the feature might go through another round of usability and performance testing to ensure that it is effective in an end-to-end usage scenario. This is important since many components of an app cannot be tested with a prototype. For example, although a particular search results page might seem to work as well as a prototype, on using it with real data a designer might discover that the screen space allocated for each result is not large enough. Or they might discover that the usability is poor, not because of a poor UI, but because the search backend returns results with unacceptable delays.
Once such implementation kinks are worked out and the feature has been sufficiently tested, it is released to end users. At this stage, app creators often collect usage metrics to monitor if the feature works for users as expected. If they have enough users, they also employ A/B testing techniques to test design variations and further refine the feature.
2.1.2
Design Components of a Mobile App
Throughout the design process outlined in the previous section, designers develop multiple components of an app’s design including user flows, user interfaces (UIs), visual details, and interaction details [2]. Different designers usually specialize in designing one or a few of these components. First, for each task an app supports, UX designers perform user research and try to
understand the logical steps to accomplish the task. This is captured as a
user flow – a sequence of UI screens and corresponding user actions that let users perform that task. An example user flow could be for onboarding a new user in a finance app by helping connect all of their bank accounts to the app.
Once the UX designer has laid out the paths that they intend users to take in an app, UI designers then design the individual UI screens of the app. For each UI, they determine the elements to be included and their overall layout. They are also responsible for ensuring that the UIs visually communicate the right paths and that a consistent design language is applied across all UIs.
Once UIs have been developed, visual designers (also referred to as graphic designers) decide the visual details of the UIs and their elements. This in-cludes deciding things like color palettes and typography. They often also create the final pixel-perfect assets (such as icons) to be used in implementing the app.
Finally, motion designers create the dynamic interactions in an app. This could include designing how UI elements animate in response to user in-teractions or how entire screens transition from one to another. Common examples of animations include menus sliding out or spinner icons when a UI is waiting for data.
2.1.3
The Structure of a Mobile App
Most mobile apps are distributed as closed-sourced packages. This is true for the two most popular mobile app platforms: iOS and Android. The implementations developed in this dissertation focus on the Android platform because of the extensive use it has seen in the research community due to its open-source nature.
Android apps are written using languages such as Java, C++, and Kotlin [23]. The code is complied using the Android SDK (sowtware development kit) tools along with any data and resource files into an APK (Android package), which is an archive file. A single APK file contains all the contents of an Android app and is the file that users download from app marketplaces (such as the Google Play Store) and install on their devices.
services, content providers, and broadcast receivers [23]. Activities are used to build app UIs, whereas services run in the background without any as-sociated UIs. Content providers interface with app data sources (such as a database) and broadcast receivers are used to respond to system-wide broad-cast messages (such as notifications). Of these components, users interact directly with only the activities. Apps typically have multiple activities with a few “main” activities that are ones in which an app can be started. An activity can start other activities as well. This process often involves passing asynchronous messages called intents which contain any necessary data.
An activity’s user interface is composed of UI elements or views. Views can respond to user inputs and are organized in a hierarchy called the view hierarchy. Developers can declare the layout of these user interfaces using human readable XML layout files that get included in the APK. In addition, the layouts can also be defined in the code, allowing for programmatically construction of UIs at runtime. The APK also includes important metadata about an app in the “manifest” file. It specifies all the resources in an app, including the name of its activities, and, in particular, defines its main activities. It is relatively straightforward to unpack an APK file and inspect the manifest as well as the XML layout files using open source tools [24]. As a result, this is what researchers generally do when they want to mine some of the static design data present in public Android apps.
2.2
Design Mining
Design mining, as proposed by Kumar et al. [3], refers to mining the de-sign details of artifacts in a domain such that traditional data-mining and knowledge-discovery techniques can be readily used on that data. They demonstrated design mining for webpages using a platform, Webzeitgeist, that captured and combined the visual (screenshots) and structural repre-sentations (document object model or DOM trees [25]) of webpages. The resultant data enabled them to answer questions about design demograph-ics, automate design curation, and build data-driven design tools, such as tools for example-based retrieval of designs.
This notion of using automated knowledge-discovery techniques on the mined data is what makes design mining different from traditional ways of
collecting and curating designs. Graphic designs, for instance, are collected and curated by designers in the form of images. While images are useful for visualizing the designs and even testing for their effectiveness with user studies [8], analyzing designs with automated techniques using just images is hard. As a result, for design webpage designs, Kumar et al. advocated capturing not just screenshots but also their DOM trees. Processing these two data streams together allowed Webzeitgeist to easily surface relevant design data (such as popular colors or layouts) to the data-driven design applications that it supported.
This dissertation extends this line of research to mobile apps. Design min-ing mobile apps, however, presents a new challenge. Unlike artifacts in other design domains, such as graphic designs, infographics, 3D models, or even webpages (as explored by Kumar et al.) that are static (do not change over time), app designs contain dynamic components such as user flows and ani-mations. These dynamic components are central to the design of an app, but capturing them is hard since they only manifest themselves during runtime when a user interacts with an app. The technique of interaction mining that we present in the next chapter, answers the question: How can we capture dynamic designs such as those of mobile apps?
2.3
Data Mining Mobile Apps
In this section we discuss prior works from multiple domains on extracting useful knowledge from mobile apps. These works primarily mine information from two sources: the app stores (such as the Google Play Store) and the mobile app packages (such as the Android APK files).
2.3.1
Mining Play Store Metadata
The Google Play Store contains a wealth of information about any app. An app’s webpage includes metadata about the popularity of the app (such as the number of downloads), feedback from users in the form of 5-star ratings and text reviews, a category label, screenshots of a few UIs from the app, and often times a textual description of the features found in the app. As a result, researchers have mined data from the Google Play Store by crawling
its web pages for a variety of studies.
A common use of play store metadata is as a proxy for the quality of apps. An app’s quality is judged by users based on a variety of factors (such as animations [26], menus [27], and visual diversity and consistency between different screens [28, 29]) and hence cannot be as easily collected as say for graphic designs. Thus using Play Store metrics as a proxy for app quality be-comes attractive. Many studies have used the number of downloads, average rating, or the number of ratings for an app as a proxy for the quality of an app [29, 30, 31]. Sometimes multiple metrics are also combined to overcome biases associated with using just one of them [30]. Another unique feature of app stores as compared to traditional software deployment mechanisms is the presence of the large amount of user feedback. Several studies have investigated the nature of this feedback [32, 33, 34, 35, 36]. Finally, app store metadata has also been used to study app development and release practices such as frequency of updates [37] or the dialogue between app creators and consumers [38, 39].
2.3.2
Mining App Packages
Several prior works have mined app packages (such as APK files for An-droid apps) for design data. They follow one of two approaches – static or dynamic. A static approach involves unpacking the package file using open-source tools [24] and inspecting static XML files that describe the lay-outs of different UIs. This approach has been used to study design pattern changes over time [40], identify frequently-used UI components [41], study the complexity of app UIs [30], and understand characteristics of highly rated apps [42]. The main limitation of this approach is that it can only capture UI information that has been specified declaratively and misses UIs that are specified programmatically at runtime. In addition, since this approach does not run an app, it cannot capture components of an app’s design that are dynamic, such as user flows or animations.
Dynamic approaches for mining mobile apps, conversely, capture data at runtime. For instance, Li et al. [43] used this approach to capture UI in-formation of Android apps at runtime and leveraged the text data found in the UI layouts to enable text-based searching for Android components.
Dy-namic mining methods can be difficult to implement due to the challenges associated with driving an app’s graphical UI to reach new states [44], and hence have found limited usage in design mining apps. They have nonetheless been deployed for testing [45], detecting security vulnerabilities [46, 47], and modeling web applications [48]. The main limitation of these approaches, however, is that they fail to explore app UIs in a manner that mirrors hu-man usage. This makes it difficult to extract meaningful user flows from the captured data — an important component of an app’s design. Interac-tion mining, as developed in this dissertaInterac-tion, overcomes these limitaInterac-tions by seamlessly incorporating humans into the app mining process, which allows them to drive the graphical UI and demonstrate meaningful flows.
CHAPTER 3
INTERACTION MINING MOBILE APPS
Data-driven tools can help designers in the complex app design process. Building such tools for mobile app design requires a way to capture the design of apps. This chapter introduces interaction mining for mobile apps. Inter-action mining captures and analyzes both static (UI layouts, visual details) and dynamic (user flows, motion details) components of an application’s de-sign. Mined at scale, the data produced by interaction mining enables tools that scaffold the app design process: finding examples for design inspira-tion, understanding successful patterns and trends, generating new designs, and evaluating alternatives. This chapter also presents the architecture and design details of systems for large-scale interaction mining of Android apps that enabled mining close to 10,000 apps. This large-scale mining enabled creating a design repository with 72,000 unique UIs and 3 million design elements.
3.1
Goals for Interaction Mining
The aim of interaction mining is to build a design repository and a set of data structures to support design tools that scaffold the entire mobile app design process. Accordingly, an interaction mining system must possess the following capabilities:
Capture of multiple design components. An app’s design consists of mul-tiple components: how users move from one UI to another to complete tasks, how UIs are laid out, the visual details of the UIs and their elements, and how each UI responds to user interactions. Supporting data-driven design tools for app design requires capturing each of these components. This cap-ture is challenging because it requires collecting, combining, and correlating multiple types of data, including both visual and structural representations
of UIs and their elements, as well as user interaction details.
Coverage of important UI states.In order for the design data produced by interaction mining to help designers understand the experiences an app af-fords, it must capture UI states that are frequently used by humans. Discov-ering and navigating to each of these states in an automated way is difficult, and requires an understanding of how to interact with different UIs. Ad-ditionally, states must be visited in a natural, semantic order to be able to capture meaningful user flows.
Scalability. The utility of interaction mining hinges on the scale of the corpus it can build. Larger repositories improve both diversity of results in example-based applications as well as the accuracy of machine-learning models trained on the mined data. Mining strategies that require access to an app’s source code or the cooperation of an app’s developer, therefore, are less useful than those that take a black-box approach to working with the millions of extant mobile apps.
3.2
ERICA: Interaction Mining for Android Apps
ERICA is a system that enables interaction mining for Android apps in a black-box manner. It combines the strengths of humans and machines, using humans to drive app interactions and computers to capture design and interaction data.
3.2.1
Design Choices
Dynamic MiningMobile design data can be mined in two ways: statically by unpacking app packages and dynamically by running an app. ERICA uses the dynamic approach since a static approach cannot capture dynamic design components such as user flows and motion details.
Human-Powered Exploration
To generate meaningful interactions for different UIs, ERICA leverages hu-mans to interact with an app while it captures their interactions and the resultant UIs. This is in contrast to using an automated agent to interact with the UI elements programmatically (used for example in DynoDroid [45]). ERICA employs a human-powered approach instead of an automated one for several reasons.
First, human interactions are more likely to produce realistic user flows. The space of possible interaction sequences in apps is large, and only a small fraction of such sequences represent semantically-meaningful flows. It is challenging for automated methods to discern these semantically-meaningful flows. Humans, on the other hand, naturally use apps to perform meaningful tasks, and hence data mined during human usage often contain meaningful user flows.
Second, many apps require user input (e.g., usernames, passwords, queries, content, etc.) before meaningful interaction can occur. Automatically creat-ing valid user data across a large number of apps is a challengcreat-ing problem. In addition, many apps need to be populated with user-generated data be-fore they their UIs reflect the full set of possible interactions and features. For example, many screens in theEvernote app (useful for note-taking) have limited interactions until a user creates folders and some notes. With an au-tomated approach, it is challenging to create such data across a large number of diverse apps.
Third, for captured UI data to be meaningful, a new UI state should only be captured after the UI has been completely updated in response to a user interaction. Automatically detecting the completion of UI updates is another challenging problem, since updates can happen asynchronously in response to external events (for example, when data from a remote server is received). Humans, however, are capable of detecting the completion of UI updates with relative ease.
Web-Based Interaction Interface
ERICA users interact with Android apps through a web-based interface, as opposed to directly accessing the devices on which the apps run. There
are two reasons for this design decision. First, having a web-based inter-face makes it possible to use apps remotely, making it easier to crowdsource data collection over the Internet. In addition, a browser-based architecture lowers the barrier for users to use the system. Users do not need to use a specific device or install any software on their devices. Second, the servers that power ERICA have much greater compute capability than a phone or tablet, allowing interaction data to be captured in the background without negatively affecting user experience.
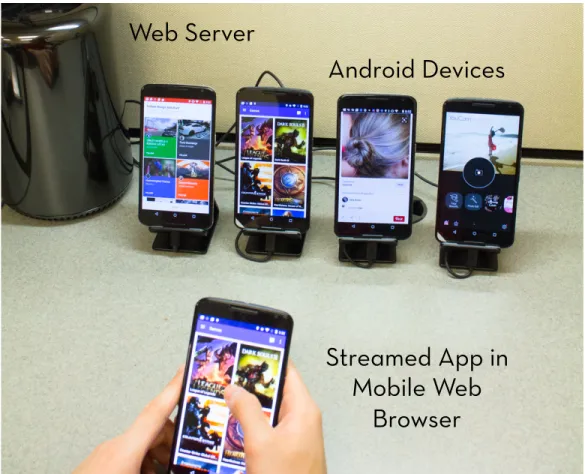
Although users interact with apps through a web interface, ERICA still offers a near-native experience for users. ERICA is powered by a responsive web frontend which, when used in fullscreen mode on a mobile browser, mirrors the screen of the device on which the app is running (see Figure 3.2).
Physical Devices
ERICA runs Android apps on physical phones and tablets connected to the ERICA server. Physical devices offer more predictable UI performance and support a wider variety of features (such as OpenGL 2.0) across a larger number of apps, compared to the best Android emulators available today.
3.2.2
Implementation
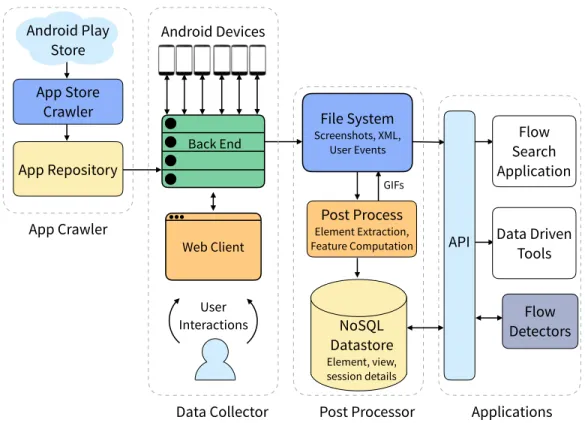
ERICA comprises four components: an app crawler, a data collector, a post-processor, and a web API (Figure 3.1). The app crawler obtains APK files for Android apps from the Google Play Store. The data collector captures the state of an app’s UI as users interact with it. The post-processor combines the captured data streams into a single unified representation – aninteraction trace (details of this representation are presented in Section 4.1.1). It also computes visual and textual features for UI elements and stores them in a database for subsequent querying. Client applications access ERICA’s data through a web API.
App Crawler
The app crawler uses a Google Play Store API (application programming interface) to download Android APK files for apps, along with play store
File System Screenshots, XML, User Events Android Devices App Repository App Store Crawler
Data Collector Post Processor Applications
App Crawler Flow Search Application Post Process Element Extraction, Feature Computation Flow Detectors Android Play Store Back End Web Client User Interactions NoSQL Datastore Element, view, session details GIFs
API Data Driven
Tools
Figure 3.1: ERICA’s architecture. Apps from the Google Play Store are run on physical Android devices. Users interact with these apps through a web interface that allows the system to capture their interactions as well as the state of the app’s UI. Post-processing scripts compute structural
properties of elements, and UIs and store them in a NoSQL datastore. Client applications access data through a web API.
metadata such as app rating, number of downloads, and app category.
Data Collector
The data collector allows users to interact with Android apps through a web interface and captures three kinds of data in realtime: screenshots (visual representation of UIs), view hierarchies (structural representation of UIs), and user interactions. The collector comprises three components: a set of Android devices, a backend server, and a web client (Figure 3.2). Each Android device is a physical phone connected to the backend server via USB, and each one runs a modified version of Android OS.
The backend manages the devices and installs Android apps on them. It sends the device’s UI as compressed JPEG images to the web client using a WebSocket connection. It also relays user inputs from the web client to the
Web Server
Android Devices
Streamed App in
Mobile Web
Browser
Figure 3.2: ERICA’s data collection infrastructure. Here ERICA’s web client is being used in a browser on a phone in fullscreen mode to interact with an app running on one of the other Android devices connected to the server (second from the left). ERICA collects information about the app in realtime while the user is interacting with it.
device. Finally, it saves the captured data to the local file system.
The web client displays images of the app’s UI in a browser and allows users to interact with it. It has a responsive layout and can be used on devices of varying form factors, including desktops and mobile devices. On a mobile device, with the browser in full-screen mode, it offers a near-native app experience (Figure 3.2 shows one of the device screens being mirrored in the user’s browser). Both the backend server and the web client are implemented on top of theOpenSTFframework [49]. Theminitouchlibrary allows the web client to support all common multitouch gestures when used on touchscreen devices, and two-finger pinch, rotate, and zoom on regular PCs [50].
Implementing the data collector required overcoming two technical chal-lenges:
Capturing UI Data with Low Latency. Capturing UI data in an app with-out any perceptible user delay is non-trivial. To capture UI changes in response to user interactions, ERICA requests the structured representa-tion of an app’s UI every time a user interacts with it. Android’s default UiAutomator service, which is commonly used to request view hierarchies from Android devices, is poorly suited for this purpose as it takes multiple seconds to return the data [51]. Instead, we modified the Android OS to im-plement a custom service that responds within about a hundred milliseconds. This service was built by augmenting the Android classes that define UIs and UI elements with custom methods that dump properties of their instances at runtime. The service returns a hierarchical representation of the UI in XML format and has properties (such as position and size) for all the elements on the screen. The service also allows capturing additional properties of UI elements that are not available through the UiAutomator service, such as font family and size information for text elements.
Capturing screenshots of a UI multiple times a second enables a smooth user experience when interacting with apps through the web frontend. It also enables high-fidelity viewing of the motion details of the app (animations and transitions) from the captured data. ERICA uses the minicap library [52] to enable the capture of more than ten screenshots per second, configured to trigger whenever pixels on the device screen change.
Inferring Gestures. When a user interacts with an app’s UI through the web client, the client captures user input events (such asTouchUp,TouchMove, and TouchDown) and their coordinates. These events are relayed to the An-droid device via the server. AnAn-droid translates these low-level input events to gestures (such as clicks, scrolls, longtaps, etc.), and, if applicable, dispatches them to the appropriate element on the UI [53].
Accurately inferring high-level gestures from the low-level input events captured by the web client is a challenging task. Instead, ERICA captures gestures directly from the Android OS by modifying Android to output the type and target element of a gesture every time one is detected.
Post-Processor
The post-processor reconciles the three streams of captured data and com-bines them to form a unified representation called an interaction trace
(Sec-tion 4.1.1). It parses the structural representa(Sec-tion of UI screens to identify individual UI elements, crops the elements from the screenshot, and saves them to the file system. Element properties (such as size, location, and con-tained text) are also saved to a NoSQL datastore for subsequent querying. Multiple screenshots are combined to form animated GIFs that show how a UI responds to different user interactions. A web API provides access to the data stored in the file system and in the NoSQL datastore.
3.2.3
Data Collection
We demonstrated the usefulness of ERICA by using it to collect user in-teraction traces from more than 1000 Android apps, and built a corpus by crawling the top 100 apps from 30 different categories on the Google Play Store. We recruited 28 participants for lab-based data collection through posters and email lists on campus, briefed them about the study, and gave them a short tutorial on ERICA’s web interface. Each participant was free to use each app totally unsupervised and without any time limit. To pro-tect participants’ privacy, we instructed them to input fake personal data as necessary.
The participants completed 1186 sessions for 1150 apps. After rejecting sessions with less than 5 interactions, we were left with 1065 sessions for 1011 apps, consisting of more than 18,000 unique UI screens, 52,000 gestures, 500,000 interactive elements, and 6.7 million total elements. On average, sessions lasted 4 minutes (min 30 seconds, max 21 minutes) and had 51 in-teractions over 18 unique UI screens. Users employed 5 Android activities in each app on average, and performed 6.2 interactions in each activity (activ-ities are components of Android apps that allow users to perform a specific task [54]).
3.3
Rico: Scaling Interaction Mining
ERICA was the first system to demonstrate the feasibility of interaction mining. It was, however, limited in two ways. First, it was designed for a lab-based setup where users were on the same network as the server. The effort required to recruit and manage users for lab-based crawling sessions
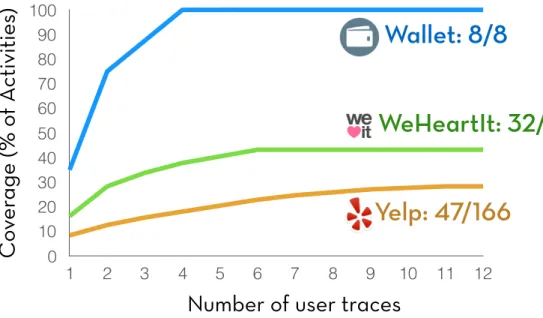
limited the scale at which we could operate it for app crawling. Second, ERICA achieved low coverage of an app’s UI states. One way to improve that is to combine multiple user traces. Figure 3.3 illustrates how coverage increased for three apps of varying complexity (measured by the number of Android activities found in their APK files) as multiple traces were combined. We observe that, as in heuristic evaluation, 5 to 8 users appear to provide optimal coverage [22]. For truly complex apps, coverage may remain low even after aggregating many user traces, since many UI states exist that humans do not visit during regular usage.
To enable interaction mining at a larger scale, we developed Rico, an inter-action mining platform that extended the ERICA architecture in two ways. First, it was designed to work over the Internet, enabling us to hire paid work-ers from online crowd marketplaces for app crawling. Second, it combined human-powered and programmatic exploration for higher coverage. Humans rely on prior knowledge and contextual information to effortlessly interact with a diverse array of apps. Apps, however, can have hundreds of UI states, and human exploration clusters around common use cases. These factors result in human exploration achieving low coverage over UI states for many
V alue Axis 0 10 20 30 40 50 60 70 80 90 100 1 2 3 4 5 6 7 8 9 10 11 12
C
ov
er
age (% o
f A
ctivities
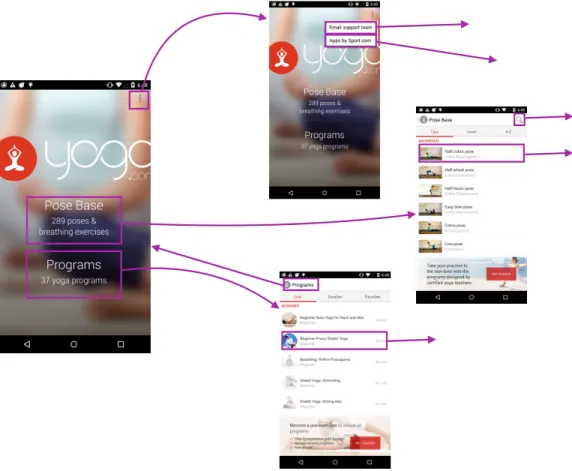
)
Number of user traces
WeHeartIt: 32/74
Wallet: 8/8
Yelp: 47/166
Figure 3.3: Coverage of activities in the app Wallet (top),
Weheartit (middle), and Yelp (bottom) with respect to the number of users whose interaction traces were combined. Coverage does not increase significantly after 5 to 8 users since there is significant overlap between activities that different users visit.
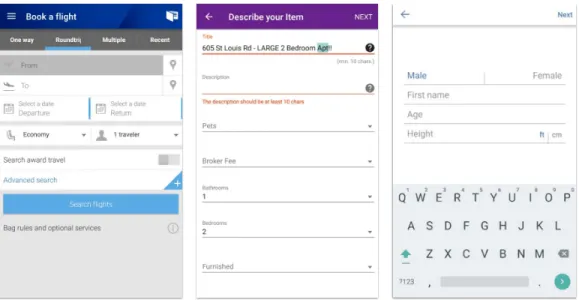
apps [55, 13]. Automated agents, on the other hand, can be used to exhaus-tively process the interactive elements on a UI screen [47, 44]; however, they can be stymied by UIs that require complex interaction sequences or human inputs (Figure 3.4) [56].
Rico’s hybrid approach for design mining mobile apps combines the strengths of human-powered and programmatic exploration: leveraging humans to un-lock app states that are hidden behind complex UIs, and using automated agents to exhaustively process the interactive elements on the uncovered screens to discover new states. The automated agents leverage a novel content-agnostic similarity heuristic (see Section 4.3 for details) to construct aninteraction graph (Section 4.1.2) to efficiently explore the UI state space. Together, these approaches achieve higher coverage over an app’s UI states than what is possible using any one of them alone (Section 3.3.3).
3.3.1
Crowdsourced Exploration of Apps
For crowdsourced exploration, Rico uses a web-based architecture similar to that of ERICA. A crowd worker uses apps through a web application, which establishes a dedicated connection between the worker and a phone in our mobile device farm. The system loads an app on the phone, and starts continuously streaming images of the phone’s screen to the worker’s browser.
Figure 3.4: Automated crawlers are often stymied by UIs that require complex interaction sequences, such as the three shown here.
As the worker interacts with the screen on his browser, these interactions are sent back to the phone, which performs the interactions on the app.
Rico extends the ERICA architecture to enable large-scale crowdsourcing over the Internet. It adds a token-based authorization system that supports both short- and long-term engagement models. For micro-task-style crowd-sourcing on platforms like Amazon Mechanical Turk, it generates URLs with tokens. When a worker clicks on a URL with a valid token, the system in-stalls an app on a device and hands over control to the user for a limited time. To facilitate longer term engagements on platforms such as Upwork, Rico provides a separate interface through which workers can repeatedly re-quest apps and use them. This interface is protected by a login wall, and each worker is provided separate login credentials. Compared to ERICA, we also lowered the bandwidth consumed by Rico by lowering the frame rate for screen updates and by using higher a compression ratio for the streamed JPEG images.
Rico’s view hierarchies capture the superclass names of all elements in the view hierarchy, something not present in the ERICA view hierarchies. Superclass names are useful since we discovered that developers frequently use custom derived class names such asAppNameViewfromTextView. Using superclass names, it is possible to correctly expose such an element as a text element to downstream applications.
We show the Rico web interface in Figure 3.5. On the left-hand side, crowd-workers can see the streamed phone screen. They can interact with it using their computer keyboard and mouse. The interface also supports relaunching the app they were supposed to use in case they exit the app by mistake. On the right-hand side, the interface provides usage instructions and features to overcome two operational challenges we faced in large-scale crowdsourc-ing. First, to minimize the capture of personally identifiable information, the interface provides a name, email address, location, and phone number for crowd workers to use when apps request such information. Second, the system is set up in a way that when apps send emails or text messages to the specified email addresses and phone numbers, crowd workers can access those messages through the web interface. This allows them to complete app verification steps with minimal effort.
Our use of crowdsourcing is different form prior work. Prior work has gen-erally used crowdsourcing to collect labeled data for training models [57] or
Streamed mobile app screen that can be
interacted with Provided Personal Details Usage Instructions Verification SMS and email
Figure 3.5: Rico’s web interface. On the left, crowd workers can interact with the app screen using their keyboard and mouse. On the right, they are provided instructions and details such as the name, location, phone number, and email address to use in app. The interface also allows workers to access SMS (short message service) and email messages sent to the provided phone number and email to complete the app verification processes.
for performing evaluations through surveys or performance oriented tasks [8, 58]. In contrast, our work requires crowdworkers to use mobile apps without performing any labeling or annotations.
3.3.2
Automated Exploration of Apps
To move beyond the set of UI states uncovered by humans, Rico employs an automated exploration system. Existing automated crawlers hard code inputs for each app to unlock states hidden behind complex UIs [59, 56]. We achieve a similar result by leveraging the interaction data contained within the collected user traces: when the crawler encounters a interface requiring human input, it replays the interactions that a crowd worker performed on that screen to advance to the next UI state.
Similar to prior work [59, 56], the automated mining system uses a depth-first search strategy to crawl the state space of UIs in the app. For each unique UI, the crawler requests the view hierarchy to identify the set of interactive elements. The system programmatically interacts with these ele-ments, creating an interaction graph that captures the unique UIs that have been visited as nodes, and the connections between interactive elements and their resultant screens as edges. This data structure also maintains a queue of unexplored interactions for each visited UI state. The system programmati-cally crawls an app until it hits a specified time budget or has exhaustively explored all interactions contained within the discovered UI states.
3.3.3
Benefits of Hybrid App Approach
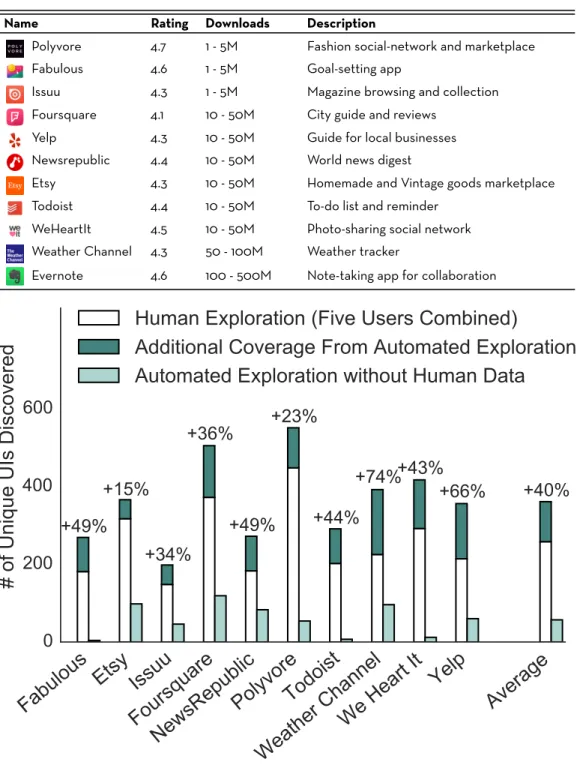
To measure the coverage benefits of our hybrid exploration approach, we compare Rico’s crawling strategy to human and automated exploration alone. We selected 10 apps (Table 3.1) from the top 200 on the Google Play Store. Each app had an average rating higher than 4 stars (out of 5) and had been downloaded more than a million times. We recruited 5 participants for each app, and instructed them to use the app until they believed they had discovered all its features. We then ran the automated explorer on each app for three hours, after warming it up with the collected human traces.
Table 3.1: The Android apps used in our evaluation. Each had a rating higher than 4 stars (out of 5) and more than 1M downloads on the Google Play Store.
Name Rating Downloads Description
Polyvore 4.7 1 - 5M Fashion social-network and marketplace Fabulous 4.6 1 - 5M Goal-setting app
Issuu 4.3 1 - 5M Magazine browsing and collection Foursquare 4.1 10 - 50M City guide and reviews
Yelp 4.3 10 - 50M Guide for local businesses Newsrepublic 4.4 10 - 50M World news digest
Etsy 4.3 10 - 50M Homemade and Vintage goods marketplace Todoist 4.4 10 - 50M To-do list and reminder
WeHeartIt 4.5 10 - 50M Photo-sharing social network Weather Channel 4.3 50 - 100M Weather tracker
Evernote 4.6 100 - 500M Note-taking app for collaboration
Figure 3.6: The performance of our hybrid exploration system compared to human and automated exploration alone, measured across ten diverse Android apps
organizing an Android app’s codebase that can comprise multiple UI screens. While activities are a useful way of statically analyzing an Android app, developers do not use them consistently: in practice, complex apps can have the same number of activities as simple apps. In contrast, we use a coverage measure that correlates with app complexity: computing coverage as the number of unique UIs discovered under the similarity heuristic (Section 4.3). Figure 3.6 presents the coverage benefits of a hybrid system, combining hu-man and automated exploration increases UI coverage by an average of 40% over human exploration alone. For each app, hybrid exploration reached Android activities that weren not reached by human exploration. For exam-ple, on the Etsy app, the hybrid system discovered screens from 7 additional activities beyond the 18 discovered by human exploration.
We also evaluated the coverage of the automated system in isolation, with-out bootstrapping it with a human trace. The automated system achieved 26% lower coverage across the tested apps than Rico’s hybrid approach. This poor performance is largely attributable to the gated experiences that pure, automated approaches cannot handle. For instance, Todoist and WeHeartIt hide most of their features behind a login wall.
3.3.4
Data Collection
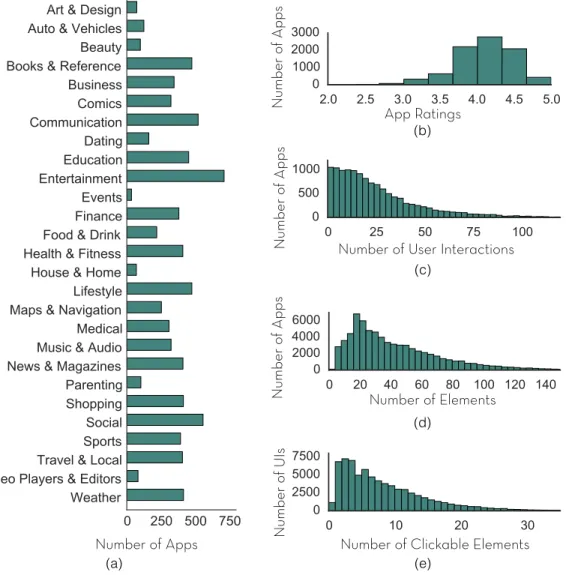
We used Rico to mine 9,772 Android apps spanning 27 categories. The result-ing dataset comprises 10,811 user interaction traces and 72,219 unique UIs (Figure 3.7). We excluded from our crawl categories that primarily involve multimedia (such as video players and photo editors) as well productivity and personalization apps. Apps in the Rico dataset have an average rating of 4.1 stars, and data pertaining to 26 user interactions.
We crowdsourced user traces for each app by recruiting 13 workers (10 from the U.S. and 3 from the Philippines) on UpWork. We chose UpWork over other crowdsourcing platforms because it allows managers to directly communicate with workers, a capability that we used to resolve technical issues that arose during crawling. UpWork workers also preferred longer term work commitments, which was better for us than micro-task-based models since it minimized the time we had to spend training and overseeing workers untill they became proficient in using our interface. We instructed workers
to use each app as it was intended, based on its play store description for no longer than 10 minutes.
In total, workers spent 2,450 hours using apps on the platform over five months, producing 10,811 user interaction traces. We paid $19,200 in com-pensation, or approximately $2 to crowdsource usage data for each app. To ensure high-quality traces, we visually inspected a subset of each user’s sub-missions. After collecting each user trace for an app, we ran the automated crawler on it for one hour. We discuss the contents of the Rico dataset and its intended applications in the next chapter.
Number of Clickable Elements Number of User Interactions
N umber o f UI s App Ratings (a) N umber o f App s N umber o f App s (b) (c) (e) N umber o f App s (d) Number of Elements Number of Apps
Figure 3.7: Summary statistics of the Rico Dataset: app distribution by (a) category, (b) average rating, and (c) number of mined interactions. The distribution of mined UIs by number by of (d) total elements and (e) interactive elements.
3.4
Discussion and Future Work
With systems like Rico, it is now possible to mine design data at scale from thousands of publicly available apps. We discuss how the mined data can be processed into useful representations of app designs in Chapter 4 and present two applications that use these representations in Chapter 5 and Chapter 6.
There are a number of avenues for future work on extending interaction mining systems. Interaction mining outside of a web-based paradigm could be explored. For instance, mining interaction data directly on end-user de-vices could have certain advantages, such as capturing more nuanced inter-action patterns that are influenced by a user’s context and capturing the effects of different device sizes and configurations. On-device mining could also be more financially sustainable compared to using paid crowdworkers. This could enable mining app designs longitudinally over larger periods of time to build datasets that capture design changes over time.
Another promising direction of future work is towards lowering the need for human exploration. Perhaps more sophisticated automated models for app exploration that emulate human interaction could be used. Human in-teraction traces such as those captured by Rico would be an ideal dataset for training such models. Future work could also explore the benefits of a system like Rico outside of design mining, in areas like security and software testing where high app state coverage is also desirable [55, 47, 56].
CHAPTER 4
REPRESENTATIONS AND MODELS OF
MOBILE APP DESIGN
Interaction mining systems such as ERICA and Rico enable capturing de-tailed design and interaction data for Android apps. In this chapter, we discuss how the captured data can be processed to expose the different com-ponents of an app’s design and to build representations that are useful for downstream data-driven applications. This chapter also illustrates how mod-els of design similarity can be trained on this data to help find unique designs in the dataset and to enable example-based design search.
4.1
App Design Representations
The representations used to capture designs in a domain are closely tied to what capabilities are desired in the design tools. For example, capturing graphic designs as images is useful for designers to visualize designs and to gather feedback on them. However, they are not very useful for building design search and retrieval systems. Having access to structured representa-tion of a design (such as a DOM tree for webpages) allows easier search and retrieval [3]. In this section, we describe two representations of mobile app designs that we have found to be a good fit for a wide range of data-driven design applications.
4.1.1
Interaction Trace
An interaction trace (shown in Figure 4.1) captures an app’s design as a sequence of app UI’s. For each UI, it contains a collection of screenshots (visual representation), a view hierarchy (structural representation), and the user interaction performed on that screen. The set of screenshots for a UI, taken together, captures how the UI transitioned into the next UI in response
Screenshots
View Hierarchies
User Interactions
Time
Screenshots User Interaction View HierarchyFigure 4.1: Visual representation of an interaction trace. It consists of a sequence of UIs. For each UI it contains a collection of screenshots, a view hierarchy, and the user interaction performed on that screen. The series of screenshots for a UI taken together show how the UI responded to the user interaction.
to the user interaction performed on it.
View hierarchies capture all of the elements comprising a UI, their prop-erties, and relationships between them. For each element, it exposes the element’s visual properties (such as screen position, dimensionality, and visi-bility), textual properties (such as class name, id, and displayed text), struc-tural properties (such as a list of its children in the hierarchy), and interactive properties (such as the ways a user can interact with it). Additionally, view hierarchies mined by Rico contain Android superclasses for all elements (e.g., TextView), which can help third-party applications reason about element types.
Combining the three types of data captured in an interaction trace enables multiple use cases. Combining the screenshots with the user interactions allows visualizing user behavior in an app. The blue dots in Figure 4.1, for instance, show where users tapped or scrolled on the different screens. View hierarchies expose element text and when combined with screenshots allow accurately cropping out individual elements and analyzing their visual details
(such as color) and shapes. Thus, it becomes possible to index and search over UI elements based on text, shape, or visual attributes. Having multiple screenshots during UI changes allows combining them to visualize motion details. And finally, if an interaction trace is mined during human usage (as is done by ERICA and Rico), it often captures meaningful user flows in the app. These flows can be identified using automated methods (see Section 5.2) by combining user interaction details with view hierarchies. Thus an interaction trace captures and helps index and search all four components of an app’s design: user flows, UIs, visual details and animations.
4.1.2
Interaction Graph
An interaction graph (shown in Figure 4.2) comprises of nodes that repre-sent unique UI screens encountered in an app. Edges connect interactive UI
Figure 4.2: Visual representation of an interaction graph. Nodes in this graph represent unique UI screens. Edges connect interactive elements to UI screens that are reached by interacting with them.
elements to UIs that are reached by interacting with those elements.
Interaction graphs are well s