ANY OPINIONS EXPRESSED ARE THOSE OF THE AUTHOR(S) AND NOT NECESSARILY THOSE OF THE SCHOOL OF ECONOMICS & SOCIAL SCIENCES, SMU
Central Asia: Mapping Future Prospects
Malcolm Dowling, Ganeshan Wignaraja
February 2006Paper No. 05-2006
S
S
S
M
M
M
U
U
U
E
E
E
C
C
C
O
O
O
N
N
N
O
O
O
M
M
M
I
I
I
C
C
C
S
S
S
&
&
&
S
S
S
T
T
T
A
A
A
T
T
T
I
I
I
S
S
S
T
T
T
I
I
I
C
C
C
S
S
S
W
Central Asia:
Mapping Future
Prospects
Malcolm Dowling and Ganeshan Wignaraja
TABLE OF CONTENTS
EXECUTIVE SUMMARY i
1. Introduction 1
2. Current Status of Economic Development in the CARs 3
2.1 Introduction 3
2.2 Economic Growth 3
2.3 Structural Change 4
2.4 Inflation 5
2.5 External Sector Developments 6
2.6 Poverty 8
2.7 Short-Term Prospects (2005–2007) 9
3. Mapping the Future: 2015 10
3.1 Introduction 10
3.2 Scenario 1 – Business As Usual 11
3.3 Scenario 2 – Closing the Gap 18
3.4 Scenario 3 – Falling Behind 19
3.5 Risks 20
3.6 Summary 21
4. Theme Chapter – Benchmarking Industrial Competitiveness 22
4.1 Introduction 22
4.2 Recent Industrial Performance 22
4.3 Comparisons with Transition Economies 24
4.4 Explaining Industrial Competitiveness 26
5. Conclusions 30
BIBLIOGRAPHY 33
APPENDIXES
1. A Snapshot of the Region 37
2. Macroeconomic Policies and Trends 42
3. Forecasting Method and The World Outlook 46
4. Country and Regional Rankings, TEMECI 2003 53
5. Mongolia: Economic Assessment 55
6. Xinjiang Uygur Autonomous Region of the PRC 59
List of Tables
Table 2.1: GDP Growth (%) 3
Table 2.2: GDP Per Capita (US$) 4
Table 2.3: Sector Shares of Agriculture, Industry and Services Sector 1997 and 2003 (% of
GDP) 5
Table 2.4: Inflation (%) 6
Table 2.5: Merchandise Export Growth (%) 7
Table 2.6: Poverty and Income Distribution 8
Table 3.1: A Summary of Current Performance 10
Table 3.2: Scenario 1 Real GDP Baseline Growth Forecasts to 2015 (%) 12
Table 3.3: Population Baseline Forecast to 2014 13
Table 3.4: Scenario 1 GDP Per Capita Forecast to 2015 (US$) 14 Table 3.5: Scenario 1 Oil and Gas Exports—Projection to 2015 (in billion US$) 14 Table 3.6: Scenario 1 Manufactured Exports—Projection to 2015 15 Table 3.7: Scenario 1 External Accounts
—
Projection to 2015 16 Table 3.8: Scenario 1 Poverty Baseline Forecast to 2015 17Table 3.9: Summary of Scenario 1 – Business As Usual 17
Table 3.10: SCENARIO 2 – Closing the Gap 18
Table 3.11: SCENARIO 3 – Falling Behind 19
Table 4.1: Selected Indicators of Industrial Performance in Central Asia 23 Table 4.2: Composition of Manufacture Export, 2003 ($’000 and %) 23 Table 4.3: Factors Affecting Competitiveness in Transition Economies 27 Table 5.1: Examples of Policy Priorities For Oil & Non-oil Exporters 32
Table A1.1: Oil Endowments and Production, 2003 40
Table A1.2: Natural Gas Endowment and Production, 2003 40
Table A2.1: Money and Quasi Money (M2) as a % of GDP 42
Table A2.2: Fiscal Balance of Central Government (% of GDP) 43
Table A2.3: Trade Balance (US$ million) 43
Table A2.4: Current Account Balance (% of GDP) 44
Table A2.5: Debt Service Ratio (% of exports of goods and services) 44
Table A2.6: FDI (US$ million) 45
Table A3.1: Growth in GDP—Organization for Economic Co-operation and Development and
the World 48
Table A3.2: Prices for Oil, Cotton, and Gold 50
Table A3.3: Growth in GDP—Russia, the PRC, and India 50
Table A4.1: Overall TEMECI Ranking 2003 54
Table A4.2: TEMECI and Components by Region 2003 54
Table A6.1: GDP Growth (% per year) 60
Table A7.1: Transition Indicator Scores 2004 63
List of Figures
Figure 4.1: TEMECI, 2003 25
Figure 4.2: Regional Averages of TEMECI 2003 26
Figure 4.3: Railway and Telephone Densities 29
Figure A1.1: Population (in million), 2004 37
Figure A1.2: GDP Shares in CARs (%), 2004 38
Figure A1.3: Geographical Size (in km2), 2004 56
Figure A5.1: Structure of Output (% of GDP), selected years 59
Figure A6.1: GDP Per Capita (US$), 1996–2003 60
Figure A6.2: Inflation Rate (%), 1996–2003 61
List of Boxes
Box 3.1: Global Background 11
Box 3.2: Risks 20
Box A3.1: Cotton, MFA, and the Role of the PRC and India 52 Box A4.1: The Transition Economy Manufacturing Export Competitiveness Index (TEMECI) 53
LIST OF ABBREVIATIONS
ADB – Asian Development Bank
ATC – Agreement on Textiles and Clothing
BTC – Baku-Tbilisi-Ceyhan
CAREC – Central Asia Regional Economic Cooperation CARs – Central Asian Republics
CSB – Central and Southeastern Europe Baltics FDI – Foreign direct investment
GDP – Gross domestic product
ICT – Information and communication technology MDGs – millennium development goals
MFA – Multi Fibre Agreement MVA – manufacturing value added
OECD – Organization for Economic Co-operation and Development OEF – Oxford Economic Forecasting
OPEC – Organization of Petroleum Exporting Countries PRC – People’s Republic of China
SEATCs – Southeast Asian Transition Countries
TEMECI – transition economies manufacturing export competitiveness index UNCTAD – United Nations Conference on Trade and Development
UNDP – United Nations Development Programme
UNESCAP – United Nations Economic and Social Commission for Asia and the Pacific UNESCO – United Nations Educational, Scientific and Cultural Organization
US – United States
WEO – World Economic Outlook WTO – World Trade Organization
Executive Summary i
Executive Summary Outline of Study
Central Asia has emerged as one of the world’s fastest growing regions since the late 1990s and has shown notable development potential. This is significant for a region comprising largely of small landlocked economies with no access to the sea for trade. Among the advantages, of the region are its high- priced commodities (oil, gas, cotton and gold), reasonable infrastructure and human capital as legacies of Soviet rule; and a strategic location between Asia and Europe. Furthermore, many Central Asian Republics (CARs) have embarked on market-oriented economic reforms to boost economic performance and private sector competitiveness.
Central Asia: Mapping Future Prospects considers the region’s economic prospects to 2015. It charts recent economic performance, highlighting the economic revival. It also synthesizes recent forecasts and constructs scenarios for future economic variables against a constant global background. Projections include, among others, gross domestic product (GDP), manufactured exports per head, GDP per capita and poverty. A special theme chapter develops a manufacturing competitiveness index to compare the CARs with other transition economies and explores the impact of economic reform and supply-side factors (e.g. foreign investment and human capital) on industrial performance
Recent Economic Revival
Following a prolonged period of slow and negative growth, the region (Azerbaijan, Kazakhstan, Kyrgyz Republic, Tajikistan, Turkmenistan, and Uzbekistan) seems to have turned the corner during the last few years and an economic recovery seems under way. Some features include:
• Economic growth (9.9% per year in 2002–2004) has accelerated to historically unprecedented levels.
• Growth has been driven by high commodity prices–particularly oil and natural gas–and buyout demand, increasing inward investment, improved macroeconomic management and infrastructure development.
• There are signs that oil and gas sector-led growth has stimulated the development of services sector (construction and banking) as well as some manufacturing activities.
• The industrial recovery is linked to the performance of manufactured exports which have grown at about 10% per year. Manufactured exports per head in the CARs as a whole rose to $57.1 per head in 2003.
• There are also indications that economic prosperity has been accompanied by job creation and some reduction in poverty to around 41% of total population in the CARs.
• The region’s GDP per head rose to $889 in 2004, placing it within the category of the world’s low income economies.
• There are signs of a divergence in living standards between oil exporters and non-oil exporters.
Executive Summary ii
Short-term Prospects (2005-2007)
For the next three years, economic growth in the CARs will be in the range of 9% per year. Although inflation will rise somewhat, growth in the oil exporters will continue to be propelled by a combination of high oil and gas prices, buoyant international energy demand, inflow of foreign direct investment (FDI) and investments in modern infrastructure. In the non-oil exporters, growth will be somewhat slower. Favorable prices for non-oil export commodities (e.g. cotton, gold, aluminum and other metals), expansion in the services sector and economic reforms underlie growth in the non-oil exporters. A mild recovery is expected in Kyrgyz Republic fostered by higher gold prices, continuation of a pro-growth economic reform program and higher foreign aid. Increased foreign investment in the natural gas sector in Uzbekistan as well as implementation of measures for private sector development (e.g. stronger legal protection for enterprises and banking sector liberalization) is expected to contribute to growth.
Prospects to 2015
The pressing question facing the CARs is whether the boom that started in the late 1990s will continue until 2015. While this is impossible to predict with certainty, we offer three possible scenarios for the CARs against a constant global background (see Box 1 for details of scenario planning approach used here). The scenarios are distinguished by the extent of action on the domestic policy front in regard to economic policy reform, competitiveness strategy for the industrial sector and regional cooperation.
Scenario 1 - business as usual - assumes a moderate policy reform agenda, the relative lack of any industrial competitiveness strategy and intermittent implementation of regional cooperation initiatives. The main results under Scenario 1 are:
• Real GDP growth will be at least 5% in all the CARs during 2005-2015.
• Oil and gas will be the mainstay of future economic development but economic diversification will continue and the manufacturing sector will expand. Manufactured exports per head for the CARs as a group will increase to $126.0 in 2015.
• Poverty will decline to 25.1% of total population in the CARs;
• GDP per capita will rise to $1,871 placing the region on the threshold of today’s middle income countries.
• The divergence in living standards between oil and non-oil exporters will grow
In Scenario 2 - closing the gap - there is strong commitment to implementing further policy reforms, to developing market-friendly competitiveness strategy and aggressive implementation of regional cooperation initiatives. Scenario 2 suggests the following:
• Real GDP growth in all the CARs will be between 1-2% higher than Scenario 1;
• The pace of economic diversification and manufactured export expansion will be higher than in Scenario 1. The value of manufactured exports per head in Scenario 2 will be about $165.6 compared with $126.2 in Scenario 1.
Executive Summary iii
• GDP per capita will rise further to just under $2,000 placing the region within the ranks of today’s middle income countries;
• The disparities in living standards between oil and non-oil exporters will narrow.
Scenario 3 - falling behind - assumes a moderate level of internal political instability, some backsliding of the policy reform agenda, a more inward-orientation of policies towards industry and limited regional cooperation.
• GDP growth in all the CARs will be 1-2% less than Scenario 1 and much less than Scenario 2;
• The dependence on the oil and gas sector will grow with little sign of economic diversification. Manufacturing expansion and exports will be limited. For instance, in Scenario 3, manufactured exports per head will reach $89.5 compared with $126.2 in Scenario 1 and $165.6 in Scenario 2.
• The extent of reduction in poverty (to 29.9% will be smaller than Scenarios 2 and 3)
• With a per capita income of about $1,667, the region will be far from the threshold of today’s middle income economies.
The analysis suggests that policies are important in determining the future path of development in the CARs and that policy makers face stark choices. If the region continues on its present path (scenario 1 – business as usual) there will some gains but divergences between countries will intensify. If the region decides to follow policies which promote national self interest and rent seeking (Scenario 3 – falling behind) then economic prosperity will be adversely affected. If, on the other hand, the region embraces policy reform, regional cooperation and industrial competitiveness (Scenario 2 – closing the gap) then economic prosperity in all the CARs will be significantly enhanced. For the oil economies, much will depend on how the oil and gas windfalls are harnessed. All countries in the region will gain if these resources are used for the development of individual countries as well as regional cooperation. For the non-oil exporters, the development of manufacturing competitiveness and regional cooperation are key components of a successful strategy.
A cautionary note needs to be added. The projections contained in this study are designed to be only one guide to the direction for economic growth and development in Central Asian economies and of several inputs into the future policy decision framework. There are many internal and external risks that could impact upon the forecasts for the CARs.
Executive Summary iv
Approach to Scenario Planning for the CARs
Forecasting the future of the CARs, particularly a decade ahead, is a daunting task in view of uncertainties in the world economy and the region as well as questions about the reliability of national statistics. Not surprisingly, there have been few previous attempts to do so. Fortunately, future studies and scenario planning is an expanding international field. The world’s leading multinational corporations and economies undertake such exercises on a regular basis as an input into business planning and long-term policy development.
In line with this literature, Central Asia: Mapping Future Prospects aims to provide a simple “big picture” type of overview of the future economic landscape of the CARs as an aid to national policy making. This study examines the economic revival of the CARs since the late 1990s focusing on economic growth performance, structural change, and poverty reduction. It then considers short-term (2005–2007) economic prospects for the CARs using forecasts made by the Asian Development Bank (ADB) country economists in ADB’s annual publication Asian Development Outlook. Finally, it constructs indicative scenarios of how the region might evolve in the future and projects key economic variables to 2015. The long-term projections for the CARs rely on a combination of econometric modeling, reduced form estimation, and policy analysis.
The analysis of future prospects for the CARs were based on certain assumptions about the world economy. The world outlook is constructed with the aid of a world econometric model developed by Oxford Economic Forecasting. Our assumptions regarding the global background are as follows. Growth in the world economy over the next decade will depend upon a number of interrelated factors including the price of oil and developments in industrial economies. Our baseline predicts that the world economy will grow at an average annual rate of around 3.2% for the next decade. This is closer to the historical rate of growth in the world economy than the rapid rate of growth of 4% achieved in 2004. In the energy market, adjustments in both supply and demand suggest that prices for oil will retreat from current levels to the range of $40–$45 per barrel over the next decade. Other commodity prices (gold, cotton, aluminum, natural gas) are also expected to be favorable. The People’s Republic of China and India will increase their strength as regional economic powers. Both economies are projected to continue their robust economic performance, growing at average rates of close to 8% and 7% respectively over the next decade. The outlook further assumes that there investor confidence will be growing and that FDI flows to developing regions (including the CARs) will increase. This assumption is consistent with a continuation of the agenda of policy reforms that has already begun. Finally, relative political stability will continue in the CARs and throughout the world.
These key variables form the global macroeconomic background for our analysis of future prospects of the CARs. The starting point for the long-term projections for the CARs are the 2005– 2007 forecasts from ADB’s Asian Development Outlook. For 2008–2015, these forecasts were adjusted based on expectations about the intensity of policy reforms, regional cooperation, and industrial competitiveness strategy. Reduced form estimation was used to derive key variables such as GDP growth, manufactured exports for the CARs per capita, GDP per capita, and poverty. Each of the scenarios reflect different expectations of the intensity of policy reforms, regional cooperation, and competitiveness strategy against the constant global background outlined above. Country-level forecasts by the International Monetary Fund and Economist Intelligence Unit were considered in the process of formulating forecasts in the CARs.
A cautionary note needs to be added. The projections contained in this study are designed to be a guide to the direction for economic growth and development in Central Asian economies and only one of several inputs into the future policy decision framework. There are many internal and external risks that could impact upon the forecasts for the CARs.
Introduction 1
1. INTRODUCTION
A unique blend of economic, political, and geographical features, which influence its economic development experience, has increasingly focused academic and policy interest on the Central Asian region. Four of these are worth highlighting at the outset. First, the region contains a significant base of the world’s natural resources (including oil, natural gas, gold, and other metals) and hence its economic prospects are closely linked to international commodity prices. Second, it is strategically positioned as a gateway between Europe and Asia and offers extensive potential for trade, investment, and growth. Third, the region spans a vast geographical area, with widely differing natural conditions. Many economies are landlocked and have harsh climates, both of which impose large transactions costs on economic activity (Appendix 1). Fourth, all the economies have had a legacy of socialist-oriented economic policies and several have embarked on market-oriented reforms emphasizing macroeconomic stabilization, trade openness, and private sector development.
In the aftermath of transition, the Central Asian Republics (CARs) witnessed a period of prolonged slow and negative growth and a rising incidence of poverty.1 Many factors have been put forward to explain the difficult transition experience including disruption in production and marketing relations with the former Soviet Union, collapse of aid from the former Soviet Union, a nascent private sector, the lack of capital markets, limited institutions required for a market economy and gaps in infrastructure.
Nevertheless, Central Asia seems to have turned the corner during the last few years. Economic growth, which accelerated to historically unprecedented levels, has been driven by high commodity prices–particularly oil and natural gas–and buyout demand, increasing inward investment, improved macroeconomic management, and development of infrastructure. 2 There are signs that oil and gas sector-led growth has stimulated the development of services sector (construction and banking) as well as some manufacturing activities. There are also indications that economic prosperity has been accompanied by job creation and some reduction in poverty. There is optimism in policy circles in Central Asia, with some even predicting that some of countries of the region will join the ranks of middle income countries within a decade or so.
Against this backdrop, this study reviews recent economic performance of the CARs and analyzes their economic prospects to 2015. It aims to provide a simple “big picture” type overview of the future economic landscape of the CARs as an aid to policy making. Forecasting the future of the CARs, particularly a decade ahead, is a daunting task in view of uncertainties in the world economy and the region as well as questions about the reliability of national statistics. Not surprisingly perhaps there have been few previous attempts to do so.3 Fortunately, future studies and scenario planning is an expanding international field. Hence, there is a growing
1
A plethora of literature exists on the economic record and reform experience of Central Asia during the first decade of transition to a market economy. For a selection see: Trushin and Trushin (2000), Pomfret and Anderson (2001), Campos and Coricelli (2002), Svejnar (2002), World Bank (2002), Zhukov (2002), Linn (2004), and Loukoianova and Unigovskaya (2004).
2
In its first regional economic outlook for the Middle East and Central Asia, the International Monetary Fund (IMF) notes that “A favorable external environment combined with generally sound economic policies to produce strong macroeconomic performance for the countries of the Middle East and Central Asia in 2003 and early 2004. Prospects are for continued strong performance through 2005” (IMF, 2004b, p. 2).
3
A notable example is Zhukov (2000) who provides economic forecasts for the CARs to 2015. IMF country reports (IMF 2004c, 2004d, and 2005) also make projections for some CARs but mostly to 2010.
Introduction 2 body of work on mapping the future of other countries and regions, which provides useful technical insights. 4
In line with other futures studies, the present study hopes to make a modest contribution to national level scenario planning exercises in the CARs. In particular, it seeks to guide CARs policy makers by suggesting the direction of future economic performance as well as indicating key policy issues. The review of recent economic performance in the CARs looks at macroeconomic developments (GDP growth and structural change, inflation and external developments) and poverty. A theme chapter looks at the industrial performance and competitiveness of the region. Drawing on this analysis, the outlook for the CARs for the next 10 years is projected against a background of global prospects. As long-run forecasts can change in response to external events, the risks to the CARs outlook are also highlighted.
A cautionary note needs to be added to the use and interpretation of the forecasts contained in this study. These projections are designed to be a guide to the direction for economic growth and development in Central Asian economies based on the best information and analysis available at the time of writing. As such they are purely indicative of future trends and one of several inputs to guide policy makers in the region.
The study is laid out as follows:
Chapter 2 deals with recent macroeconomic developments and poverty and income distribution in the CARs. It reviews economic growth and structural transformation, inflation, external sector developments, poverty, and short-term prospects (2005-2007). Chapter 3 maps the future for the CARs to 2015. It draws on the analysis of the previous chapter against a background of regional and global developments. It does so in the form of three scenarios showing alternative outcomes distinguished by domestic policy initiatives in regard to policy reforms, regional cooperation, and industrial competitiveness strategy. Chapter 4 assesses the recent competitiveness record of the industrial sector in the CARs. A simple transition economies manufacturing export competitiveness index is developed to benchmark the CARs performance against other transition economies and key factors influencing competitiveness including economic incentive regime, industrial technology, skills, and infrastructure are examined. Chapter 5 concludes and reviews policy implications for oil and non oil exporting CARs.
This study covers the Central Asia Regional Economic Cooperation (CAREC) members and Turkmenistan with more attention given to the Central Asian Republics. 5 Given the importance of oil and gas resources for Central Asia’s economic development, this study draws a distinction between oil exporters (Azerbaijan, Kazakhstan, and Turkmenistan) and non-oil exporters (the Kyrgyz Republic, Tajikistan, and Uzbekistan). Oil exporters are those CARs that are major exporters of oil and gas to international markets, typically using foreign direct investment to assist resource exploitation. 6 We also review the performance of Mongolia and Xinjiang Uygur Autonomous Region of the Peoples Republic of China (PRC).
4
These exercises on medium-and long-run forecasting for policy purposes includes ADB (1997), Economic Intelligence Unit (2004), Oxford Economic Forecasting (2004), National Intelligence Council (2004), and PIRA Energy Group (2004).
5
On the CAREC initiative and ADB’s role, see ADB (2004b).
6
As Appendix 1 shows, Uzbekistan is recognized to have significant natural gas reserves and small oil reserves. However, it has witnessed modest annual gas production growth by avoiding Russia’s pipeline system and by concentrating on the domestic market and on exports to its immediate neighbors. Hence, in line with IMF (2004b) and ADB (2004b), this study includes it among the non-oil exporters.
Current Status of Economic Development in the CARs 3
2. CURRENT STATUS OF ECONOMIC DEVELOPMENTS IN THE CARS
2.1. Introduction
This chapter deals with recent developments in the CARs highlighting the turn around in economic performance since the late 1990s. It reviews economic growth and structural change, inflation, external sector developments, and poverty.
2.2. Economic Growth
After a period of dismal economic performance following the breakup of the Soviet Union, the CARs have put together a booming economic performance since 1997 (see Table 2.1).
Table 2.1: GDP Growth (%)
1992–1996 1997–2001 2002–2004
Average Average Average 2002 2003 2004 2005c
Oil Exporters Azerbaijan -15.3 9.5a 10.6 10.6 11.1 10.2 17.0 Kazakhstan -7.0 5.2 9.5 9.8 9.2 9.4 9.0 Turkmenistan -9.3 10.2 21.3 19.8 23.0 21.0 10.0 Non-oil Exporters Kyrgyz Republic -10.6 5.3 4.7 0.0 7.0 7.1 3.0 Tajikistan -15.2 5.9 10.1 9.5 10.2 10.6 8.0 Uzbekistan -3.4 4.4 5.2 4.0 4.1 7.7 5.0 CARsb -8.0 6.1 9.9 9.3 10.0 10.4 9.2
Source: 1992–1996 from EBRD (2004) and 1997–2005 from the Asian Development Bank (ADB) ADO 2005, ADB 2005 Update
a 1999-2001. b
Weighted average, GDP weights.
c
Staff estimates.
From 1997 to 2001, annual GDP grew by 6.1% per year in Central Asia as a whole compared with negative growth (-8.0) in the previous five years. In the next 3 years, growth rebounded to a spectacular 9.9%. Although from a low base, the region’s performance is the highest in the post-transition period for any group of countries in the Soviet sphere and compares favorably with the fastest- growing economies in Asia and the rest of the developing world.7 In 2005, the region’s growth is expected to be well over 9%, reflecting high commodity prices, buoyant international demand and other country-specific factors discussed below.
High energy prices and investments in the oil and gas sector, including petrochemicals, were the main growth drivers in the three oil exporting economies of Azerbaijan, Kazakhstan, and Turkmenistan. In Azerbaijan, oilfield and pipeline investment, natural gas development, and a booming construction sector have contributed to a strong growth environment. GDP growth accelerated from 9.5% in 1997-2001 to 10.6% in 2002–2004. Accelerating economic growth in Kazakhstan (9% since 2002) is associated with oil and natural gas investments, good macroeconomic management, and investments in infrastructure. In addition, economic
7
According to European Bank for Reconstruction and Development (2004), real GDP growth in all transition economies as a group was only 0.4% per year during 1992–2003. World Bank (2005) shows that high performing East Asian economies grew at 7.2% during 1990-2003, South Asian economies at 5.5%, Latin American and Caribbean economies at 2.7% and African economies at 2.7%.
Current Status of Economic Development in the CARs 4 diversification has begun recently as food processing, machinery, oil refining, and chemicals showed strong growth. Turkmenistan’s high growth rate in 2002–2004 is based on official figures.8 The country is the weakest reformer in Central Asia but has benefited from natural gas exports, a construction boom, and foreign investment from Turkey in the textiles sector.
Among the non-oil economies, growth in Kyrgyz Republic averaged around 5% beginning in 2002–2004 and 7% in 2003 and 2004 due to a buoyant minerals sectorled by gold exports and a rebound in the agricultural sector. Uzbekistan’s economy grew steadily at just over 5% as agricultural production benefited from restructuring and privatization, as well as from favorable cotton prices. In Tajikistan, the end of civil war aluminum exports, remittances from migrant workers, and foreign aid served as the main impetus for expansion as GDP growth averaged about 10.1% during 2002–2004.
Table 2.2: GDP Per Capita (US$)
1997–2001 2004 Average 2002 2003 2004 PPP$ Oil Exporters Azerbaijan 600.0 763 865 1,029.4 4,174.63 Kazakhstan 1,345.3 1,659 1,995 2,723.9 7,493.97 Turkmenistan 604.7 961 1,236 1,250.7 7,021.03 Non-oil Exporters Kyrgyz Republic 312.1 320 344 432.4 1,928.46 Tajikistan 180.8 190 207 323.1 1,193.31 Uzbekistan 592.2 383 389 461.2 1,870.96 CARs 606 713 389 889 3947
Source: World Bank World Development Indicators Online.
a 1998–2001
Per capita income in Central Asia has also grown as population growth has been low (see Table 2.2). By 2004, the region’s per capita income (US$) increased to $889 (up from $606 in 1997–2001). Despite these recent gains in income growth, per capita income in the CARs remains low by international standards as they are categorized as low income countries (except Kazakhstan, which is a middle income country. The three oil exporting countries have significantly higher per capita incomes than the non-oil exporters indicating a divergence in prosperity within the region. This divergence between oil exporters and non-oil exporters is also visible in figures for per capita income in PPP$ (Table 2.2). Furthermore, several CARs have surpassed pre-crisis 1991 levels of per capita income which is creditable.9
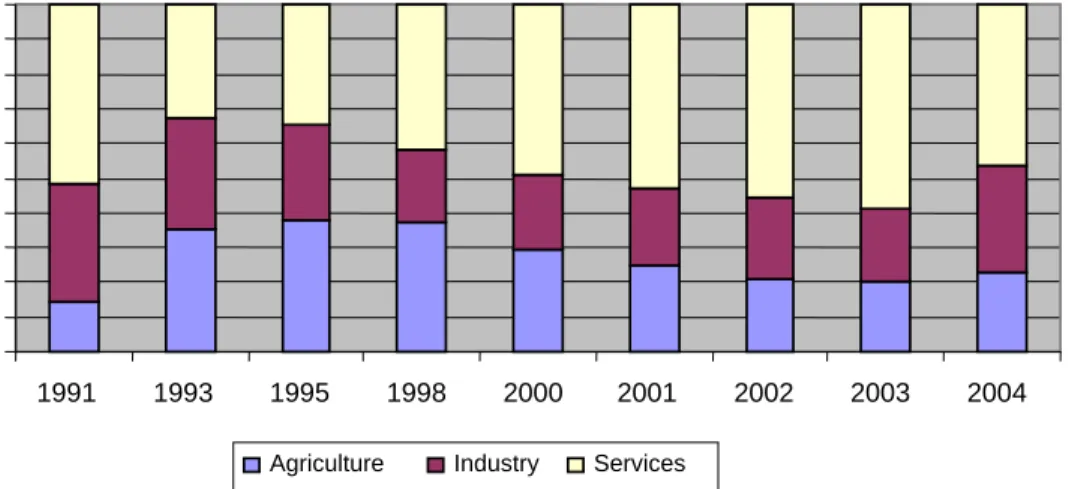
2.3. Structural Change
This boom has been driven primary by developments in the oil and gas sector. There have also been by structural changes in the economies resulting in a shift toward production of industrial goods and minerals and away from agriculture (see Table 2.3). While oil and gas continue to drive the industrial sector (Appendix 1), the rest of the industrial sector and manufacturing also grew rapidly. The share of industry in GDP and manufacturing value added increased. For example, manufacturing value-added increased by over 25% per year in Azerbaijan and 10% per year in Kazakhstan between 1998 and 2003. Manufacturing value-
8
IMF (2004e) constructs alternative GDP estimates for 2001–2003 suggesting that official GDP estimates are overstated. The official GDP estimate for 2001–2003 is 19.0% compared with an IMF alternative estimate of around 11%.
9
Current Status of Economic Development in the CARs 5 added per capita also increased. By 2003 Kazakhstan had the largest industrial base while the Kyrgyz Republic had the smallest. The remaining CARs fall in between these extremes.
Table 2.3 Sector Shares of Agriculture, Industry and Services Sector 1997 and 2003 (% of GDP)
Agriculture Industry (b) Services
1997 2003 1997 2003 1997 2003
Oil Exporters
Azerbaijan 21.7 14.1 39.9 53.7 38.3 32.8
Kazakhstan 13.4 7.3 30.5 35.1 51.6 57
Turkmenistan 20 (a) 22.5 44.3 (a) 42.4 35.7 (a) 35.1
Non-Oil Exporters
Kyrgyz 49.8 50.9 25 17.2 25.2 31.9
Tajikistan 31.8 (a) 24.3 25.6 (a) 24 42.6 (a) 51.7
Uzbekistan 21.3 28.6 18 15.8 60.7 41.9
Notes: (a) 2002 (b) Mining, manufacturing, construction, and utilities Source: ADB, ADO 1998 and 2005; ADB Key Indicators 2002 and 2004
The recent industrial recovery in the CARs is closely linked to the performance of manufactured exports that grew about 10% per year for the region a while between 1998 and 2003 (for more details see Chapter 4). Both oil and non-oil exporters had respectable manufactured export growth although the former (11.0%) was somewhat higher than the latter (7.8%). The structure of manufacturing and manufactured exports varies from country to country. Textiles and garments comprise over 80% of manufactured exports in Tajikistan and Turkmenistan (driven in part by foreign investors from Turkey and Korea) and about 37% of the Kyrgyz Republic’s manufactured exports. Meanwhile, Kazakhstan’s manufactured exports are dominated by iron and steel with some focus on chemicals and plastics as well as machinery and transport equipment. Azerbaijan also has a mix of iron and steel, chemicals, and machinery.
The industrial recovery is also linked to the reforms that have been taking place in the region. Price liberalization has been widespread along with privatization of small and medium scale industries. Privatization of large scale industry, competition policy and reforms in banking finance have proceeded at a more moderate pace. (Refer to Appendix 7 and Table A7.1 for further details)
2.4. Inflation
Macroeconomic stability, proxied by inflation, has also improved. Inflation rates have fallen significantly throughout the region over the past few years indicating improved macroeconomic stability (see Table 2.4). Average inflation for the CARs as a group declined from 20.4% to 6.9% between 1997–2001 and 2002–2004. Furthermore, both oil exporters and non oil exporters were typically able to contain inflation at lower levels in 2002–2004 than in 1997–2001. This may be partly the result of greater fiscal and monetary discipline as well as greater stability in the exchange rate and moderate inflation worldwide. The Kyrgyz Republic had the lowest inflation among the CARs with 3% in 2002–2004 while Tajikistan, with double-digit inflation, had the highest. In 2005, inflation in the CARs is expected to moderately rise to 7.4% as strong demand driven by oil export income exerts upward pressure on prices.
Current Status of Economic Development in the CARs 6 Table 2.4: Inflation (%) 1997–2001 2002–2004 Average Average 2002 2003 2004 2005b Oil Exporters Azerbaijan -0.5 3.9 2.8 2.2 6.7 10.0 Kazakhstan 10.9 6.5 5.9 6.6 6.9 7.2 Turkmenistan 15.0a 6.8 8.8 6.5 5.0 7.0 Non-oil Exporters Kyrgyz Republic 19.1 3.0 2.0 3.0 4.0 4.6 Tajikistan 46.0 11.2 10.2 16.4 7.1 5.9 Uzbekistan 32.1 9.7 21.6 3.8 3.7 7.0 CARs 20.4 6.9 9.0 5.6 6.0 7.4
Source: ADB ADO 2005, ADB ADO 2005 Update
a
1998-2001
b Estimate
2.5. External Sector Developments
External sector performance has generally improved compared with the past as exports have grown more rapidly. This improved trade performance, particularly since 1997, has been driven by developments in the minerals and metals sector in oil exporting countries and by prices for gold and cotton in the non-oil exporting economies.10 In addition, as Section 2.3 discussed, manufacturing has also been buoyant and the overall performance has improved from a decade ago. Between 1997 and 2004, overall export growth from the oil exporting CARs was strong, averaging about 18% per year (see Table 2.5). For the non-oil exporting countries in the region, export performance accelerated after 2001. By 2004, export growth in Kyrgyz Republic, Tajikistan, and Uzbekistan averaged over 20%. In the Kyrgyz Republic, export growth has fluctuated from negative to strong growth, primarily because of movements in gold prices and exports of gold and petroleum products. In Tajikistan, exports of cotton and aluminum steadily increased as the economy continues to recover. In Uzbekistan, export growth picked up strongly in 2003 and 2004 on the back of higher prices for gold and cotton.
Weakness in the US dollar has resulted in deteriorating terms of trade for the CARs. Nevertheless, strong export earnings facilitated import growth, primarily of consumer goods and fueled economic growth and investment in goods related to major oil and natural gas. In this connection, import growth was particularly strong in the oil exporting economies. The lumpiness and timing of these investments created some mismatches between import demand and the foreign exchange earnings required to finance them. Despite this lack of synchronization import finance has not been a problem due to capital inflows, which financed some oil and natural gas investments, and the buoyancy of exports.
10
Current Status of Economic Development in the CARs 7
Table 2.5: Merchandise Export Growth (%)
1997– 2001
Value of Value of Manufactured Average 2002 2003 2004 Exports 2004 Exports 2003
$ Millions $ Millions Oil Exporters Azerbaijan 25.4 12.7 13.9 31.5 3,452 134.4 Kazakhstan 9.6 12.3 31.6 53.7 20,291 2117 Turkmenistan 27.9 9.0 10.7 9.0 3,444 225 Non-oil Exporters Kyrgyz Republic -1.1 3.7 18.5 23.8 731 193.1 Tajikistan -1.9 7.3 14.3 15.4 922 250.1 Uzbekistan -6.4 -8.4 29.1 22.3 3,961 785 CARs 8.9 8.2 25.0 38.9 32,801 3,704.6
Source: ADB ADO 2005 and Table 4.1.
The trade balance for the oil exporting CARs has been positive for the past few years primarily because of the strong trade surplus of Kazakhstan and, to a lesser extent, Turkmenistan (Appendix 2). Aside from Uzbekistan that accumulated a small trade surplus, the non-oil exporting countries of the region had small deficits on their trade accounts. On the capital account, oil exporting countries accumulated large deficits in some years as they made substantial investments in gold, oil, and natural gas projects. The non-oil exporting countries accumulated somewhat smaller current account deficits
Despite large foreign-funded investments in the minerals sector, the current account deficit for the region as a percent of GDP was still within acceptable limits at around 3% of GDP in 2003. Inflows of foreign direct investment (FDI) generally offset the current account deficit in most cases leaving the overall balance either in surplus or small deficit.
The boom has increased government revenue and has helped fiscal performance and reduced reliance on external borrowing. As a result, the total debt for the CARs has typically fallen as a percent of GDP. In 2004 the total debt of the region (aside from Kazakhstan) was just over $8 billion; it has not increased substantially since the late 1990s and has fallen relative to the late 1980s (Appendix 2).
There are also signs that foreign investors are beginning to take greater interest in the CARs. This is reflected by strong inflows into the oil-rich exporters. (Refer to Appendix 2). This is a classic example of natural resource seeking FDI (mainly from the United States, European Union (EU), and Russia) and has brought with it capital, foreign technology, and western management expertise to facilitate the efficient development of oil and gas exports. Most of Central Asia’s FDI since the mid-1990s has gone to Kazakhstan. Such FDI is concentrated in the oil and gas industry but has gradually spilt over into electricity, metals, manufacturing and banking. In the last 2 years, however, FDI flows to Azerbaijan dramatically increased to the extent that by 2003, FDI of $2.3 billion slightly exceeded that in Kazakhstan ($2.2 billion).
It is striking that FDI in the three non-oil exporting CARs is negligible, amounting to only $107.5 million in 2003. A lack of natural resources, high transactions costs due to landlocked terrains, vast distance from markets, and perceived political risk are among the explanations for limited FDI in non-oil exporting CARs.
Current Status of Economic Development in the CARs 8
2.6. Poverty
There seems a general consensus that between 1991 and 1995, poverty in the CARs increased. As ADB (2004b, 12) notes: “the major cause of poverty was the transition shock that resulted in large-scale loss of employment, income, and purchasing power in all CARs.” Underlying factors included the breakdown of Council for Mutual Economic Assistance production and distribution network, the collapse of the social security system, higher inflation caused by disruption in production of key goods and loss of control over the money supply, civil strife in several countries and migration of skilled Russians.
Although the data is very sketchy and there are issues of data consistency and reliability, national poverty line estimates suggest a decline in poverty in all CARs where data are available (see Table 2.6). Nevertheless the pace of decline has been slow and poverty remains quite high at about 40% of total population in the CARs as a group.11 Lower inflation rates, stronger growth, creation of new external trade linkages and restoration of social and political stability have been contributing factors to the decline in poverty in the CARs.
Table 2.6: Poverty and Income Distribution
National Poverty Incidence
(Population below poverty line, %) GINI Index
Share of bottom 20% of income recipients Earliest Latest Oil Exporters Azerbaijan 68.1 (1995) 49.6 (2001) 36.5 (2001) 7.5 Kazakhstan 34.6 (1996) 27.9 (2002) 31.3 (2001) 8.2 Turkmenistan — 29.9 (1998) 40.8 (1998) 6.1 Non-oil Exporters Kyrgyz Republic 51.0 (1997) 47.6 (2001) 29.0 (2001) 9.1 Tajikistan — 56.6 (2003) 34.7 (1998) 8.0 Uzbekistan — 27.5 (2000) 26.8 (2000) 9.2 CARs 39.9 33.2 8.0 Others Thailand 13.1 (1992) 9.8 (2002) 43.2 (2000) 6.1 Malaysia — 7.5 (1999) 49.2 (1997) 4.7 Indonesia 15.7 (1996) 18.2 (2002) 34.3 (2002) 8.4 Mongolia 36.3 (1995) 33.1 (1995) 44.0 (1998) — Source: ADB (2004a), World Bank (2005).
— = not available.
The latest estimates of national poverty lines show the following:
• Poverty is generally higher in the non-oil exporters than the oil exporters.
• With poverty incidence in excess of 50%, Tajikistan is the poorest CAR.
11
On the broader issue of achieving the Millennium Development Goals (MDGs), the CARs have made progress but there is an unfinished agenda. To quote an authoritative study: “…the countries of greatest concern are Tajikistan, Uzbekistan, Kazakhstan, and Armenia. The first two have high and increasing rates of malnutrition. Education standards have also slipped and the virtual collapse of the social sector in some countries has resulted in a general deterioration of health indicators” (UNESCAP-UNDP-ADB 2005), p. 3. The study calls for a reshaping of national and local institutions involved in service delivery to achieve the MDGs. Key issues include making services available, improving quality, reducing barriers to accessing services and broadening the range of providers.
Current Status of Economic Development in the CARs 9
• Azerbaijan (an oil exporter) and Kyrgyz Republic seem to have high poverty incidence in excess of 45%.
• In Kazakhstan, poverty levels are somewhat lower at around 28%, having come down from over 40% in the late 1990s.
• Uzbekistan and Turkmenistan (an oil exporter) also appear to have low poverty levels.
Rural poverty seems to be a significant problem in some CARs as the sector has absorbed many urban unemployed. Income disparities and poverty are more pronounced in some sub–regions (e.g. the Ferghana Valley and border regions of Kazakhstan, the Kyrgyz Republic, and Tajikistan). Despite these regional inequalities, overall income distribution figures suggest that income is reasonably equality distributed in the CARs with an average Gini coefficient of 33.2%. Furthermore, the share of the poorest 20% of the population at 8% is higher when compared with countries in Southeast Asia such as Thailand and Malaysia (see Table 2.5).
2.7 Short-Term Prospects (2005–2007)
The short-term prospects for the CARs seem bright indicating a continuation of the economic revival of recent years. According to the ADB’s Asian Development Outlook 2005 Update, for the next 3 years, economic growth in the CARs will be in the range of 9% per year. The highest growth rates in 2005–2007 are likely to be visible in the oil-rich economies (see Tables 2.1 and 3.2).
Accordingly, Azerbaijan is projected to grow at 18.5%, Kazakhstan at 8.2%, and Turkmenistan at 7.8%. Although inflation will rise somewhat, growth in the oil exporters will continue to be propelled by a combination of high oil and gas prices, buoyant international energy demand, inflow of FDI, and investments in modern infrastructure. In the non-oil exporters, growth will be somewhat slower.
Growth in the non-oil economies is projected to be in the range of 4.5% to 6.9% (see Table 3.2).12 Favorable prices for non-oil export commodities (e.g. cotton, gold, aluminum, and other metals), expansion in the services sector, and economic reforms underlie growth in the non-oil exporters. A mild recovery is expected in the Kyrgyz Republic fostered by higher gold prices, continuation of a pro-growth economic reform program, and higher foreign aid. Increased foreign investment in the natural gas sector in Uzbekistan as well as implementation of measures for private sector development (e.g. stronger legal protection for enterprises and banking sector liberalization) is expected to contribute to growth.
12 Our estimates for 2005–2007 are of similar magnitude to IMF estimates for 2005–2007 which were 7% for Kazakhstan, 5.5% for Kyrgyz Republic, and 7% for Tajikistan. See IMF (2005c, 2005d, and 2005e).
Mapping the Future: 2015 10
3. MAPPING THE FUTURE: 2015
3.1. Introduction
The pressing question facing the CARs is whether the boom that started in the late 1990s will continue beyond the next three years. While this is impossible to predict with certainty, we offer three possible scenarios for the CARs against a global background (see Box 3.1 and Appendix 3 for further details regarding the global background and forecasting method). The indicative scenarios are distinguished by the extent of action on the domestic policy front in regard to economic policy reform, competitiveness strategy and regional cooperation.
• Scenario 1 - business as usual - is assumes a moderate policy reform agenda, the relative lack of any competitiveness strategy and intermittent implementation of regional cooperation initiatives.
• In Scenario 2 - closing the gap - there is strong commitment to implementing further policy reforms, to developing market-friendly competitiveness strategy and aggressive implementation of regional cooperation initiatives.
• Scenario 3 - falling behind - assumes a moderate level of internal political instability, some backsliding of the policy reform agenda, a more inward-orientation of policies towards industry and limited regional cooperation.
The remainder of this chapter discusses each of these scenarios. The final section outlines some of the risks to the forecasts. To relate the forecasts to recent developments, Table 3.1 provides a summary of current performance of the CARs.
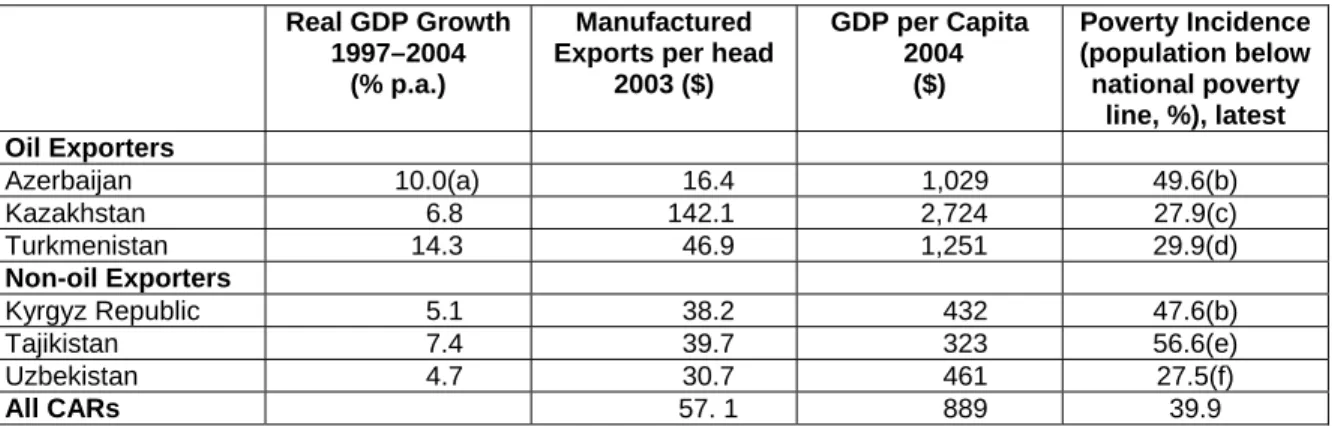
Table 3.1. A Summary of Current Performance
Real GDP Growth 1997–2004
(% p.a.)
Manufactured Exports per head
2003 ($) GDP per Capita 2004 ($) Poverty Incidence (population below national poverty line, %), latest Oil Exporters Azerbaijan 10.0(a) 16.4 1,029 49.6(b) Kazakhstan 6.8 142.1 2,724 27.9(c) Turkmenistan 14.3 46.9 1,251 29.9(d) Non-oil Exporters Kyrgyz Republic 5.1 38.2 432 47.6(b) Tajikistan 7.4 39.7 323 56.6(e) Uzbekistan 4.7 30.7 461 27.5(f) All CARs 57. 1 889 39.9
Notes: (a) 1999–2004, (b) 2001, (c) 2002, (d) 1998, (e) 2003, (f) 2000
Mapping the Future: 2015 11
Box 3.1: Global Background
Our assumptions regarding the global background are as follows. Growth in the world economy over the next decade will depend upon a number of interrelated factors including the price of oil and developments in industrial economies. Our baseline predicts that the world economy will grow at an average annual rate of around 3.2 percent for the next decade. This is closer to the historical rate of growth in the world economy than the rapid rate of growth of 4 percent achieved in 2004. In the energy market adjustments in both supply and demand suggest that prices for oil will retreat from current levels to the range of $40 – $45 per barrel over the next decade. Other commodity prices (gold, cotton, aluminum, natural gas) are also expected to be favorable. PRC and India will increase their strength as regional economic powers. Both economies are projected to continue their robust economic performance, growing at average rates of close to 8 percent and 7 percent respectively over the next decade. The outlook further assumes that there will be growing investor confidence and that FDI flows to developing regions (including the CARs) will increase. This assumption is consistent with a continuation of the agenda of policy reforms that has already begun. Finally, relative political stability will continue in the CARs and throughout the world.
3.2. Scenario 1 – Business as Usual
Economic policy reform will continue in both oil and non-oil exporters at a moderate pace. This means that there will be changes in some areas but gaps in others. In the oil economies, this means that reform of trade relations with the rest of the world and the World Trade Organization (WTO) membership will proceed over time. Small scale privatization will also be gradually implemented while large scale privatization and corporate governance will make less progress. Financial sector liberalization and development will lag. In the non-oil economies, variable progress will be made in trade reform and price liberalization but financial sector liberalization and competition policy will lag.
Regional cooperation initiatives in transport, trade and energy will be implemented intermittently. In the area of transport, harmonization of transport regulations and cross-border trade will continue gradually while the development of a modern railway system and integration of the road network will proceed albeit at a moderate pace. In trade facilitation, improvements will be visible in customs codes and clearance over time but less progress will be observed in implementing best practice trade facilitation such as a uniform information system and single window inspection. Residual non-tariff measures (e.g. technical barriers to trade and sanitary and phytosanitary measures) on intra-regional trade will remain. In the energy sector, structural reform to unbundled components of the power sector (e.g. transmission generation and distribution) will be slow. Tariff reform including transfer pricing issues including shadow pricing of water will be constrained by political factors. Rehabilitation of regional energy infrastructure particularly cross-border lines will take place on a bilateral basis.
Competitiveness policies will be generally under-emphasized. The details of the forecast are presented in remainder of this section.
3.2.1. Growth
GDP growth in the region is likely to be robust, exceeding 5% per year in all the CARs in 2005–2015. Within the CARs, there will be increased divergence in economic performance as the three oil- rich economies will grow more rapidly than the non-oil economies. Azerbaijan is expected to grow the fastest at around 10% annually and Uzbekistan the slowest (about 5% per year). In between these, Kazakhstan is likely to grow at 7.1%; Tajikistan 6.0%, Turkmenistan 5.6%, and Kyrgyz Republic 5.6% (see Table 3.2). These long-range forecasts and the theme of
Mapping the Future: 2015 12 divergence between oil and non-oil exporters are consistent with those of the IMF.13 This is a strong performance for developing countries in general and even by comparison with Asian transition economies such as Viet Nam, Cambodia, and Laos. There will be significant potential for structural changes and a number of opportunities for trade and international investment in manufacturing and in the booming oil and gas industry.
Table 3.2: Scenario 1 Real GDP Baseline Growth Forecasts to 2015 (%)
Country 2005–2015 2005–2007 Oil Exporters Azerbaijan 10.3 18.5 Kazakhstan 7.1 8.2 Turkmenistan 5.6 7.8 Non-Oil Exporters Kyrgyz Republic 5.6 4.5 Tajikistan 6.0 6.9 Uzbekistan 5.2 5.8
Source: ADB ADO 2005 for estimates from 2005–2007. Staff estimates for remainder of forecast period.
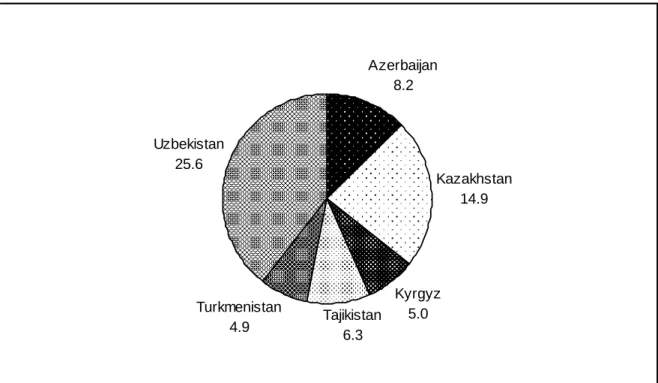
The total population in the CARs will be around 75 million by 2015 (see Table 3.3), which is about 10 million more than in 2004. Uzbekistan (with 28.1 million people) will remain the most populous country in Central Asia, followed some way behind by Kazakhstan (with 18.1 million) and Azerbaijan (9.7 million). Population growth in the CARs is likely to be quite slow during 2003–2015. During the Soviet era, family planning birth control and abortion were used to maintain a modest rate of population growth. These practices have continued. Combined with an aging population and some out-migration of younger people, birth rates and population growth remain low. Population projections vary from 1 percent growth in non oil exporters to between 1.5 percent and 2.3 percent in oil exporters. This compares with higher rates of around 2% for many other low-and medium-income developing countries14. These demographic trends highlight several economic implications for the CARs. On the one hand, growth in incomes can be more effectively translated into higher per capita income. On the other hand, domestic markets may grow slowly in the future, reflecting a small base of consumers and producers. Regional cooperation and multilateral liberalization offer opportunities to access more dynamic markets. There may also be skills shortages as the demand for skilled manpower in key industries exceeds limited supplies, already exacerbated by outward migration. This could lead to calls for liberalization of labor markets to attract adequate supplies of skilled labor. Furthermore, as the population ages, more attention needs to be paid to social security provision.
13
Under Scenario 1, our simple average GDP growth forecasts (2005–2015) for oil and non-oil exporters are about 8.2% and 5.7%, respectively. This confirms the trends in ADB (2004b) which projected real GDP growth of 8.1% per year in oil rich CARs and 4.1% per year in non-oil CARs during 2002–2015. Our annual average GDP growth forecasts for Kazakhstan (7.8%) and Tajikistan (6.5%) for 2005-2010 are also in the same range as the International Monetary Fund (IMF’s) medium-term projections (2005–2010) which were 7.5% for Kazakhstan and 5.6% for Tajikistan. However, our forecast for Azerbaijan (14.3%) for 2005–2010 is lower than the IMF figure of 21.8%. The difference in the case of Azerbaijan reflects different assumptions about the impact of the oil sector on overall economic growth. For details of IMF forecasts, see IMF (2004c, 2004d and 2005).
14
In ADB (1997), Table 3.4, p.154, the growth rate of the active population for other Asian regions is projected to be around 2.9% in Southeast Asia and South Asia between 1995 and 2025.
Mapping the Future: 2015 13
Table 3.3: Population Forecast to 2015a (in millions) Country 2004 2015 Oil Exporters Azerbaijan 8.2 9.7 Kazakhstan 14.9 18.1 Turkmenistan 4.9 6.3 Non-Oil Exporters Kyrgyz Republic 5.0 5.6 Tajikistan 6.3 7.0 Uzbekistan 25.6 28.1 Total 64.9 74.8
Source: World Bank, World Development Indicators Online for historic data and staff estimates for forecasts.
a
Population projection is based on trend line estimate of population growth. Kazakhstan’s population estimate for 2015 was adjusted upward to reflect expected inward migration.
Average per capita income for the CARs of $1,871 in 2015 will place the region within the ranks of today’s middle-income economies (see Table 3.4).15 However, there will be significant variation within the region with the oil-rich economies, led by Kazakhstan, having per capita incomes nearly six times higher than those of the non-oil economies. With a per capita income of $4,807 by 2015, Kazakhstan will approach the status of an upper middle-income country. For the other two oil-rich economies, per capita income will be comparable to the current per capita income of Russia and Thailand. Tajikistan (per capita income of $552) will remain the poorest CAR and be among the ranks of the today’s low income countries ($450 per head). With around $700 per head, the Kyrgyz Republic and Uzbekistan will be somewhat higher and will have graduated out of the category of low income countries. Nevertheless, they will remain relatively poor countries in terms of per capita income levels. These forecasts highlight the impact of successful exploitation of oil and gas resources and indicate that divergence in the economic prosperity between oil and non-oil rich economies will increase. They also underline the likely emergence of Kazakhstan as a regional growth pole with the potential to drive expanded trade and investment relationships with other CARs16. Kazakhstan and the two oil-rich economies will also increasingly become a magnet for labor migration from poorer CARs. For the non oil economies of Tajikistan, Uzbekistan and the Kyrgyz Republic, there will be a continued need for external assistance to raise incomes and reduce the impact of poverty.
15
Zhukov (2000), p. 254, says that to restore income to 1990 levels, the CARs will have to grow at between 4.5 and 5% per year until 2015.
16
ADB (1997) projects much higher growth between 1995 and 2025 under an open economy policy regime. For example, per capita income growth in Southeast Asia is 5.1% versus 2.9% in an open economy policy regime versus a closed policy regime.
Mapping the Future: 2015 14
Table 3.4: Scenario 1 GDP Per Capita Forecast to 2015 (US$)
Country 2004 2015 Oil Exporters Azerbaijan 1029 2602 Kazakhstan 2724 4807 Turkmenistan 1251 1790 Non-Oil Exporters Kyrgyz Republic 432 739 Tajikistan 323 552 Uzbekistan 461 733 Total 889 1871
Source: Table A1.1 for historic data and staff estimates based on GDP and population forecasts in previous tables.
3.2.2. Structural change
Structural changes will occur as a result of increased exploitation of the mineral resource base and the process of industrialization that is projected to continue. By 2015, total oil and gas exports from the oil-rich CARs will amount to about $32 billion, a nearly threefold increase from export value of about $12 billion today.17 Oil and gas exports will continue to be the main drivers of economic growth and dynamism in the three oil-rich economies (see Table 3.5). Proven reserves of oil and natural gas should be sufficient to maintain current and projected future rates of extraction for between 25 and 60 years in the three oil exporting economies. Growth in oil and gas exports will be strongest in Azerbaijan, following the opening of the Baku-Tbilisi-Ceyhan (BTC) pipeline to Turkey. This pipeline opens up the European oil market to Azerbaijan and potentially also to Kazakhstan. The BTC pipeline will provide an alternative oil shipment route to Europe avoiding the high transit charges levied by the Russian Federation. Oil sector growth will slow somewhat in the medium term as prices for oil and gas stabilize at around $40-45 per barrel and output growth slows as existing pipeline capacity is more fully utilized. Nevertheless, the oil and gas sector will grow faster than GDP in all oil exporting countries.
Table 3.5: Scenario 1 Oil and Gas Exports—Projection to 2015 (in billion US$)
Country 2003 2015
Azerbaijan 2.25 6.40
Kazakhstan 7.02 21.19
Turkmenistan 2.94 4.74
Total 12.21 32.33
Source: IMF (2004c), IMF (2004e), and IMF (2005a) for historic data. Staff estimates for forecasts.
Economic diversification will continue at a more rapid pace through the expansion of manufactured exports (see Table 3.6). Total manufactured exports will nearly treble by 2015 to about $9.4 billion.18 This is equivalent to about one third the value of oil and gas exports of the region. The region’s manufactured export base will continue to be dominated by Kazakhstan ($4.8 billion) and Uzbekistan ($2.5 billion). Kazakhstan will continue to have the highest
17
These projections were based on forecasts of oil prices, production capacity, proven reserves, and anticipated developments in transportation (e.g. pipelines).
18
The projections for manufactured exports and manufactured exports per head in 2015 were derived using historical estimates of elasticities of manufactured exports with respect to GDP growth. The non-oil economies typically have a higher elasticity owing to their comparative advantage in labor-intensive manufacturing production along with lower factor costs.
Mapping the Future: 2015 15 manufactured exports per head. Turkmenistan comes next. Azerbaijan remains the smallest exporter in terms of manufactured exports per head. Capital-intensive petroleum products like plastics and petrochemicals, metal products, engineering goods, and some textiles and garments are likely to underlie this manufactured export growth. There is also likely to be diversification of export markets away from Russia as demand from the PRC and India grow rapidly. Industrialization and structural change will result in a wider variety of products being produced for regional and international markets, help boost per capita income, and result in job creation.
Table 3.6: Scenario 1 Manufactured Exports—Projection to 2015
Country Manufactured Exports 2003 (mn$) Manufactured Exports 2015 (mn$) Manufactured Exports per head ($) 2015a Oil Exporters Azerbaijan 134.4 345 37.4 Kazakhstan 2,117.0 4,822 299.5 Turkmenistan 225.0 831 136.2 Non-Oil Exporters Kyrgyz Republic 193.1 333 57.4 Tajikistan 250.1 589 83.0 Uzbekistan 785.0 2,518 82.3 Total 3,704.6 9,437 126.0
Source: Table 4.1 for historic data and staff estimates for forecasts.
a Manufactured exports in 2015 based on projections using most recent exports estimates and staff estimates of elasticities of
manufactured export growth with respect to GDP growth.
3.2.3. External Sector
The external sector projections focus on the three non-oil exporting countries (the Kyrgyz Republic, Tajikistan, and Uzbekistan). This is because the external sector accounts for the three oil-producing countries are dominated by oil and gas. As a result, these countries have high enough incomes and sufficient foreign direct investment to go to capital markets for additional resources. They are not potential borrowers from the multilateral institutions as their financing gaps, if any, can be met by private sector borrowing. The current account deficit is projected to increase in the Kyrgyz Republic and Tajikistan. These current account deficits will be modest in size, ranging from $200 million per year in the Kyrgyz Republic to $70 million in Tajikistan for the period 2011–2015. This is because imports demand growth to meet various infrastructure and manufacturing project requirements as well as for some consumer goods is projected to be somewhat stronger than the expansion of exports proceeds (see Table 3.6). Growth in the current account deficit will be constrained by already high levels of external debt and limited sources of finance for the Kyrgyz Republic and Tajikistan. In Uzbekistan, the current account balance is projected to remain in surplus over the forecast period as a result of stronger export growth to the Chinese market and continued slow growth in imports. Structural factors and a restrictive policy environment that discourages trade liberalization will also inhibit more rapid import growth.
Mapping the Future: 2015 16
Table 3.7: Scenario 1 External Accounts—Projections to 2015
Kyrgyz Republic Tajikistan Uzbekistan
Indicators Balance of Payments Projections Balance of Payments Projections Balance of Payments Projections 2000– 2004 2005– 2010 2011– 2015 2002– 2004 2005– 2010 2011– 2015 2001–2004 2005– 2008 2011– 2015 Current account balance ($mn) -45.8 -108.3 -200.0 -29.3 -55.7 -70.0 432.8 558.8 400.0 Foreign Direct Investment (net) ($mn) 31.8 60.0 125.0 29.3 48.3 75.0 73.4 87.5 120.0 Financing gap (-) ($mn) 0.0 -60.5 75.0 0.0 1.1 33.0 -152.4 -48.0 80.0 Total outstanding debt as % of GDP 75.4 54.7 45.0 69.3 53.9 40.0 40.0 29.5 22.0
Source: IMF estimates and staff estimates.
FDI is expected to rise slowly as the external policy environment improves in the Kyrgyz Republic and (to a lesser extent) in Tajikistan (see Table 3.7). Annual FDI inflows of $125 million in the Kyrgyz Republic and $75 million in Tajikistan, while modest in size by international standards, will help to offset the rising current account deficit and should contribute to growth technology transfer and productivity gains in industry. In spite of slower reforming policy environment, Uzbekistan is expected to keep inflows of FDI growth to around $120 million per year. This is in large part due to foreign direct investment in the country’s natural gas sector.
Total outstanding debt as a percent of GDP is expected to decline slowly in the Kyrgyz Republic and Tajikistan and more rapidly in Uzbekistan (see Table 3.7). The drivers for debt reduction are increased inflows of FDI in all three non-oil economies, debt restructuring in the Kyrgyz Republic and possibly Tajikistan, remittances in Tajikistan, and the use of some trade and current account surplus to reduce external debt in Uzbekistan.
3.2.4. Poverty
Rapid growth in income will facilitate a sustained reduction in poverty in the CARs over the forecast period. As a whole, the incidence of poverty will fall from 40% today to about 25.1% in 2015 (see Table 3.8). This means that around 11 million more people will be taken out of poverty as a result of strong economic performance. While still high, this rate of poverty is around the current level of poverty in Poland today and slightly less than the current rate of poverty in the Russian Federation. Non-oil economies will be relatively more responsive to changes of income than oil exporters due to elasticity effects. 19 The poorest countries in 2015 will remain Tajikistan, Kyrgyz Republic, and Azerbaijan (with about a third of their population
19
A crucial aspect of the poverty projection for 2015 was the elasticity of poverty reduction with respect to GDP growth. The reported poverty estimates are somewhat conservative considering the development experience of other Asian economies. Oil exporting countries were assumed to have lower poverty elasticities due to the capital intensity of oil sector and industrial production. Meanwhile, non-oil exporting countries are assumed to have higher elasticities due to the labor-intensive nature of production. This means that non-oil economies will be relatively more responsive than oil exporters to changes of income. Remittance income from overseas workers in the non-oil economies are also taken into account in making poverty assessments for the future. These projections were based on historical information for the CARs, staff estimates of structural change in the poverty-income relationship over time and poverty elasticity’s for other Asian countries. On other Asian Countries and other developing countries in general, see Dowling and Valenzuela (2004), Adams and Page (2004).
Mapping the Future: 2015 17 below the poverty threshold). These are followed by the other three CARs which have been able to bring poverty down to the range of 18%–22%. In all the CARs, rural poverty will remain higher than urban poverty while pockets of urban poverty are likely to persist. The analysis of future trends in poverty suggests that high rates of rural poverty will continue to stimulate rural to urban migration and that international migration is likely to continue at a significant rate. Even though poverty reductions will be substantial, some of the poorer CARs will need to devote more resources to reducing poverty by expanding current programs to fight poverty and developing new programs to address the needs of specific target groups. Developing labor-intensive sectors such as agriculture and tourism would also contribute to poverty reduction.
Table 3.8: Scenario 1 Poverty Baseline Forecast to 2015
Country Year of National Poverty Estimate Poverty Incidence in Base Yeara Forecast Poverty Incidence 2015b Oil Exporters Azerbaijan 2001 49.6 29.7 Kazakhstan 2002 27.9 18.0 Turkmenistan 1998 29.9 21.9 Non-Oil Exporters Kyrgyz Republic 2001 47.6 30.1 Tajikistan 2003 56.6 33.2 Uzbekistan 2000 27.5 17.8 Total 39.9 25.1
Source: ADB (2004a) for historical data and staff estimates for forecasts.
a National Poverty Lines. b
Poverty incidence in 2015 based on projections using most recent poverty line estimates and staff estimates of elasticities of poverty reduction with respect to income.
In order to facilitate comparisons with other possible outcomes which are discussed as Scenarios 2 and 3 below, the outturn from Scenario 1 (Table 3.9) summarizes the performance of the CARs in four respects – GDP growth, GDP per capita in 2015, poverty incidence in 2015 and the US dollar value of manufactured exports per head in 2015. These variables can be compared with historical performances reported in Table 3.1.
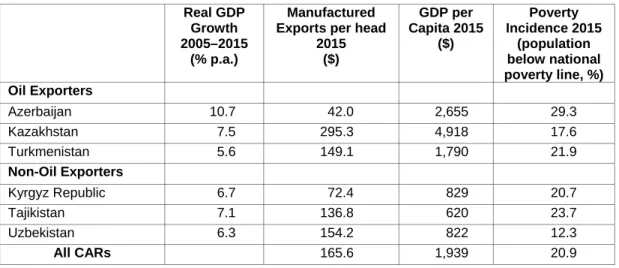
Table 3.9: Summary of Scenario 1 – Business as Usual
Real GDP growth 2005–2015 (% p.a) Manufactured Exports/ per head 2015 ($) GDP per Capita 2015 ($) Poverty Incidence 2015 (population below national poverty, %) Oil Exporters Azerbaijan 10.3 35.5 2,602 29.7 Kazakhstan 7.1 266.4 4,807 18.0 Turkmenistan 5.6 131.9 1,790 21.9 Non-Oil Exporters Kyrgyz Republic 5.6 59.4 739 30.1 Tajikistan 6.0 84.2 552 33.2 Uzbekistan 5.2 89.6 733 17.8 All CARs 126.2 1,871 25.1
Mapping the Future: 2015 18
3.3. Scenario 2 – Closing the Gap
Economic policy reforms will accelerate in all the CARs and evidence of a market-economy will be widespread. In the oil economies,