Framework of Asset Characteristics, Asset
Environment, Lifecycle Phases,
and Management
T. E. Van der Lei, Y. C. Wijnia and P. M. Herder
Abstract In 2007 ‘‘the state of asset management in the Netherlands’’ for infra-structures was established by a national study conducted by the Next Generation Infrastructures research programme (NGInfra). This study showed that within the Netherlands different interpretations of asset management exist. The way asset management is implemented in practice differs widely. Differences included tools, processes, organizations and value systems. Within the EURENSEAM network, a European network of asset management research groups, an asset overview was created in November 2009 consisting of the characteristics of the assets and the context of the assets, and the asset lifecycle phases. We have developed this overview into a framework and interviewed Dutch asset management practitioners. The intention was to see if the practitioners could fill in the framework and relate to it. In this paper we report the findings of these interviews and discuss this onset for an asset management framework that allows for the comparison of different perspectives on asset management. Foreseen future work is the development of taxonomies for assets and for asset management.
T. E. Van der Lei (&)Y. C. WijniaP. M. Herder
Section Energy and Industry, Delft University of Technology, Jaffalaan 5, 2628 BX, Delft, The Netherlands
Y. C. Wijnia
D-Cision bv, PO box 44, 8000 AA, Zwolle, The Netherlands T. E. Van der LeiP. M. Herder
Next Generation Infrastructure Foundation, Delft, The Netherlands J. Mathew et al. (eds.),Engineering Asset Management and
Infrastructure Sustainability, DOI: 10.1007/978-0-85729-493-7_42, Springer-Verlag London Limited 2011
1 Introduction
As many asset management professionals have experienced, different interpreta-tions of asset management exist. What is considered asset management and how it is practiced differs widely. Asset management can, for example, be seen as a way to professionalize operation and maintenance—a bottom up strategy. This view is held by professionals in operation and maintenance. Conversely, the correspond-ing top down view sees asset management as a performance strategy. The strategic asset management view is held by management professionals. Finally, asset management can be seen as way to add value to delivered (public) services. This view belongs predominantly to service provides [1].
Asset management is however also viewed as a holistic approach. The generic asset management norm for asset management PAS 55 for example illustrates this view. PAS 55 was developed in the United Kingdom by an industry working group led by the Institute of Asset Management. It is a management standard for orga-nizations where physical assets are key for organizational success. Asset man-agement is defined in the PAS 55 as
systematic and coordinated activities and practices through which an organization opti-mally and sustainably manages its assets and asset systems, their associated performance, risks and expenditures over their life cycles for the purpose of achieving its organizational strategic plan [2].
The definition shows that asset management is seen as the whole of activities the organization undertakes to achieve its organizational strategic plan. The assets are managed in such a way that their purpose is to achieve the organizational strategic plan. In this view the assets are central to the operational success of organization.
In general, one can say asset management activities aim to get the most value out of the physical assets of an asset intensive organization—where value is related to the organizational goals of a company. PAS 55 is, for example, rapidly becoming the accepted standard for asset management. The initiative has been taken to translate the PAS 55 into an ISO standard.
Creating generic asset management approaches like the PAS 55 or an ISO norm would be a futile exercise if asset management interpretations differ too greatly. The resulting norm runs the risk of becoming too generic. In such a case, different industries will generate underlying norms for their specific asset types. That is, translate the norm to their own type of assets, like the Dutch NTA 8120 for the electricity and gas distribution companies [3].
A reason for the existence of different asset management concepts might therefore be driven by the nature of the different assets. That is, different types of asset may need specific asset management activities. On an institutional level, Finger et al. [4] have already argued that the relationship between the technical and institutional coordination of institutions should not be ignored and have put forward coherence theory. Coherence theory argues that infrastructure perfor-mance depends on the amount of coherence between the technical and institutional
design. Komonen [5] for example agues that different business environments propose different requirements for specific assets and influence the asset man-agement strategies of a company. Subsequently, Schuman and Brent [6] acknowledge the relationship between assets and management and connect the asset life cycle to a project management framework as basis for their asset life cycle management model for the process industry.
In this paper, that describes work in progress, we assume that asset management is a single approach that is implemented differently in different industries. That is, asset managementimplementationdiffers in a number of ways and depends on: the characteristics of the assets and the environment of the assets, in relation to the most relevant lifecycle phases and management of the organizations.
The premise was that we can present different asset management approaches and practices in a generic framework that makes sense to practitioners. The framework was verified amongst the practitioners of the Asset Management Platform that is run by the Next Generation Infrastructures research programme (NGInfra). This framework describes the asset characteristics, the environment, the most important questions regarding the asset lifecycle and the organization of the management. For this we conducted three interviews with different type of organizations: a port authority, a distribution company of electricity and gas, and an integrated water company. In this paper we discuss the findings of these interviews and reflect on the developed framework.
2 Method
During the Eurenseam network (a network of asset management research groups) meeting in Seville in November 2009 experts from the Eurenseam network for-mulated asset characteristics [7]. The following asset characteristics were defined: 1. Function: commercial versus public
2. Time Scale: short (weeks) versus long (50 yr+)
3. Location: fixed versus moving and point versus distributed 4. Economic/technical assets: relative importance of assets 5. Environment (external effects)
6. Technology (mechanical, civil, electrical, software) 7. Timescale: split into life span and reaction time 8. Market behavior: stable/dynamic
9. Technology development: fast/slow
Furthermore the asset life cycle was found to be a key leading principle. The asset life cycle phases that were mentioned are: concept, design, manufacturing, assembly, commissioning, operation and maintenance, and disposal.
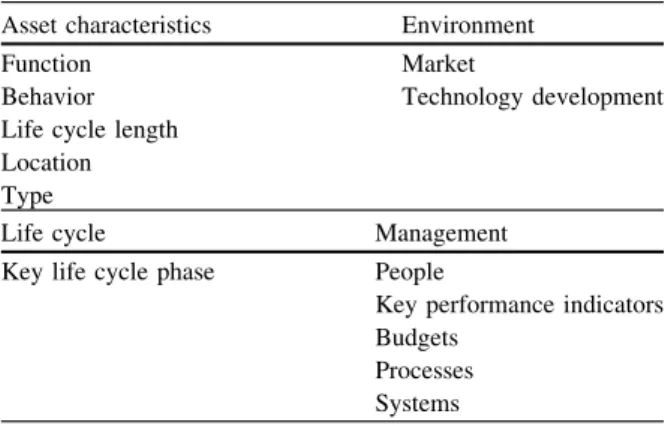
We translated the results into a framework with four quadrants: function and type, context, key question for asset and management (see Table1). These quadrants were
inductively developed based on the list of asset characteristics and the life cycle being a leading principle.
The first quadrant asset characteristics focuses on characteristics of the asset itself. From the developed list we placed the asset characteristics 1, 3, 6, and 7 in this quadrant. We added the characteristic location to indicate if the asset is fixed (like a plant) or moving (like a car) and a point asset (again like a plant) or distributed (like roads). The quadrant thus consists of the following elements: • Function: public or commercial
• Location: fixed/moving and point/distributed • Type: mechanical, civil, electrical, software • Length of life cycle
• Behavior: discrete, continuous or passive
The second contains the characteristics that relate to the environment of the asset and can be considered as external effects regarding the asset (5). These characteristics are: the market (8) of the asset that can be stable or dynamic, and technology development (9) which can be fast or slow. The third quadrant is devoted to the life cycle of the asset. We added the characteristic ‘‘key life cycle phase’’ to indicate the key life cycle phase of the asset. For example, one could say that the design of mobile phones is a distinguishing life cycle phase as the design (including features) determine potential later sales. Maintenance could be con-sidered less important as maintenance is hardly done. That is, one usually buys a new mobile phone when its starts to malfunction. The asset characteristics 2 and 4 were not added to the quadrants as they over lapped with 6 and the life cycle.
The fourth and final quadrant ‘‘management’’ that was added is not based on the characteristics listed. It aims to assess the institutional environment around the asset. We added it based on the idea Finger et al.[4] put forward that institutional coordination mechanisms are of influence of infrastructure performance. Finger et al.however formulate coordination mechanisms at the system level our view is on the asset level and the subsequent mechanisms that influence the assets. Table 1 Asset framework
Asset characteristics Environment
Function Market
Behavior Technology development Life cycle length
Location Type
Life cycle Management
Key life cycle phase People
Key performance indicators Budgets
Processes Systems
We therefore determined the following elements: people, key performance indi-cators, budgets, processes, and systems.
The goal of the study is to asses if the different asset management approaches and practices of different companies can captured with the developed framework in a way that makes sense to practitioners. The framework was filled out in interviews with practitioners of the Asset Management Platform from three dif-ferent companies. The companies were chosen for their diversity in assets as the idea was to cast a wide net regarding different types of assets studied. We inter-viewed asset managers from the port authority of Rotterdam, a energy distribution company and a large integrated water company.
3 Results
Below we illustrate some of the matrices that were made for the different assets of the asset intensive companies. InSect. 4discuss the results of the interviews.
3.1 Port Authority of Rotterdam
The port of Rotterdam is a large infrastructural hub in the Netherlands and the port with the highest throughput in Europe followed by Antwerp and Hamburg. The assets of the Port of Rotterdam represent a value of 2.5 billion Euro’s [8]. The Port of Rotterdam is managed by the port authority. The organizational goals of the port authority of Rotterdam are as following:
• To develop in partnership a world class European harbor
• The exploitation of the harbor and industry area of Rotterdam (privately exploited)
• The navigation of shipping traffic (safe, quickly, clean, secure) (public task) When asked the most important assets of the port authority were defined as follows: the quays of the ships, concrete constructions, roads, vessels, traffic system, dredging compartments, and a large silt depot. All these assets need to be maintained for the port to be able to provide its services. The asset framework was filled out for four typical assets: the quays of the ships, roads, vessels and dredging compartments. For space reasons we will illustrate the asset framework of the quays and dredging compartments (Tables2and3).
3.1.1 Quays
Table2illustrates the asset framework of the quays. The function of the quays is to support the mooring of ships that carry cargo so that they can load and unload.
The quays also have a dike function and need to be strong enough to support the crane lanes that allow for the transshipment of the cargo. For the largest part the 80 km of quays are commercially exploited. That is, the quays are contracted for a certain period of time, e.g. 25 years, to clients. The quays are a fixed passive asset with a typical life cycle of 40–50 years. This does not mean that the quay is no longer functional after this period of time but marks the moment to down rating of the quay. Although quays could be described as point assets, quays can best be described as line assets that are distributed in the area.
Regarding the environment of the quays, the market of quays is relatively stable with long term (e.g. 25 years) contracts. On the long term the market does show some dynamics as the ships increase in size and therefore require higher quality quays. That is, better reinforced quays that can withstand the forces of larger ships. There is a slow technological development regarding the quays. The port authority is for example experimenting with the idea of floating quays.
The dominant life cycle phases are the design phase and the maintenance phase. Key questions for the quays in the design phase are related to the design Table 3 Asset framework of dredging compartments
Asset characteristics Environment
Function: commercial, accessibility of harbors by ships Market: stable
Behavior: passive Technological development: none Life cycle: unlimited
Type: fixed, distributed, point asset Life cycle Management
Design Separate department, zero based budgeting, own budget per compartment Maintenance Key performance Indicator: maintenance condition (depth compared to norm)
water depth versus costs Comply to legislation Table 2 Asset framework of quays
Asset characteristics Environment
Function; Commercial: mooring of ships/support of crane lanes/dike function
Market: relatively stable Behavior: passive
Technology: slow development Life cycle: 40–50 years
Type: civil asset, fixed, line asset Life cycle Management
Design Quays have a separate department Maintenance Own budget (per quay)
Key performance indicator: availability of quays (timing maintenance) Performance indicator: comply to the functional requirements/norms
requirements like the size of ship that will be mooring, or the type of transshipment that will take place on the quays (crane/crane lane/way of transport). Real option questions in the design can be discerned, and relate to possible over dimensioning of the stages. The key question for the maintenance phase is the optimalisation of the inspection intervals. Inspections are done on the functional specifications. The asset is inspected visually with divers, with sensors, and through condition determination. Also cathodic protection is applied to control the corrosion of metal surfaces.
Regarding the management of the quays. Within the port authority the quays have been placed in a separate department. Each quay has an own budget. The key performance indicator of the quay is the availability of the quay. The performance indicator is to comply with the functional requirements/norms.
3.1.2 Dredging Compartments
Table3 represents the results for the dredging compartments. The dredging compartments are ‘‘squares’’ on the bottom of the river that need to be deep enough for the ships to reach the harbors. Dredging compartments are thus ‘‘natural’’ assets. Like the quays, their function is commercial but public from the point of view of safety—the avoidance of accidents. Dredging compartments are passive assets. Contrary to the quays, the life cycle of the dredging compartments can be considered (nearly) unlimited. Dredging compartments are squares that can be considered as fixed point assets that are distributed in the river.
The market of the dredging compartments can be considered as the demand and supply of the depth of the compartments. The market is stable as the depth requirements of the different compartments are fairly stable. On the long term the ships will become larger which requires deeper water. There is no technological development regarding the asset—the silt on the river ground. Nevertheless there is some dynamics; the silt from the river is becoming cleaner as the Kali mines in France have been closed. A consequence is that the processing of the silt is becoming cheaper.
As with the quays, the key life cycle phases are design and maintenance. For the design the key question is how deep the dredging compartment should be. Inspection is done preventive, by examination of the depth of the compartment. Key question regarding maintenance is inspection frequency, and the time main-tenance should take place. Depending on the location of the dredging compart-ment, dredging takes place once per 2 years till three times a year. Real options in dredging depth would be to dredge deeper than necessary.
Like the quays, the dredging compartments are part of a separate department. Each dredging compartment has its own budget (zero based). The key performance indicator is the maintenance condition, the depth of the compartment compared to the norm. The results showed that the port authority is a very compartmentalized company. All important assets are managed by separate departments.
3.2 Energy Distribution Company
We also interviewed a Dutch energy distribution company that is responsible for part of the Dutch electricity distribution and gas distribution networks. Contrary to the port authority, that can be considered an infrastructural hub, the energy dis-tribution companies manage infrastructural networks. These networks cover large areas of the country. The company we interviewed is responsible for 380,000 connections of customers and employs about 100 full time people [9]. The overall goal of the company is to guarantee the availability, safety, and sustainability of the networks. In light of these goals the company for example aims to realize 10,000 charging points for electric cars in the coming years. When asked the most important assets of the company wee defined as follows: pipelines, cables, security assets (50/10 kV), switches, pumping stations for gas, transformers, and measuring stations. The asset framework was filled out for three typical assets of the com-pany: pipelines, cables, and security assets (Table4).
3.2.1 Gas Pipelines
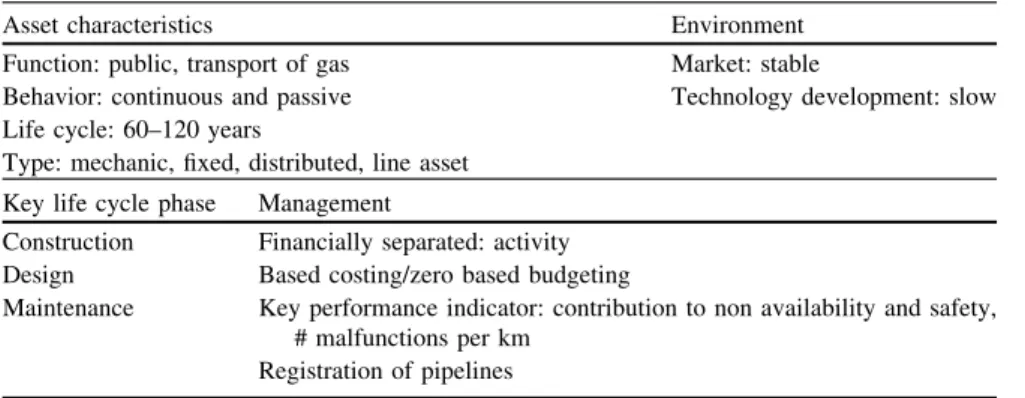
Regarding the characteristics of the gas network, the primary function of the pipelines in the gas network is, obviously, the transport of gas. The company transports two types of gas: high caloric and low caloric gas. The transport of gas is continuous and the pipeline itself is passive as it does not comprise any moving parts like, for example, a car engine. The expected life cycle of the pipelines is 60–120 years, contributing to a very stable market, and the prognosis of the lifespan is still growing. Pipelines are a fixed line asset that lie distributed throughout the country. The pipelines including the valves are furthermore mechanical assets.
Table 4 Asset framework of gas pipelines
Asset characteristics Environment
Function: public, transport of gas Market: stable
Behavior: continuous and passive Technology development: slow Life cycle: 60–120 years
Type: mechanic, fixed, distributed, line asset Key life cycle phase Management
Construction Financially separated: activity Design Based costing/zero based budgeting
Maintenance Key performance indicator: contribution to non availability and safety, # malfunctions per km
Regarding the life cycle of the asset, the key life cycle phases are construction, design, and maintenance. Design for example includes the choice of material of the pipelines. Maintenance is done by looking for gas leaks and applying cathodic protection. Furthermore, the valves of the pipelines are inspected in regular intervals.
The network company has an asset management department in which the pipelines have a financially separate position. Contrary to the port authority the asset is managed in a department that manages more assets. The costing model that is used is activity based costing with zero based budgeting. The key performance indicator of the asset is its contribution to non availability and safety measured in the number of malfunctions per km. The company furthermore registers the pipelines, their location, and specifications and depth.
Table5 represents the results of the security assets. The function of security assets is public, security assets protect other assets as they are able to selectively switch off parts of the network in order to contain and restrict black outs. Security assets are therefore continuously active. The life cycle of the assets is 10 years. Security assets are fixed electric assets distributed on points.
The market and technology development for security assets is much faster that for the other asset types. Although the company is faced with a discord between the development of the current security concept in contrast to a new concept like local intelligence/local control.
Key life cycle phases are design which also includes the type of materials used, construction, and maintenance (only supervision at the institute). In the future possible self diagnosis, plug and play concepts will be developed for the assets as two-way-traffic demands more functionalities of security (including conceptual changes).
Within the asset management department the security assets are financially separate. For the security assets activity based costing and zero based budgeting are applied. The key performance indicator of the asset is its contribution to non availability measured in the number of incorrect switches.
Table 5 Asset framework for security assets
Asset characteristics Environment
Function: public, goal: protection of the asset and the restriction of the black out
Market: dynamic Behavior: continuous
Technology development: fast Life cycle: 10 years
Type: fixed electric asset, distributed Key life cycle phase Management
Construction Financially separated: activity based costing zero based budgeting Design Key performance Indicator: contribution to non availability # inaccurate
switching Maintenance
3.3 Water Company
The interviewed integrated water company combines all water services in a single organization. The organization is responsible for three separate systems in part of the country: the water system, the sewage system, and the drinking water system. The water system contains the management of the ground water, surface water, drain system, dike’s and dams, and waterways. The sewage system comprises the collection of sewage water (sewage system) and the cleaning of the sewage water. The drinking water system contains the extraction, production and distribution of drinking water.
We asked the interviewees what the most important assets were per system. Important assets for the water system are: water level adjusting constructions like (dams, pumping stations, and inlets), dikes and dam, water ways, bridges and sluices. Important assets for the sewage system are: sewage pipelines and wells, sewage pumping stations, and sewage water purification installations. Important assets of the drinking water system are: water extraction locations, water purifi-cation installations, pumping stations, water pipelines.
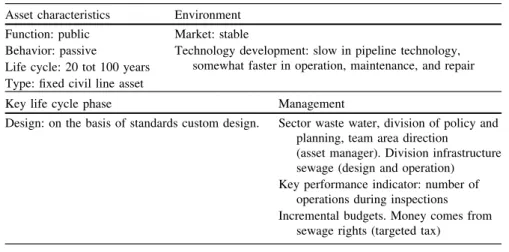
Table6represents the asset framework for the sewages. Sewages have a public function and in the Netherlands there are two types of sewages: a mixed system in which rain water and sewage water both travel through the same pipelines, and a separate system in which the two rain water and sewage water are separated. The mixed system is no longer built. The behavior of the asset is passive and it has a life cycle of 20–100 years. Pipelines and wells are fixed civil line assets.
Regarding the environment of the asset, the market is stable and technology development is slow in pipeline technology. Technological development is somewhat faster in operation, maintenance, and repair. Related are the technical developments in Geo Information Systems in which the asset is represented.
Table 6 Asset framework of sewages (only pipelines and wells) Asset characteristics Environment
Function: public Market: stable
Behavior: passive Technology development: slow in pipeline technology, somewhat faster in operation, maintenance, and repair Life cycle: 20 tot 100 years
Type: fixed civil line asset
Key life cycle phase Management
Design: on the basis of standards custom design. Sector waste water, division of policy and planning, team area direction
(asset manager). Division infrastructure sewage (design and operation) Key performance indicator: number of
operations during inspections Incremental budgets. Money comes from
The key life cycle phase is design where custom designs are made on the basis of standards. The pipe lines are cleaned approximately once every 5 years, inspection also takes place once every 5 years. Wells are measured for their depths as they tend to subside, part of the wells therefore have foundations. Regarding the purchase and construction the market is standardized.
Within the sector waste water there is a separate division of policy and planning and division infrastructure sewage. The key performance indicator is the number of operations during inspections. Budgets are incremental and the money comes from sewage rights, a target tax paid by the people living in the area of the integrated water company serves.
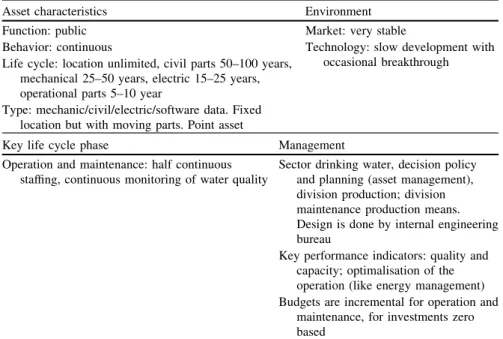
Table7 presents the asset framework for the water purification assets of the water company that are used to clean water in order to make drinking water and are public. Their behavior is continuous as they constantly produce drinking water. While the location of the asset has an unlimited life cycle, the civil parts have a life cycle of 50–100 years, mechanical 25–50 years, electric 15–25 years, and the operational parts 5–10 years. The purification installations are mechanic, civil, and electric point assets with a fixed location but with moving parts.
The market is very stable and technology development is slow. Sometimes there are technological breakthroughs like the use of ozone, membranes, and ionization, which further optimize the technology.
Regarding the different phases in the lifecycle: two types of concepts exist regarding water, industry quality water and drinking water. In the design phase the
Table 7 Asset framework of drinking water purification installations
Asset characteristics Environment
Function: public Market: very stable
Behavior: continuous Technology: slow development with occasional breakthrough Life cycle: location unlimited, civil parts 50–100 years,
mechanical 25–50 years, electric 15–25 years, operational parts 5–10 year
Type: mechanic/civil/electric/software data. Fixed location but with moving parts. Point asset
Key life cycle phase Management
Operation and maintenance: half continuous staffing, continuous monitoring of water quality
Sector drinking water, decision policy and planning (asset management), division production; division maintenance production means. Design is done by internal engineering bureau
Key performance indicators: quality and capacity; optimalisation of the operation (like energy management) Budgets are incremental for operation and
maintenance, for investments zero based
required water quality and capacity of the purification installations are custom design. The specifications of the installations are then tendered. The most important lifecycle phase is however the operation and maintenance phase where half continuous staffing and continuous monitoring of water quality is adopted.
Like the sector waste water, the sector drinking water is part of division of policy and planning. The key performance indicators of the water purification assets are the quality and the capacity of the assets. Budgets are incremental for operation and maintenance, for investments zero based.
4 Discussion
Regarding the asset characteristics we notice the following. Most assets of the interviewed companies were public assets except for some of the assets like the dredging compartments and quays of the port of Rotterdam. The dredging com-partments being the only ‘‘natural’’ assets. The studied assets differ significantly in life span, ranging from years (electronics) to more than 100 years and some even have ‘‘unlimited’’ life span, like for example the dredging compartments.
From the results we found that there are different limitations to asset life: 1 The asset will be used as long as it functions and is replaced to ensure
func-tionality after breakdown.
2 The asset life is terminated premature by the market. Even though the asset still functions, its function is no longer demanded.
3 The asset life is terminated by technological development. There are cheaper alternatives available that reduce costs. This can be in pure efficiency (engines, production plants) or in the reduction of the increased risk in failure.
4 The asset life is ‘‘unlimited’’. After construction these assets are nearly always just maintained or redesigned as repair of the asset is virtually always cheaper than replacement.
The interviewed organizations all had assets in all four categories, though there seemed to be a concentration in 1: where the function requirement continues but the asset life is limited. This applies for example to cables and pipelines that need to be replaced or fixed when they are broken or leak. The quays of the port authority are an example of 2. The quay, which may have a technical life of well over 50 years for a certain ship size, may reach its end of life after 25 years when it can not accommodate the new larger ships. An example of 4 is a dike that is reinforced over time. Examples of 3 are digital controls: where not supported or malfunctioning software is too costly to maintain. Three was mentioned by all but was only a small proportion of the assets. This could be explained by the low operational costs the infrastructure assets generally have. It is worth noting that both the elements that were put under the environment—market and technical development—are limitations to asset life.
The way themanagement was organized was not directly related to the asset characteristics. The port authority had a strong compartmentalized focus per asset while the network company had a division in which responsibilities were divided; both companies have assets with the same characteristics. The port authority, however, was the only company that commercially exploited its assets. Further-more the water company may achieve synergy options by combining water purification and sewage water purification which currently are separately managed. However, it is not legally allowed to bundle these activities. The organization of the management therefore seemed to be determined by organizational history, or legal constraints.
Asset managers had different focus in thelife cycle, dependent on the man-agement options in the lifecycle. For passive assets (like cables, and civil con-structions) the focus was on design, and maintenance was approached separately (when time was there); on operated assets focus was less on design, as operation can be improved within a design (or with redesign like new filters for water production).
Regarding the most important phases of the asset life cycle it became clear that while the management of the life cycle of assets is emphasized in practice many assets have a dominant life cycle phase in terms of time. That is, some assets have such long life spans that the asset does not or very slowly move into another lifecycle phase. (Typically assets that belong to groups 1 and 4 above.)
Regarding the framework: When asked the matrices provided a useful overview of the most important elements of the assets. The framework provided a quick way of getting an overview of the assets and their management needs. The framework structured the interviews in such a way that during the interviews a lot of infor-mation could be attained.
Overall relevant conclusions could be drawn with the framework when com-paringasset characteristicstoenvironmentandlife cycle. Within the current set up the organisation of the management did not seem to have a link to the asset characteristics. In future it may therefore be relevant to include quantities like investment costs, maintenance costs and value of the asset base. These figures may improve the understanding of some choices that are made.
5 Conclusions
In this paper, that describes work in progress, we have assumed that asset man-agement is a single concept that is implemented differently. That is, the asset management implementation differs in a number of ways and depends on: the characteristicsof the assets and the environment of the assets, in relation to the most relevantlifecycle phases andmanagement of the organizations.
The premise was that we can present different asset management approaches of practitioners in a generic framework that makes sense to practitioners. The framework was verified amongst the practitioners of the NGInfra Asset
Management Platform. Overall the framework helps to get a quick overview which seems to confirm our premise. All interviewed practitioners could relate to the framework and a lot of information was gathered in a short period of time.
Within the current set up of the framework the results regarding management did not seem to have a link to the asset characteristics. In future figures like investment costs, maintenance costs and value of the asset base may improve the understanding of some choices that are made.
References
1. Jongerius J, Meijerink T, van Miltenburg J (2007) Added-value performance, infrastructure asset management in the Netherlands, a study in seven sectors. Evers & Manders Consult BV, Hoevelaken
2. PAS 55—Optimal management of physical assets. British Standards Institution
3. NTA 8120 (2009) Asset management—requirements for a safety, quality and capacity management system for electricity and gas distribution
4. Finger M, Groenewegen J, Kunneke R (2005) The quest for coherence between institutions and the technologies in infrastructures. J Netw Ind 6(4):227–259
5. Komonen K (2008) A strategic asset management model: determination of corporate strategy for physical assets. In: Euromaintenance 2008. Conference Proceedings. Brussels, Belgium 6. Schuman CA, Brent AC (2005) Asset life cycle management: towards improving physical
asset performance in the process industry. Int J Oper Prod Manage 25(6):566–579 7. Eurenseam (2009) Eurenseam networkmaps. Seville November 2009
8. Port of Rotterdam Authority (2008) Annual report 2008. Port of Rotterdam, Rotterdam 9. Delta (2009) Jaarverslag 2009, Omgevingsbewust Ondernemen. Delta N.V., Middelburg