TURUN YLIOPISTO
miRNA data analysis
workflow
Minna Kyläniemi
Master’s thesis
Department of Future Technologies Bioinformatics University of Turku June 2019
The originality of this thesis has been checked in accordance with the University of Turku quality assurance system using the Turnitin OriginalityCheck service.
UNIVERSITY OF TURKU
Department of Future Technologies
MINNA KYLÄNIEMI: miRNA data analysis workflow
Master’s thesis, 68 p., 4 p. appendices
Master’s Degree Programme in Bioinformatics
____________________________________________________________________ Micro RNAs (miRNA) have been shown to regulate many biological processes by silencing the expression of their target genes. They are small non-coding RNAs that have been found in all types of organisms from eukaryotes to viruses. It has been shown that one miRNA can have several target genes and on the other hand, one gene can be targeted by several different miRNAs. Thus, the analysis of miRNA data is complicated. The aim of this project was to develop a workflow for miRNA functional analysis and test its functionality with some published datasets.
The workflow for the functional analysis of miRNAs includes miRNA differential expression analysis, target gene identification and functional enrichment analysis. The first aim of this project was to find a suitable database or a set of databases to retrieve miRNA target predictions. By literature search, information was gathered about different miRNA target prediction databases that are currently available. mirDIP4.1, which collects predictions from 30 different resources and is updated frequently, was selected as the source of miRNA target predictions.
For the functional analysis, two different tools were tested. First one of these, R/Bioconductor package mdgsa is based on gene set enrichment analysis. The other one, BUFET is a python script that performs overrepresentation analysis with empirical correction for bias that is often observed in miRNA functional analysis. For the testing of these algorithms, datasets from three different publications were used with miRNA target predictions from various sources. As expected, the results from different approaches differed both from the original publications and from each other. One reason for the differences observed in results compared to those of the original method publications was the different target prediction database that was used here.
Keywords: micro RNA, miRNA, target prediction, functional enrichment analysis, gene set enrichment analysis, overrepresentation analysis, pathway analysis
Table of contents
ABBREVIATIONS ... v
1 Introduction ... 1
2 Review of the literature ... 4
2.1 Biogenesis of miRNAs ... 4
2.2 Analysis of miRNA data ... 7
2.3 Identifying miRNA target genes ... 9
2.3.1 Target prediction algorithms ... 9
2.3.2 Experimentally validated targets ... 12
2.4 Functional enrichment analysis ... 14
2.4.1 Overrepresentation analysis ... 17
2.4.2 Gene set analysis ... 18
2.4.3 Bias in miRNA functional analysis ... 19
3 Aims of the study ... 22
4 Materials and methods ... 23
4.1 Datasets ... 23
4.2 miRNA target prediction tools ... 25
4.2.1 mirDIP4.1 ... 25
4.2.2 TargetScan ... 26
4.2.3 miRanda ... 27
4.2.4 mirTarget ... 27
4.2.5 DIANA-microT database ... 28
4.3 Functional enrichment analysis tools ... 28
4.3.1 BUFET ... 28
4.3.2 Mdgsa ... 29
4.4 Gene set data ... 31
5 Results ... 32
5.1 Target prediction ... 32
5.1.1 mirDIP4.1 ... 34
5.1.2 Comparison of target prediction tools ... 38
5.2 Functional enrichment analysis ... 43
5.2.1 Functional enrichment analysis with BUFET algorithm ... 44
5.2.2 Functional enrichment analysis with mdgsa algorithm ... 47
5.2.3 Comparison of functional enrichment analysis results from BUFET, MDGSA and ClusterProfiler ... 53
6 Discussion and conclusions ... 56
7 References ... 62
Appendix 1. Number of miRNA-target gene interactions in different miRNA target prediction tools. ... 69
Appendix 2. Results of mdgsa analyses ... 70
ABBREVIATIONS
Bp basepair
DNA deoxyribonucleic acid
GO Gene Ontology
KEGG Kyoto Encyclopedia of Genes and Genomes
miRNA micro RNA
mRNA messenger RNA
MsigDB Molecular signatures database
NGS next generation sequencing
Nt nucleotide
ORA overrepresentation analysis
1
Introduction
The development of technologies such as microarrays and next generation sequencing has enabled analysis of DNA and RNA molecules from cells and tissues on the whole genome or transcriptome level. These analyses have revealed differences in amounts of RNA molecules between samples related to proliferation, differentiation, cell type, disease or treatments of samples (Hausser and Zavolan 2014; Lin and Gregory 2015; Mehta and Baltimore 2016; Riffo-Campos, Riquelme, and Brebi-Mieville 2016). In addition to messenger RNAs (mRNA) that are translated into proteins, other types of RNAs called non-coding RNAs, have been described. Non-coding RNAs can be divided into long and small non-coding RNAs. One class of small non-coding RNAs are micro RNAs (miRNAs) that were described first time in early 1990s in Caenorhabditis elegans (R. C. Lee, Feinbaum, and Ambros 1993). However, it took about a decade before their role in biology was revealed and there is still plenty to learn.
miRNAs have been discovered from most eukaryotes and even from viruses. This indicates that their role in regulating biological processes is important for many types of organisms. There are currently more than 2600 different mature human miRNA sequences listed in the miRBase v22 database (Kozomara, Birgaoanu, and Griffiths-Jones 2019), which is a public repository of known miRNA sequences and annotation. In addition to human miRNAs, there are more than 48 000 mature miRNAs from 271 organisms, for example mouse, Caenorhabditis elegans and plants such as Arabidopsis thaliana (Kozomara, Birgaoanu, and Griffiths-Jones 2019). miRNAs regulate cellular processes mainly by silencing their target genes (Hausser and Zavolan 2014) and the majority of mammalian mRNAs have been predicted to be targeted by at least one miRNA (R. C. Friedman et al. 2009).
Changes in the miRNA expression levels is one regulating factor for many biological processes, such as differentiation, proliferation, cell death, cancer and the regulation
Baltimore 2016; Riffo-Campos, Riquelme, and Brebi-Mieville 2016). For example, aberrant miRNA expression occurs in many cancer cells (Lin and Gregory 2015). Some miRNAs like let-7 miRNA family, are known to function as tumour suppressors by regulating the expression of oncogenes such as MYC (Lin and Gregory 2015). If the expression of such miRNA is downregulated, it can have severe consequences. It has been proposed that miRNA expression profiles could be used as diagnostic markers in some types of cancers (Lin and Gregory 2015) and miRNA expression profiles can be altered also in other diseases. Therefore, understanding the impact of miRNAs on biological processes on both healthy tissues and in disease is important.
The biological actions of miRNAs are complex. Usually one miRNA has up to hundreds of different target genes and on the other hand, one gene can have several different miRNAs that can regulate its expression. Determining the target genes of miRNAs is crucial for understanding their function in biological processes. The target genes of miRNAs can be identified by experimental validation or predicted computationally. Experimental validation of miRNA target interactions is demanding and expensive and the data is still limited. Therefore, miRNA target prediction tools are important resources in interpreting the impact that miRNAs have on regulating biological processes. Different miRNA target prediction tools are based on different combinations of biological properties of miRNAs and even tools that are based on same biological properties may have varying results. Therefore, the selection of target prediction tool is important step for miRNA data analysis.
In the cell, single molecules and genes act together as pathways. To study these pathway level changes, functional enrichment analysis is performed. For the analysis, defined gene sets for pathways or other biological terms are used. Functional enrichment analysis can be performed by over-representation analysis or gene set enrichment analysis. Because the gene sets are defined on gene level, the miRNA data must be translated to gene level or then the gene set information to miRNA level to be able to do the analysis.
miRNA functional analysis is challenging, since the target predictions by different algorithms are not uniform. In addition, some recent studies (Bleazard, Lamb, and
Griffiths-Jones 2015; Godard and Van Eyll 2015) have shown that commonly used approach to perform miRNA pathway analysis based on the list of their target genes by overrepresentation analysis has a bias towards certain pathways and might not give biologically relevant results. There is no standardised way for miRNA data analysis, and therefore it is important to gain more insight how choice of target prediction tool and functional enrichment analysis tool affect the results.
2
Review of the literature
2.1 Biogenesis of miRNAs
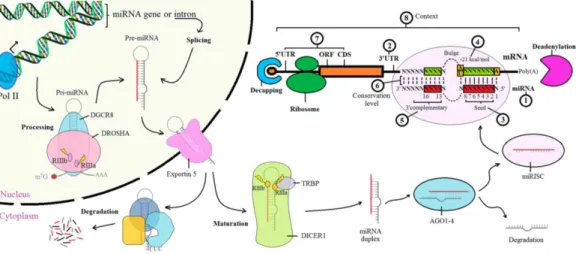
miRNAs are small non-coding RNAs, that have been shown to regulate many processes in the cells. miRNA genes in human genome are usually located on introns and intergenic regions, but some miRNA sequences are located on the coding regions of protein encoding genes (Treiber, Treiber, and Meister 2019). miRNAs are transcribed as precursor molecules that are cleaved to form the mature miRNAs that are about 22 nucleotides (nt) long (Lin and Gregory 2015). miRNAs are encoded in the genome either as clusters of many miRNA genes or as individual genes (Treiber, Treiber, and Meister 2019). The first, unprocessed miRNA molecule is called the primary miRNA (Pri-miRNA), which forms a loop structure in the nucleus (Y. Lee et al. 2004) (Figure 1). Pri-miRNA is cleaved in the nucleus to form a precursor miRNA (pre-miRNA) and then further processed by protein called DICER in the cytoplasm to release the mature miRNA molecule (Treiber, Treiber, and Meister 2019). Mature miRNA binds to a protein complex to form a miRNA induced silencing complex (miRISC), which binds to complementary mRNA sequences preventing the translation of mRNA into protein (Lin and Gregory 2015). The binding of miRISC into mRNA can also induce the cleavage of target mRNA, its accelerated degradation or to mRNA deadenylation, which destabilizes the mRNA (Jonas and Izaurralde 2015) and leads to the loss of target mRNA. However, miRNA mediated gene regulation is described more as gene silencing than inhibition of target gene expression since miRNA mediated gene regulation leads usually only to decreased protein expression and not to the total abolishment of the target protein (Jonas and Izaurralde 2015).
Figure 1. miRNA biogenesis. miRNAs are expressed as primary miRNAs from the genes encoded in the genome. Pri-miRNA is further processed by a protein complex formed by DROSHA and DGCR8, that cleave the pri-miRNA to produce precurosor miRNA (pre-miRNA). Pre-miRNA is then exported to cytoplasm and further processed by DICER1 to release the mature miRNA, which is about 22 nucleotides long. This short RNA forms a miRISC protein complex, which finds its target mRNAs by complementary binding to the miRNA. miRNA binding to its target mRNA leads to the inhibition of protein translation and degradation of target mRNA. Picture adopted from (Lin and Gregory 2015)
The regulation of gene expression by miRNAs is a complex process. The binding sites
of miRNAs are usually located on untranslated 3’ ends of mRNA and one miRNA can have several binding sites in the same target mRNA, but miRNAs can also have several different target genes (Jonas and Izaurralde 2015; Riffo-Campos, Riquelme, and Brebi-Mieville 2016). In addition, many genes are targeted by several different miRNAs (Riffo-Campos, Riquelme, and Brebi-Mieville 2016). It has been also predicted that most mammalian mRNAs are targets of some miRNAs (R. C. Friedman et al. 2009). Therefore, miRNAs can either antagonize or strengthen the effect of each
usually located in the 3’-end of the mRNA, some studies have shown that miRNAs can
also bind to 5’-ends of their target mRNAs (Ørom, Nielsen, and Lund 2008) or to the coding region of gene (Guo et al. 2015; Schnall-Levin et al. 2011). Many possible target sites on mRNAs lead to more difficult prediction of miRNA target genes. The miRNA sequence can be divided into seed sequence and 3’ end sequence, which
have different importance in determining the target site of miRNA (Figure 2). The seed sequence of miRNA is the eight nucleotides at the 5’- end of the miRNA. This seed sequence is the most important in determining the target sites of miRNAs, but even the seed complementarity to target mRNA does not need to be perfect. Some mismatches are also allowed in the 3’-end of the miRNA. This imperfect complementarity needed for binding increases the number of potential target genes for any miRNA. (Peterson et al. 2014; Riffo-Campos, Riquelme, and Brebi-Mieville 2016)
Figure 2. The biological basis of miRNA target prediction algorithms. miRNA binding sites are usually located on 3’UTR regions (2) of mRNAs. ~22 nucleotides long miRNA
can be divided into seed sequence (3) and to 3’complementary sequence (5). Many of the miRNA-mRNA sequences are conserved across species (6) and there is more conservation on the seed sequence than on 3’complementary sequence. The stability of mRNA binding can be estimated by calculating the free energy of miRNA-mRNA duplex (4). miRNA-miRISC binding to its target site can lead to deadenylation
of mRNA, which destabilizes mRNA. In addition, it can lead to the degradation of mRNA. Image from (Riffo-Campos, Riquelme, and Brebi-Mieville 2016).
The seed region can be used to classify miRNAs into families. Information about miRNA families is collected into Rfam database (rfam.xfam.org) (Kalvari, Argasinska, et al. 2018; Kalvari, Nawrocki, et al. 2018). The latest version of Rfam, version 13.0, lists 298 miRNA families in human genome. Some miRNA families have been shown to have an important role in specific developmental stages or in other biological processes. For example, let-7 miRNA family have been shown to have a role in development and in tumour suppression in vertebrates, but also in C. elegans and Drosophila (Lin and Gregory 2015; Rougvie 2001). In addition, this miRNA family is highly conserved among species (Rougvie 2001). The evolutionary conservations of miRNAs highlight the importance they have in the regulation of different biological processes.
2.2 Analysis of miRNA data
From a cell or tissue sample all RNA molecules can be extracted. However, if using a kit optimised for mRNA isolation, the small non-coding RNAs may be excluded from the sample (Brown et al. 2018). Therefore, the sample preparation and RNA extraction needs to be designed properly, if small non-coding RNAs are the focus of interest. Similarly, the library preparation of next generation sequencing needs to be designed specifically for these small RNAs as regular protocols are not suitable for these 22 nt sequences (Giraldez et al. 2018). For microarray analysis, there is specific arrays available for miRNA analysis, but Next Generation Sequencing (NGS) is becoming more widely used as well.
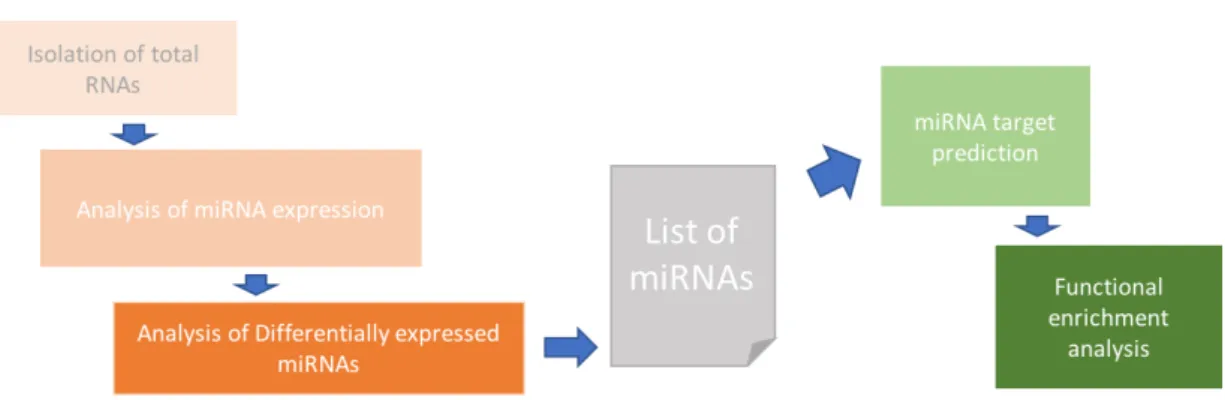
After the RNA isolation of the sample, the expression of different miRNAs is analysed by sequencing or microarrays (Figure 3). NGS allows the analysis of the whole miRNA population in a sample whereas microarrays are limited to those miRNAs that have predesigned probes on the array for their detection. The raw data from sequencing or array is then processed and the quality of data assured after which differential
expressed miRNAs can then be used for further analyses. Similarly, as with gene expression data, the miRNA list itself is not usually very informative, but further analysis is necessary for the biological interpretation of data. In comparison to mRNA data, which is on the gene level, the problem with miRNA data is that gene sets of biological pathways are on the gene level whereas the miRNA data is not on gene level. Therefore, the lists of differentially expressed miRNAs need to be translated to the lists of genes that are affected by the miRNAs or then the pathway data would need to be translated from gene level to miRNA level. The target genes of miRNAs are either predicted by some of the available target prediction tools or then experimentally validated targets for the list of miRNAs are searched from databases. However, the data for experimentally validated miRNA target gene interactions is still limited, and therefore target prediction is often used. Functional enrichment analysis of miRNA data can be performed either by overrepresentation analysis or gene set enrichment analysis. miRNA target prediction and functional enrichment analysis are described in more detail in the following sections.
Figure 3. Typical miRNA analysis workflow. The analysis of miRNAs starts with the isolation of total RNAs from samples. Analysis of miRNA expression from these samples can be done by microarray analysis or by high throughput sequencing. Then the raw data is processed, quality is analysed and the differential expression of miRNAs calculated between different samples. The result is a list of miRNAs, which can be filtered by certain criteria or then the full list of miRNAs with test statistics is used for further analysis. miRNA target genes can be predicted by several different tools or then experimentally validated targets from databases can be used. Finally, functional enrichment analysis can be performed and for that gene sets can be selected from for example Gene Ontology (GO) or Kyoto Encyclopedia of Genes and
Genomes (KEGG). Functional enrichment analysis can be done by overrepresentation analysis or gene set enrichment analysis.
2.3 Identifying miRNA target genes
Determining the target genes of miRNAs is important for understanding the function of miRNAs in biological processes. Target genes can be either predicted based on different biological properties of miRNAs or interactions of miRNAs with their target mRNAs can be experimentally validated in laboratory.
2.3.1 Target prediction algorithms
Development of accurate target prediction algorithms has been active for more than 15 years and currently there is more than 180 different resources listed in the OMIC-tools database for miRNA target prediction (www.omictools.com; 04/2019). Another resource for miRNA analysis tools, Tools4miR (www.tools4mirs.org ), lists 59 different tools for miRNA target prediction. Tools4miR is manually curated and frequently updated (last update in March 2019) platform listing tools for miRNA analysis (Lukasik, Wójcikowski, and Zielenkiewicz 2016). Thus, there are plenty of tools for miRNA target prediction to choose from, but different algorithms are based on different biological properties of miRNAs (Figure 2) and the results of individual tools differ.
One of the common features that are used by several target prediction algorithms is a seed match, which refers to Watson-Crick base pairing between the seed region of miRNA and the mRNA. Seed match can be considered as 6mer, 7mer or 8mer match, depending on the length of seed that has full complementarity to target mRNA. Second, the conservation of the miRNA sequence, 3’UTR binding sites on mRNA and
5’ UTR binding sites on mRNA are used either separately or in combination.
Conservation of these regions is considered across species. Third biological property is the free energy of miRNA-mRNA binding, which relates to the stability of the binding. In addition, mRNA secondary structure, which affects the accessibility of the
features are used by many target prediction tools in different combinations and together with other features such as the number of miRNA binding sites in mRNA,
complementarity of 3’ end of miRNA to mRNA, the position of the miRNA target site on mRNA and machine learning approaches. (Peterson et al. 2014; Riffo-Campos, Riquelme, and Brebi-Mieville 2016)
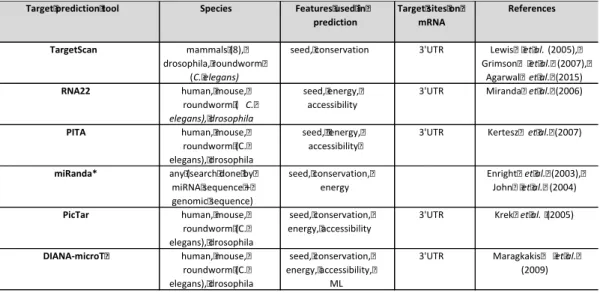
Some of the earliest or most used tools for miRNA target prediction are listed in Table 1. These algorithms have all been published 2003-2007 and while targetScan (updated 03/2018) (Agarwal et al. 2015; Grimson et al. 2007; Lewis, Burge, and Bartel 2005), RNA22 (updated 04/2015) (Miranda et al. 2006) and DIANA-microT (updated 2013) (M. Maragkakis et al. 2009) are still updated, miRanda (Enright et al. 2003; John et al. 2004) is deprecated and PITA (Kertesz et al. 2007) and PicTar (Krek et al. 2005) have not been updated for 10 years. These algorithms rely on some combination of the commonly used biological features of miRNAs and are mainly predicting miRNA
interaction to 3’UTR sequences of mRNAs. However, some of these algorithms, such as miRanda and RNA22, use miRNA sequence and target gene 3’UTR or whole
sequences or intronic regions as input and thus these tools can be used to find miRNA target sites anywhere from the genome.
Table 1. Widely used tools for miRNA target prediction
Target prediction tool Species Features used in prediction Target sites on mRNA References TargetScan mammals (8), drosophila, roundworm (C. elegans)
seed, conservation 3'UTR Lewis et al.(2005), Grimson et al. (2007),
Agarwal et al. (2015)
RNA22 human, mouse,
roundworm ( C. elegans), drosophila
seed, energy, accessibility
3'UTR Miranda et al. (2006)
PITA human, mouse, roundworm (C. elegans), drosophila
seed, energy, accessibility
3'UTR Kertesz et al. (2007)
miRanda* any (search done by miRNA sequence + genomic sequence) seed, conservation, energy Enright et al.(2003), John et al. (2004)
PicTar human, mouse,
roundworm (C. elegans), drosophila
seed, conservation, energy, accessibility
3'UTR Krek et al. (2005)
DIANA-microT human, mouse, roundworm (C. elegans), drosophila
seed, conservation, energy, accessibility,
ML
3'UTR Maragkakis et al.
(2009)
* miRanda tool not available from May 2018 ML = machine learning
One problem with target prediction algorithms is that many of the tools that are published are not updated after their publication. Therefore, new information is not added when new miRNAs are found or more information is gained on factors affecting miRNA target interaction. In addition, every time that mirBase, the database for micro RNAs (Griffiths-Jones 2004; Kozomara, Birgaoanu, and Griffiths-Jones 2019), is updated to a new version, some miRNAs that have been earlier identified as miRNAs are removed and some new miRNAs are usually added. Some of the prediction tools are also based on a specific version of mirBase and miRNA names need to be translated to the correct version with some suitable tool such as miRNAmeConverter (R/Bioconductor package).
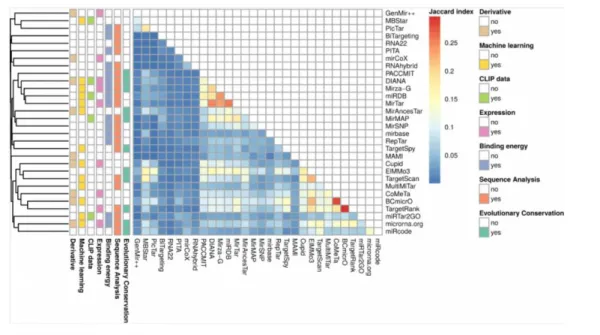
Another problem in using a single algorithm for miRNA target prediction is that the results of prediction tools differ and even algorithms that are based on the same biological properties of miRNAs have varying results (Figure 4) (Tokar et al. 2017). For example, mirBase and RepTar both are based on the sequence analysis and the binding energy of miRNA-mRNA duplex, but their results have very low Jaccard index indicating highly different results (Figure 4). The biggest overlap that was observed by Tokar et al. was between BCmicro and TargetRank and resulted in Jaccard index of 0.3 showing that these target predictions have some overlap, but the similarity is not very strong (Tokar et al. 2017). In the Figure 4, sequence analysis refers to the seed match and binding energy is the same as the free energy of miRNA-mRNA duplex. Another problem with miRNA target prediction algorithms is that it is still not known which of the biological features of miRNAs are the most important for their interaction with the target genes and their regulatory function. However, it has been shown that target prediction algorithms that are based only on the seed match and the free energy of binding, give less confident predictions than tools that are more advanced (Tokar et al. 2017). In addition, it has been recently demonstrated that prediction algorithms predict many false positive targets (Pinzón et al. 2017), which makes the selection of the target prediction algorithm more difficult. However, if a target gene is predicted by many different algorithms, it is more probable that miRNA
Figure 4. The results of different miRNA target prediction algorithms are not uniform. The colours indicate Jaccard indexes between the pairs of algorithms and information on the left of the panel shows some of the features that are common between algorithms. Figure adopted from (Tokar et al., 2017).
The number of target genes predicted for each miRNA can vary greatly by different resources. Currently, it is believed that one miRNA can target hundreds of genes, but it has been also shown that not all predicted miRNA targets experimentally validated and the number of false positive predictions can be high (Pinzón et al. 2017). If the target prediction algorithm results with too many target genes, the functional analysis will be skewed. As the target prediction is the first and crucial step in understanding the function of miRNAs, the accuracy of predictions is very important. It has been also stated that reliable target prediction prevents the bias in functional enrichment analysis (Tokar et al. 2017).
2.3.2 Experimentally validated targets
Although the number of experimentally validated targets for miRNAs is constantly increasing, the data is still limited. Methods that are used for the validation of miRNA-target gene interactions can be divided into low- and high-throughput methods. By
using low yield methods, interactions and/or regulation by only a few miRNAs can be studied at a time. With the high-throughput methods, miRNA binding sites throughout the genome or changes in the gene expression by miRNA on the whole transcriptome level can be explored. The data concerning the miRNA-mRNA interactions acquired by different techniques does not have equal confidentiality as some of the methods cannot distinguish direct from indirect regulation. (Karagkouni et al. 2017; Vlachos et al. 2015)
For example, quantitative RT-PCR (qRT-PCR), western blotting and ELISA can be used to verify miRNA targets on mRNA (qRT-PCR) or protein level (western blotting, ELISA). Another low throughput technique is using reporter gene assays, which can be used to directly and reliably verify miRNA target site interactions. Most of the high throughput methods are based on novel NGS techniques. Cross-linking immunoprecipitation (CLIP) sequencing is one widely used high-throughput method for miRNA target detection. The problem with traditional CLIP-seq is that it can identify the miRNA binding sites on genome wide level, but the interacting miRNA needs to be identified bioinformatically. In addition to CLIP-seq, other NGS based methods used are RNA immunoprecipitation sequencing (RIP-seq) and ribosome profiling sequencing (RPF-seq), which are used together with miRNA over-expression or silencing to elucidate the target sequences. Most recent techniques used for miRNA target identification include CLEAR-CLIP and CLASH, which include a ligation step where miRNAs are ligated with their target binding sites allowing detection of miRNA-mRNA duplexes. (Chou et al. 2017; Hausser and Zavolan 2014; Karagkouni et al. 2017; Vlachos et al. 2015)
The two biggest databases collecting information on experimentally validated miRNA target interactions are actively updated. The latest version of TarBase database is 8.0 and it has miRNA-mRNA interactions from 18 different species including for example human, mouse, rat and chicken (Karagkouni et al. 2017). TarBase includes information on 670 000 unique miRNA target interactions and collects data acquired from several different techniques such as CLEAR-CLIP, CLASH, RPF-seq, CLIP-seq and RIP-seq that all utilize NGS techniques, and from low-throughput techniques such as
experimentally validated miRNA targets is mirTarBase and its latest version, V7.0, was published in 2017 (Chou et al. 2017). mirTarBase is slightly smaller than Tarbase with its 420 000 miRNA target interactions and it has interactions from 23 different species (Chou et al. 2017). Both databases use the mirBase v21 miRNA information while the latest mirBase version is v22 (released in October 2018).
Experimentally validated targets can be used alone or together with predicted targets for functional analysis, but they can be also used to train the target prediction algorithms to become more reliable. In addition, knocking out or silencing selected miRNAs is a way to study their functional role in vivo to validate the results obtained from bioinformatics analyses. Confirmation of target genes and validation of the role of miRNAs may have in regulating cellular processes are important steps in learning the mechanisms of action of miRNAs.
2.4 Functional enrichment analysis
Genes and other molecules in the cells act together as networks and pathways. Change of expression level of a single molecule should be considered in the context of the whole network to predict the effect on the cellular level. High-throughput methodologies such as NGS produce large quantities of data from which the differences of expression of the whole miRNA population can be studied. The analysis of these datasets has been moved from individual genes to the level of gene sets or networks that act together. This type of analysis can be called functional enrichment analysis or pathway analysis.
Similarly to mRNAs, some of the miRNA transcripts may have big differences on their expression levels, but some and often many are changed only mildly (Garcia-Garcia et al. 2016). These small changes can, however, be significant for the regulation of cellular processes, if many of the regulated genes belong to the same pathway and alter its function. Identically, number of miRNAs that are changed only slightly, but all regulate the same gene or genes belonging to the same pathway, might affect the function of some biological cascade. Therefore, a list of differentially expressed
miRNAs is not necessarily very informative and more advanced data mining tools such as functional enrichment analysis are needed for the interpretation of data. Functional enrichment analysis can be used to analyse the effect of transcriptional changes on a gene set level. For this, typically a list of differentially expressed miRNAs is used as input. The list can be filtered by for example fold change and p-value or then the full ranked list of transcripts can be used (Garcia-Garcia et al. 2016).
For analysis on pathway level defined gene sets are necessary and these sets can be formed by utilising existing biological knowledge. These gene sets can be derived for example from two of the most used databases; Gene Ontology (GO) (Ashburner et al. 2011; The Gene Ontology Consortium 2019) or Kyoto Encyclopedia of Genes and Genomes (KEGG) (Kanehisa et al. 2019; Kanehisa and Goto 2000). In addition to these two very popular databases, there are many others that can be used such as the Molecular Signatures database (MSigDB) (Subramanian et al. 2005), which is a collection of gene sets maintained by GSEA team in Broad Institute. Gene sets can be formed for example based on their location on genome, biological function or cellular location.
In GO, genes are divided into three categories based on their biological properties. These categories are Biological processes, Molecular Functions and Cellular Components. GO terms are organized in a hierarchical way, where the top terms are more general and can have hundreds of genes. They are organized in a tree like structure and more general terms are followed by more specialised terms, which usually also have less genes in them. GO terms that have hundreds of genes or only a few are not very helpful in predicting the biological function of differentially expressed miRNAs. Enrichment of more specific terms is usually more informative for the understanding of biological functions. (Ashburner et al. 2011; The Gene Ontology Consortium 2019)
KEGG is a manually curated database for molecular networks. Unlike GO, it has pathway maps that show the interactions of different molecules in the pathway. KEGG pathways can be divided into networks related to metabolic functions,
regulatory functions and human diseases. (Kanehisa et al. 2019; Kanehisa and Goto 2000)
At present, there is no standardized way available for miRNA functional analysis. The functional analysis of miRNA data is more difficult than functional analysis of mRNA data since gene sets are defined on the gene level and thus either the data of differentially expressed miRNAs need to be translated to the gene level or then the gene sets to the miRNA level to be able to perform the analysis. The selection of miRNA target prediction tool or database for validated targets affects the results of the functional analysis (Tokar et al. 2017). However, to be able to interpret the biological functions of miRNAs, target gene prediction or validation of miRNA target genes and functional enrichment analysis is often necessary.
If an algorithm for functional enrichment analysis is dependent on miRNA target predictions from one specific source, the deprecation of prediction tool leads to unusable functional analysis tool as well. This happened when one of the most cited and used miRNA target prediction algorithms, miRanda, stopped working in May 2018. Functional analysis tools that allow the user to select the source of target predictions are more flexible and more robust to changes in the prediction algorithms. In addition, as several miRNAs can have binding sites in the same gene and on the other hand same miRNA can bind to several genes, these combined effects of miRNAs are not involved in all functional analysis tools. For the biological function of miRNAs, this synergistic effect is important and might affect the results of functional analysis (Garcia-Garcia et al. 2016).
Similar methods that are used for gene expression data are mainly used for miRNA functional enrichment analysis. In the next sections, the most used functional enrichment analysis tools, gene set analysis and overrepresentation analysis are introduced. Functional enrichment analyses of miRNA data have been thus far mainly performed with overrepresentation analysis, but a few algorithms for gene set analysis have been developed recently as well (Garcia-Garcia et al. 2016).
2.4.1 Overrepresentation analysis
Overrepresentation analysis is performed from a list of differentially expressed genes or miRNAs where the order of the list is not important. Hypergeometric test or
Fisher’s exact test are commonly used statistical methods to test whether genes
belonging to certain pathways are overrepresented among the list of genes in question. The test is performed to evaluate whether the genes of a certain gene set are present in the list of differentially expressed genes more than by random chance would be expected Figure 5. (Gusev et al. 2007)
Figure 5. A schematic presentation of basis for the overrepresentation analysis. Orange dots present genes that belong to a certain gene set and blue dots represent all other genes that can be either the genes that have been analysed on a microarray or the whole genome if Next Generation Sequencing has been used. Among differentially expressed (DE) genes there is a certain number of genes belonging to this gene set. Among all genes, there is several genes belonging to this orange gene set, but not all of them are present in DE genes. Statistical test is performed to analyse whether there are more genes belonging to orange gene set in DE genes than would randomly be expected.
However, recently it has been shown that the traditional method of overrepresentation analysis on miRNA data (Gusev et al. 2007) leads to bias towards some pathways and enrichment can be seen even with random lists of miRNAs (Bleazard, Lamb, and Griffiths-Jones 2015). Therefore, the traditional overrepresentation analysis methods need to be modified to give unbiased results for miRNA data (Bleazard, Lamb, and Griffiths-Jones 2015; Zagganas et al. 2017). This bias in functional analysis of miRNA data is discussed more in Section 2.4.3.
2.4.2 Gene set analysis
In gene set analysis, the enrichment of genes belonging to a certain set or group in top or bottom of the ranked list of genes is studied. The ranking of genes can be done for example based on their expression level or differential expression. Statistical analysis is then performed to elucidate whether genes from one set are enriched on one end of the ranked list (Figure 6). The gene set enrichment method was described originally by Mootha et al. (Mootha et al. 2003) and further developed and named gene set enrichment analysis (GSEA) by Subramanian et al. (Subramanian et al. 2005). The GSEA method is based on estimating the statistical significance of the enrichment by empirical permutation test.
Figure 6. A schematic presentation of gene set enrichment analysis. All the genes that have been analysed are ranked according to for example their differential expression. Genes belonging to a certain gene set are presented as white lines and the rest of the genes are green. Statistical testing is performed to analyse whether genes belonging to a set (white lines) are more enriched among the top-ranking genes than expected by chance. The test can be also performed to see whether the genes of some gene set
are more enriched among low ranking genes, if genes are ranked according to their expression level from high expression to low expression.
There are several methods available for performing gene set analysis and it is a widely-used approach in analysing differentially expressed genes from NGS or microarray data. Gene set analysis is also useful for analysing miRNA data, but the data needs to be converted to gene level first. Gene set analysis has been used less than overrepresentation analysis in analysis of miRNA data (Garcia-Garcia et al. 2016). In a recently published method, the enrichment of a certain set of genes is calculated from the ranking statistics of genes by logistic regression models (Montaner and Dopazo 2010) and the synergistic effect of miRNAs regulating the same genes is included in the model (Garcia-Garcia et al. 2016).
2.4.3 Bias in miRNA functional analysis
Algorithms developed for the functional enrichment analysis of gene expression data are commonly used for miRNA data as well but recent studies have shown that in this case there is a bias towards certain pathways (Bleazard, Lamb, and Griffiths-Jones 2015; Godard and Van Eyll 2015). One reason for this observed bias is the step where miRNA data is translated to gene level for analysis (Bleazard, Lamb, and Griffiths-Jones 2015). It has been shown that many false positive targets are predicted by miRNA target prediction tools (Pinzón et al. 2017) that lead to unreliable enrichment results. In addition, the enrichment pattern can be seen by even random lists of miRNAs indicating that traditional way of functional analysis, which is often based on hypergeometric test, does not produce reliable results for miRNA data (Bleazard, Lamb, and Griffiths-Jones 2015). Because the identification of miRNA target genes is usually the first step in the functional analysis, confident predictions or experimental validation of target genes is important. It has also been stated that if the target prediction method is good, even hypergeometric test produces reliable results (Tokar et al. 2017). However, as different target prediction algorithms produce variable results, defining a good target prediction algorithm is difficult.
2015; Garcia-Garcia et al. 2016; Godard and Van Eyll 2015; Zagganas et al. 2017). In the study by Bleazard et al. (Bleazard, Lamb, and Griffiths-Jones 2015), an algorithm called empiricalGO was introduced. This algorithm is based on overrepresentation analysis of gene sets, but the analysis is improved by calculating an empirical p-value for the enrichment using iterations of random miRNA lists of the same size as the original list. They showed that after this correction, most of the published enriched pathways were not significant any longer. They also present a modified algorithm that consideres also the number of predicted target sites that input miRNAs have in each predicted target gene. In the datasets used in the analysis, this modified multi-hit empiricalGO algorithm resulted in different results than the original empiricalGO (Bleazard, Lamb, and Griffiths-Jones 2015). The empiricalGO algorithm was further developed in another study in which the algorithm was named BUFET. In BUFET algorithm the computational efficiency of the analysis was improved by replacing the use of hash tables with bitsets (Zagganas et al. 2017). However, the BUFET algorithm does not include the information of multiple miRNA target sites in the same gene (Zagganas et al. 2017).
In the study by Godard and van Eyll (Godard and Van Eyll 2015), overrepresentation analysis is performed in such a way that gene sets (pathways) are translated to the miRNAs that regulate these genes and then hypergeometric test is performed in miRNA level. They showed that with this approach the enrichment bias can be avoided. Overrepresentation analysis in general has been criticized for the loss of information since only a fraction of the whole set of analysed genes is used (Garcia-Garcia et al. 2016). Gene set enrichment analysis, which has not been widely used for miRNA data, was proposed as another solution to overcome the problem of biased results and the possible drawback in overrepresentation analysis (Garcia-Garcia et al. 2016). This algorithm is called mdgsa and in this algorithm, the miRNA differential expression is transferred to gene level by utilizing an inhibition score, which also includes the information of multiple miRNA target sites in the same gene. The whole list of differentially expressed miRNAs is used and both the direction of the change and the strength (p-value) are used to give a ranking index to the miRNAs. These indexes are then translated on gene level regulation incorporating the synergistic
effects that miRNAs can have on the genes that they are regulating. The mdgsa algorithm developed by Garcia-Garcia et al. (Garcia-Garcia et al. 2016) can also be modified to include mRNA expression information of the same samples, if available, to restrict the analysis on only those genes that are expressed on the sample. The results by mdgsa positively correlated with results obtained by Godard and van Eyll (Godard and Van Eyll 2015) and randomised miRNA lists did result in only a very small number of significant GO terms (Garcia-Garcia et al. 2016), indicating that mdgsa algorithm does not show significant bias in the functional analysis of miRNA data.
3
Aims of the study
The aim of this project was to develop a workflow for miRNA functional analysis. To do this, first step was to find a good miRNA target prediction tool for identifying miRNA target genes. Second aim was to test this target prediction tool with some published datasets and then use the obtained predictions in functional enrichment analysis. The third aim was to select two algorithms for functional enrichment analysis and run the analyses with the selected datasets and predictions obtained from the target prediction tool and to compare the obtained results with original results from method publication and between the algorithms. Algorithms for functional analysis were selected so that the recently shown bias in miRNA functional analysis (Bleazard, Lamb, and Griffiths-Jones 2015; Godard and Van Eyll 2015) would be avoided.
4
Materials and methods
R version 3.4.3 with R studio version 1.1.423 on Mac OS X 10.12.6 was used for the analyses done with R. Python version 2.7.11 on Mac OS X 10.12.6 was used for the analyses done with Python.
4.1 Datasets
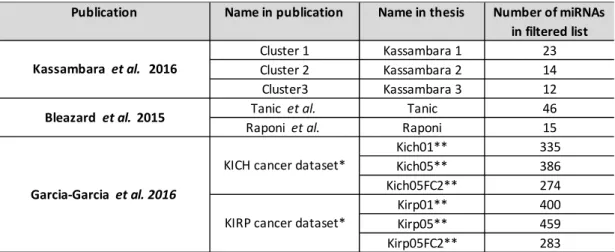
Several datasets were used to compare the results from both the target prediction tools and from the functional analyses (Table 2). Datasets were selected from the publications in which the functional enrichment analysis tools selected for this study were presented (Bleazard, Lamb, and Griffiths-Jones 2015; Garcia-Garcia et al. 2016) and data from one independent study (Kassambara et al. 2017).
Table 2. Datasets used in this study.
Two different cancer dataset KICH (Kidney Chromophobe) and KIRP (Kidney renal papillary cell carcinoma), that were also analysed by Garcia-Garcia (Garcia-Garcia et al. 2016) were selected from the cancer genome atlas project (https://cancergenome.nih.gov). Both datasets were paired data, that had data from controls and patients. For this study, the differential expression paired analysis done by Garcia-Garcia et al. was downloaded from github ( https://github.com/dmontaner-papers/gsa4mirna): tables res_edger_paired_kich.csv and res_edger_paired_kirp.csv
Publication Name in publication Name in thesis Number of miRNAs in filtered list
Cluster 1 Kassambara 1 23
Cluster 2 Kassambara 2 14
Cluster3 Kassambara 3 12
Tanic et al. Tanic 46
Raponi et al. Raponi 15
Kich01** 335 Kich05** 386 Kich05FC2** 274 Kirp01** 400 Kirp05** 459 Kirp05FC2** 283
*dataset in original publication not filtered; ** dataset filtered with 01 = pval <0.01, 05 = pval <0.05, 05FC2 = pval < 0.05 and |Fold change| >2
Kassambara et al. 2016
Garcia-Garcia et al. 2016 Bleazard et al. 2015
KICH cancer dataset*
statistics on miRNA level. In the original publication the target prediction data was collected from TargetScan (validated targets) (R. C. Friedman et al. 2009) and the gene sets used were defined from Gene Ontology (GO) terms (biological processes, cellular components and molecular functions) and downloaded from http://ensembl.org.
Two datasets that were analysed also by Bleazard et al. (Bleazard, Lamb, and Griffiths-Jones 2015) were used. These datasets are from human samples and they have been published earlier (Raponi et al., 2009; Tanic et al., 2013) and are available in GEO (Gene Expression Omnibus, www.ncbi.nlm.nih.gov/geo/); GSE16025 and GSE44899, respectively. In the publication by Bleazard et al. they had selected one of the miRNA lists presented in the original papers and to be able to compare results in this study with the results in Bleazard et al. I used the same comparisons. From Raponi et al. (Raponi et al. 2009), miRNAs differentially expressed in comparison of lung squamous cell carcinoma (SCC) samples to normal lung were used. This miRNA list is shown in Table 2 of original publication. For BUFET analysis this list was used directly, but for the mdgsa analysis the data was analysed using geo2r from ncbi.nlm.nih.gov and Benjamini-Hochberg correction for p-value. Similarly for the Tanic et al. (Tanic et al. 2013), miRNA list from cluster 2 (Figure 3 and Supplementary table S3 of original publication) was used in Bleazard et al. and directly for BUFET analysis in this study, but for the mdgsa analysis the data was analysed with geo2r. In geo2r, BRCAX samples were compared with normal samples for finding the differentially expressed miRNAs and Benjamini-Hochberg correction was used for p-value. To convert the miRNA names to current mirBase version (v21) mirBaseConverter (v1.0.4, R/Bioconductor) and miRNAmeConverter (v1.6.0, R/Bioconductor) were used. Two of the miRNAs, hsa-miR-220 and hsa-miR-1286, in Raponi et al. dataset (Raponi et al. 2009) were not available in the current mirBase v21 version and were discarded from further analysis. In Bleazard et al. (Bleazard, Lamb, and Griffiths-Jones 2015) the target predictions were derived from the miRanda tool with the following settings: free energy < 20 kcal/mol and score >155. In the original study, the gene ontology data of biological processes for all human genes was downloaded from http://ensembl.org.
One dataset that was not used by Bleazard et al. (Bleazard, Lamb, and Griffiths-Jones 2015) or by Garcia-Garcia et al. (Garcia-Garcia et al. 2016) was also selected. This dataset has miRNAs that are differentially expressed during human plasma cell differentiation (Kassambara et al. 2017). The dataset has three miRNA clusters that are differentially expressed during plasma cell differentiation. These clusters are presented in Figure 2C of the original publication. All these three clusters were used for BUFET analysis. The full data including p-values and test statistics for each miRNA were available as supplementary data and this data for Cluster 1 was used for mdgsa analysis. In the original paper the target predictions were from miRTarget tool that integrates predictions from miRTarbase and miRecords (Kassambara et al. 2017). In the original publication, functional enrichment analysis was done by ClusterProfiler (R/Bioconductor) and Molecular Signatures Database v5 (MSigDB) canonical pathways were used as gene sets (Subramanian et al. 2005). miRNA names in the dataset were converted to mirBase v21 format by miRNameConverter (v1.6.0, R/Bioconductor). Altogether 5 of the miRNAs from the original dataset were not available in the newest version of mirBase and were discarded from the analysis. These miRNAs were hsa-miR-768-5p, hsa-miR768-3p, hsa-miR-886-5p, hsa-miR-1308 and hsa-miR-886-3p.
4.2 miRNA target prediction tools
4.2.1 mirDIP4.1
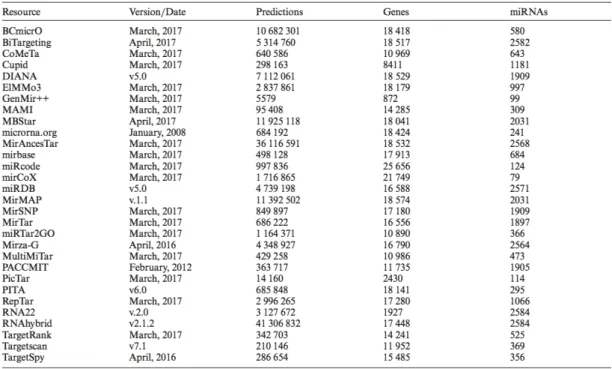
mirDIP unidirectional search v4.1 dataset was downloaded from the mirDIP4.1 webpage (March 27th 2018, http://ophid.utoronto.ca/mirDIP/). mirDIP4.1 database
combines human miRNA-target prediction information from 30 different resources (Tokar et al., 2017), which are listed in
Table 4. The original version of mirDIP database was published in 2011 (Shirdel et al. 2011) and the database is actively updated (the latest update on September 2018). Databases used for mirDIP4.1 were selected so that they have been updated or
been standardized and normalized and they use integrative score derived from the individual resources to classify the target predictions. In mirDIP4.1 dataset, predictions are ranked into four different classes: very high (top 1%), high (top 5%, excluding top 1%), medium (top 33%, excluding top 1%) and low (the rest of predictions). However, for analyses performed in this study, the mirDIP4.1 “High” dataset was filtered so, that it contains both “Very High” and “High” confidentially class and similarly, “Medium” dataset contains all interactions except those classified as “Low”. Subsetting of the full mirDIP unidirectional search v4.1 dataset was done in R by column “SCORE_CLASS”.
The mirDIP4.1 database has unique target interactions from 27667 unique genes and 2586 unique miRNAs (http://ophid.utoronto.ca/mirDIP/). The gene names in the mirDIP4.1 database are standardized according to the Hugo Gene Nomenclature Committee (HGNC, April 2017) and miRNA names are in the mirBase V21 format (www.mirbase.org). R/Bioconductor package miRNAmeConverter (version 1.6.0) was used to convert miRNA names from the used datasets into the correct format.
4.2.2 TargetScan
TargetScan algorithm was published originally in 2005 (Lewis, Burge, and Bartel 2005) and it has been updated actively since then (R. C. Friedman et al. 2009; Garcia et al. 2012; Grimson et al. 2007). Version 7.0 of TargetScan introduced a new improved algorithm that calculates context ++ scores for human and mouse target predictions (Agarwal et al. 2015). The context ++ score is calculated based on 14 different target
site features and it is concentrating on target site matches on 3’UTR regions in human
genes. TargetScan algorithm uses the conserved 8mer, 7mer and 6mer seed region matches to predict biological targets of miRNAs. TargetScan version 7.1 dataset is included in the mirDIP 4.1 dataset.
For this study, the dataset “Conserved site context++ scores” was downloaded that has all the conserved miRNA sites from www.targetscan.org (version 7.2, downloaded in October 18th 2018). This dataset has all the conserved miRNA sites
gene data, I selected the rows that have Homo Sapiens species id “9606”. There were 265217 human miRNA-target gene interactions in this dataset.
4.2.3 miRanda
The miRanda algorithm was originally published in 2003 and it has been one of the most used algorithms for miRNA target prediction (Enright et al. 2003; John et al. 2004). However, the webpage for miRanda (www.microrna.org) has stopped working during May 2018 so the algorithm is not available for use any longer. miRanda target prediction is based on a seed match, conservation and the free energy of alignment.
It is using the 3’UTR sequences of genes to find the miRNA target sites. Target predictions from miRanda algorithm were used in Bleazard et al. (Bleazard, Lamb, and Griffiths-Jones 2015) and they have also published the miRanda dataset as supplementary data. This miRanda dataset is version 3.3a filtered by free energy < -20 kcal/mol and score > 155. For analyses done in this study, this miRanda dataset was used.
4.2.4 mirTarget
miRTarget target prediction tool was used and developed by the authors of Kassambara et al. (Kassambara et al. 2017) from which one the used datasets was selected. For this study, miRTarget version 1.0.0 was downloaded from https://github.com/kassambara/miRTarget and used to get miRNA target predictions for Kassambara data to replicate the analysis done in the original publication (Kassambara et al., 2017). The full miRTarget dataset was also used to analyse the other datasets used in this study. miRTarget tool uses experimentally validated targets from the miRTarbase (http://mirtarbase.mbc.nctu.edu.tw/, release 6.0) and data from miRecords database (http://c1.accurascience.com/miRecords/, version: 27.4.2013), which contains also experimentally validated targets together with predicted targets. Target genes are selected as union of the two above mentioned databases and user can select how many of the 11 available target prediction tools in the miRecords database are used. In the original publication, only the experimentally validated targets were selected together with those targets that were predicted by
miRTarget full dataset was constructed with the same settings as in the original publication. miRecords webpage has been deprecated (tested 04/2019), but download of the dataset using mirTarget code was working when the analysis was done 04/2018. However, miRTarget is not a good choice for target prediction anymore as deprecation of miRecords database leads to outdated data eventually.
4.2.5 DIANA-microT database
DIANA-microT target predictions use 3’UTR regions of genes and mirBase annotated
miRNAs (Manolis Maragkakis et al. 2011). Target predictions from DIANA-microT v4 algorithm were used in Bleazard et al. (Bleazard, Lamb, and Griffiths-Jones 2015) and they have also published microT dataset as supplementary data and in this file miRNA names have been converted to miRBase v21. For analyses done in this study, this dataset was used for finding target gene predictions for the lists of miRNAs.
4.3 Functional enrichment analysis tools
4.3.1 BUFET
BUFET (boosting the unbiased miRNA functional enrichment using bitsets) is a tool for miRNA functional enrichment analysis (Zagganas et al. 2017). It is an improved version of the method called EmpiricalGO that was developed by Bleazard et al. (Bleazard, Lamb, and Griffiths-Jones 2015). Both BUFET and EmpiricalGO algorithms are based on analysing several random miRNA lists that are the same size as the input miRNA list. The overlap of the target genes of these miRNA lists and genes of pathways is calculated and p-value for the input miRNA list is calculated from the proportion of random miRNA lists that produced an equal or greater pathway overlap. BUFET uses Benjamini-Hochberg correction for p-value. Iterations of 10 000 random sets of miRNAs are done by default, but this can also be defined by the user. EmpiricalGO is based on the use of hash tables for the overrepresentation analysis. This makes it more computationally expensive than the BUFET method, that uses bitsets instead of hash tables. BUFET is an open source python code, that can be run
on linux or unix operating system. BUFET was downloaded from https://github.com/diwis/BUFET/ and compiled as instructed. For running BUFET python version 2.7.11 was used.
BUFET can be used with pathway information from GO, KEGG or other user defined sources, so it is a flexible method. BUFET analysis has an option to be done using the miRNA target prediction from miRanda by choosing the –miRanda option, but this option can only be utilised if the user has installed miRanda locally before May 2018. However, any desired source of miRNA target prediction information can be used as a csv file in format miRNA_name|target_gene one pair per row. The miRNA names in the interactions file and miRNA input file need to be according to the same mirBase version. BUFET analysis needs the full miRNA-target gene interaction file to be able to do the permutations with the random lists of miRNAs.
Input files necessary for BUFET analysis are a list of miRNAs, a gene synonym file from for example NCBI, a gene annotation file (gene_name|pathway_ID|pathway _name) and an interaction file that lists the interactions between genes and miRNAs. In addition to these obligatory files, there are some options that can be changed by the user. For example, the number of iterations and other options such as the number of processors, the name of output file, species name if mouse (human as default) and option --ensGO if GO ontology data is downloaded from http://ensembl.org/, can be selected by the user. For BUFET analysis, I used the gene synonym data file from NCBI (http://ftp.ncbi.nih.gov/gene/DATA/GENE_INFO/Mammalia/All_Mammalia.gene_in fo.gz), pathway data (Gene ontology (GO)) from http://ensembl.org with the --ensGO option and other pathway data modified to the correct format. To download the GO data table from http://ensembl.org, necessary columns were selected based on instructions given on BUFET manual (https://github.com/diwis/BUFET/).
4.3.2 Mdgsa
this study, version 1.10.0 of Mdgsa was used. It is based on transfer indexes that are calculated from the test statistics and p-values. The sign of test statistics (fold change) gives the direction of the change and p-value the strength of differential expression of miRNA. This index (r) is calculated for each miRNA as:
r = -sign(statistic)*log(p-value)
These indexes for each miRNA are used to calculate transfer index for each gene based on the information from differentially expressed miRNAs and miRNA target information. In this calculation, the indexes of all miRNAs targeting the same gene are summarized together. This means that the information of differentially expressed miRNAs is transferred to the gene level and the genes can be ranked according to their transfer indexes. This allows analysis to account for the additive effects of different miRNAs, since several miRNAs can target the same gene. Genes that have indexes close to zero are not showing regulation by miRNAs. If the mRNA expression data of the same samples is also available, the transfer index calculation can be modified so that only those genes that are expressed in the sample are considered in the calculations. The gene set enrichment analysis is then done for the gene list ranked by transfer index using logistic regression.
Mdgsa analysis needs the miRNA differential expression data with test statistics and p-values, miRNA-gene interaction information and gene annotations from GO or other sources. For mdgsa analysis, I used raw p-values to calculate indexes similarly as in Garcia-Garcia et al. (Garcia-Garcia et al. 2016).
Mdgsa analysis was done with default settings in which the pathway size is limited between 10 and 500 genes and with modified settings with pathway size from 5 to 500 genes.
4.3.3 ClusterProfiler
R/Bioconductor package ClusterProfiler has been used in several publications to perform the functional enrichment analysis of miRNA data (Yu et al. 2012). It was used in the analysis of one of the datasets selected for this study (Kassambara et al.
2017) and in the mirDIP4.1 publication (Tokar et al. 2017) and thus selected as an example of traditional functional analysis algorithm (v 3.6.0 used for this study). ClusterProfiler can perform overrepresentation analysis by hypergeometric distribution or gene set enrichment analysis with a permutation test. For this study, overrepresentation analysis by ClusterProfiler was used. The algorithm uses Bioconductor annotation data GO.db and KEGG.db as a source of gene sets, but it can be used with other ontologies as well. For other pathway data sources, data frames need to be modified so that one data frame has term ID and gene information and the other data frame term ID and term name information. These data frames are then used as a source of pathway information for analysis. The enrichGO function calculates the enrichment for GO terms for a given list of genes by overrepresentation analysis. This package has also functions for visualizing the enrichment results. For this study, I used ClusterProfiler algorithm with Bioconductor annotation data GO.db and with Molecular Signatures Database data.
4.4 Gene set data
Two different source of canonical pathways data for functional analyses were used. The first set was gene ontology (GO) data downloaded from Ensembl using their BioMart tool (www.ensembl.org/biomart). Version 94, which has the data for human genome assembly 38 (GRCh38.p12), was used in this study. To be able to use this dataset directly for BUFET analysis the following attributes were downloaded in this order: Ensembl Gene ID, Ensembl Transcript ID, Associated Gene Name, GO Term Accession, GO Term Name, GO Term Definition and GO Domain. The dataset was further divided by the GO domain to use only the Biological processes (BP) GO terms in the analysis by BUFET and BP, Molecular functions (MF) and Cellular components (CC) separately for the mdgsa analysis. The other canonical pathways dataset was Molecular Signatures Database v6.1 (MSigDB) canonical pathways data (Subramanian et al. 2005), which was downloaded from http://software.broadinstitute.org/gsea/msigdb. For ClusterProfiler, GO.db from
5
Results
The aim of this study was to develop an analysis work flow for miRNA functional enrichment analysis and test its functionality. The functional analysis of miRNAs includes the prediction of miRNA target genes followed by gene set enrichment analysis or overrepresentation analysis to find the affected pathways. Different target prediction tools were compared together with three different functional analysis algorithms. For this study, five different miRNA datasets were selected to be used for the comparison of target prediction tools and functional analysis tools.
5.1 Target prediction
Target gene prediction for miRNAs is an important step in the analysis of miRNA data and the confidentiality of miRNA target predictions also affects the reliability of the results of functional analysis. There are numerous tools and databases for miRNA target predictions, which are based on different algorithms and different biological properties of miRNAs. Different algorithms and their biological background were described in detail in Section 2.3.
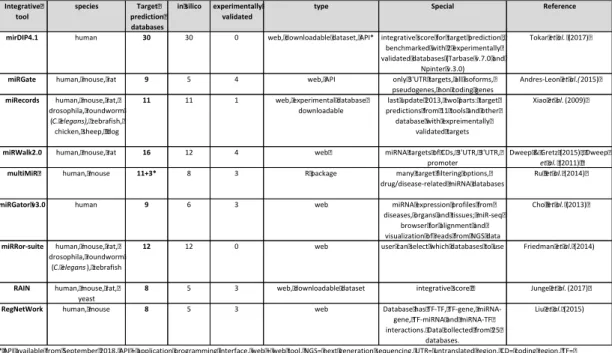
To select the target prediction tools for this analysis, different tools and databases for miRNA target predictions were searched from the literature. Because miRNA target prediction tools are based on different biological properties of miRNAs, the results of different algorithms are not uniform. For this study, I used target predictions from some individual resources to compare the results obtained in this study to the original studies. In addition to the individual target prediction tools, one aim for this study was to find a database that collects and combines data from many different target prediction tools. A target prediction tool that combines data from many different sources may be more biologically relevant since miRNA target gene interactions that are found by many different target prediction algorithms are more reliable than interaction predictions that are based on a single algorithm. A table of integrative tools for miRNA target prediction is presented in Table 3. From these tools, mirDIP4.1 and RAIN are the only ones that are using integrative scores to combine the data from their individual sources and other databases are only
collecting individual data from different tools and the user can filter the data based on how many and/or which individual tools have predicted or have experimentally validated data for the same interaction. RAIN has 8 target databases as its source information, whereas mirDIP4.1 is collecting data from 30 different databases. Both databases can be used as web-based tools or then the full database can be downloaded for local searches or to be integrated into a work flow. RAIN has target predictions for human, mouse, rat and yeast, whereas mirDIP4.1 has data only for human miRNA gene interactions.
Table 3. Integrative tools for miRNA target prediction.
(Andrés-León, Núñez-Torres, and Rojas 2016; Cho et al. 2013; Dweep et al. 2011; Dweep and Gretz 2015; Y. Friedman, Karsenty, and Linial 2014; Junge et al. 2017; Liu et al. 2015; Ru et al. 2014; Tokar et al. 2017; Xiao et al. 2009)
Although mirDIP4.1 has only data from human miRNA target predictions, it is still very useful since many researchers are interested in data from human samples. miRecords database has the widest selection of different species having target prediction data for 9 different species from 11 target prediction databases and from 1 experimentally
Integrative tool species Target prediction databases in silico experimentally validated
type Special Reference
mirDIP4.1 human 30 30 0 web, downloadable dataset, API* integrative score for target prediction , benchmarked with 2 experimentally validated databases (Tarbase v.7.0 and
Npinter v.3.0)
Tokaret al.(2017)
miRGate human, mouse, rat 9 5 4 web, API only 3'UTR targets, all isoforms, pseudogenes, non coding genes
Andres-Leonet al.(2015)
miRecords human, mouse, rat, drosophila, roundworm (C. elegans),zebrafish, chicken, sheep, dog
11 11 1 web, experimental database downloadable
last update 2013, two parts: target predictions from 11 tools and other database with expreimentally
validated targets
Xiaoet al.(2009)
miRWalk2.0 human, mouse, rat 16 12 4 web miRNA targets of CDs, 3'UTR, 3'UTR, promoter
Dweep & Gretz (2015) , Dweep
et al.(2011)
multiMiR human, mouse 11+3* 8 3 R package many target filtering options, drug/disease-related miRNA databases
Ruet al.(2014)
miRGator v3.0 human 9 6 3 web miRNA expression profiles from diseases, organs and tissues; miR-seq
browser for alignment and visualization of reads from NGS data
Choet al.(2013)
miRRor-suite human, mouse, rat, drosophila, roundworm
(C. elegans), zebrafish
12 12 0 web user can select which databases to use Friedmanet al.(2014)
RAIN human, mouse, rat, yeast
8 5 3 web, downloadable dataset integrative score Jungeet al.(2017)
RegNetWork human, mouse 8 5 3 web Database has TF-TF, TF-gene, miRNA-gene, TF-miRNA and miRNA-TF interactions. Data collected from 25
databases.
Liuet al.(2015)
*API available from September 2018, API = application programming interface, web = web tool, NGS= next generation sequencing, UTR= untranslated region, CD= coding region, TF= transcription factor