Atmos. Meas. Tech., 6, 1533–1547, 2013 www.atmos-meas-tech.net/6/1533/2013/ doi:10.5194/amt-6-1533-2013
© Author(s) 2013. CC Attribution 3.0 License.
EGU Journal Logos (RGB)
Advances in
Geosciences
Open Access
Natural Hazards
and Earth System
Sciences
Open AccessAnnales
Geophysicae
Open AccessNonlinear Processes
in Geophysics
Open AccessAtmospheric
Chemistry
and Physics
Open AccessAtmospheric
Chemistry
and Physics
Open Access DiscussionsAtmospheric
Measurement
Techniques
Open AccessAtmospheric
Measurement
Techniques
Open Access DiscussionsBiogeosciences
Open Access Open Access
Biogeosciences
Discussions
Climate
of the Past
Open Access Open Access
Climate
of the Past
Discussions
Earth System
Dynamics
Open Access Open Access
Earth System
Dynamics
DiscussionsGeoscientific
Instrumentation
Methods and
Data Systems
Open Access
Geoscientific
Instrumentation
Methods and
Data Systems
Open Access DiscussionsGeoscientific
Model Development
Open Access Open Access
Geoscientific
Model Development
DiscussionsHydrology and
Earth System
Sciences
Open AccessHydrology and
Earth System
Sciences
Open Access DiscussionsOcean Science
Open Access Open Access
Ocean Science
DiscussionsSolid Earth
Open Access Open Access
Solid Earth
DiscussionsThe Cryosphere
Open Access Open Access
The Cryosphere
DiscussionsNatural Hazards
and Earth System
Sciences
Open Access
Discussions
Improvement of the retrieval algorithm for GOSAT SWIR XCO
2
and XCH
4
and their validation using TCCON data
Y. Yoshida1, N. Kikuchi1, I. Morino1, O. Uchino1, S. Oshchepkov1, A. Bril1, T. Saeki1, N. Schutgens2,*, G. C. Toon3, D. Wunch4, C. M. Roehl4, P. O. Wennberg4, D. W. T. Griffith5, N. M. Deutscher5,6, T. Warneke6, J. Notholt6, J. Robinson7, V. Sherlock7, B. Connor8, M. Rettinger9, R. Sussmann9, P. Ahonen10, P. Heikkinen10, E. Kyr¨o10, J. Mendonca11, K. Strong11, F. Hase12, S. Dohe12, and T. Yokota1
1National Institute for Environmental Studies, 16-2 Onogawa, Tsukuba 305-8506, Japan
2Atmosphere and Ocean Research Institute, University of Tokyo, 5-1-5 Kashiwanoha, Kashiwa 277-8568, Japan
3Jet Propulsion Laboratory, California Institute for Technology, 4800 Oak Grove Drive, Pasadena, CA, 91109-8099, USA 4California Institute for Technology, Pasadena, CA, 91125-2100, USA
5Centre for Atmospheric Chemistry, University of Wollongong, New South Wales 2522, Australia 6Institute of Environmental Physics, University of Bremen, 28334 Bremen, Germany
7National Institute of Water and Atmospheric Research, Wellington, New Zealand 8BC Consulting, Alexandra, New Zealand
9IMK-IFU, Karlsruhe Institute of Technology, Garmisch-Partenkirchen, Germany 10Finnish Meteorological Institute, Arctic Research, Sodankyl¨a, Finland
11Department of Physics, University of Toronto, 60 St. George Street, Toronto, Ontario, M5S 1A7, Canada 12IMK-ASF, Karlsruhe Institute of Technology, Karlsruhe, Germany
*now at: Atmosphere, Ocean, Planetary Physics sub-department, Clarendon Laboratory, Oxford University, Oxford, UK Correspondence to: Y. Yoshida ([email protected])
Received: 19 December 2012 – Published in Atmos. Meas. Tech. Discuss.: 30 January 2013 Revised: 23 April 2013 – Accepted: 3 May 2013 – Published: 7 June 2013
Abstract. The column-averaged dry-air mole fractions of
carbon dioxide and methane (XCO2 and XCH4) have
been retrieved from Greenhouse gases Observing SATel-lite (GOSAT) Short-Wavelength InfraRed (SWIR) observa-tions and released as a SWIR L2 product from the Na-tional Institute for Environmental Studies (NIES). XCO2
and XCH4 retrieved using the version 01.xx retrieval
algo-rithm showed large negative biases and standard deviations (−8.85 and 4.75 ppm for XCO2and−20.4 and 18.9 ppb for
XCH4, respectively) compared with data of the Total
Car-bon Column Observing Network (TCCON). Multiple rea-sons for these error characteristics (e.g., solar irradiance database, handling of aerosol scattering) are identified and corrected in a revised version of the retrieval algorithm (ver-sion 02.xx). The improved retrieval algorithm shows much smaller biases and standard deviations (−1.48 and 2.09 ppm for XCO2 and−5.9 and 12.6 ppb for XCH4, respectively)
than the version 01.xx. Also, the number of post-screened measurements is increased, especially at northern mid- and high-latitudinal areas.
1 Introduction
Atmospheric carbon dioxide (CO2)and methane (CH4)are
well-known major anthropogenic greenhouse gases, and it is important to accurately monitor their concentration lev-els and fluxes on global and regional scales. Satellite mea-surements enable global distributions of these gases to be obtained with a temporal resolution of several days to a few weeks and are expected to improve accuracies in the estimates of fluxes of these gases (Rayner and O’Brien, 2001; Chevallier et al., 2007, 2009; Hungershoefer et al., 2010; Palmer et al., 2011; Takagi et al., 2011; Maksyutov et al., 2012).
The Japanese Ministry of the Environment, the Na-tional Institute for Environmental Studies (NIES), and the Japan Aerospace Exploration Agency (JAXA) jointly devel-oped the Greenhouse Gases Observing SATellite (GOSAT; Yokota et al., 2004) to monitor the global distributions of CO2 and CH4 from space. GOSAT is equipped with
two instruments: the Thermal And Near infrared Sensor for carbon Observation–Fourier Transform Spectrometer
1
Figure 1. Impact of changing the solar irradiance database in the retrieved (a) XCO2 2
and (b) XCH4 as a function of airmass. 3
4
43
Fig. 1. Impact of changing the solar irradiance database in the re-trieved (a) XCO2and (b) XCH4as a function of air mass.
FTS) and the Cloud and Aerosol Imager (TANSO-CAI) (Kuze et al., 2009). The TANSO-FTS obtains high-spectral-resolution spectra in the Short-Wavelength InfraRed (SWIR; Bands 1, 2, and 3 centered at 0.76, 1.6, and 2.0 µm, respectively) and in the Thermal InfraRed (TIR; Band 4 at 5.5–14.3 µm). Also, TANSO-FTS SWIR can change its gain to improve the dynamic range; medium gain (Gain-M) is used over bright surfaces such as Sahara and central Aus-tralia, whereas high gain (Gain-H) is used elsewhere. JAXA is responsible for producing calibrated radiances (released as a Level 1B (L1B) product), while NIES is responsible for the development of algorithm to retrieve the column-averaged dry-air mole fractions of CO2and CH4(XCO2 and XCH4;
released as a SWIR Level 2 (L2) product) from SWIR spec-tra, validate the retrieved XCO2 and XCH4, and estimate
the global carbon fluxes (released as a L4 product) from the SWIR L2 products.
Atmospheric light scattering has a large impact on the retrieved XCO2 and XCH4 from SWIR spectra (Mao and
Kawa, 2004; Houweling et al., 2005; Butz et al., 2009; Reuter et al., 2010), and the major difference among SWIR retrieval algorithms is the handling of the optical path length modifi-cation that results from the scattering. As a general strategy for NIES SWIR retrieval, we decided to apply strict cloud screening and then retrieve aerosol parameters and surface pressure simultaneously with XCO2and XCH4to represent
the equivalent optical path length on these screened data. The SWIR L2 version 01.xx (V01.xx; note that “xx” refers to different versions of L1B used in the L2 processing) algo-rithm retrieved a single parameter of aerosol optical depth (AOD) while other aerosol-related parameters were assumed and fixed (Yoshida et al., 2011). Morino et al. (2011) made
1
Figure 2. Relationship between retrieved surface pressure and AOD for the SWIR L2 2
V01.xx retrieval algorithm. The thick black line indicates the threshold of AOD = 0.5 3
for post-screening. 4
5
44
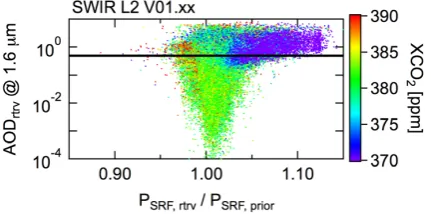
Fig. 2. Relationship between retrieved surface pressure and AOD for the SWIR L2 V01.xx retrieval algorithm. The thick black line indicates the threshold of AOD=0.5 for post-screening.
a preliminary validation of the SWIR L2 V01.xx XCO2and
XCH4 by comparing them with data from the Total Carbon
Column Observing Network (TCCON; Wunch et al., 2011a). They showed that the SWIR L2 V01.xx XCO2 and XCH4
were systematically underestimated by 8.85±4.75 ppm and 20.4±18.9 ppb, respectively. These biases and standard de-viations are larger than those of other retrieval algorithms (Oshchepkov et al., 2011, 2012; Butz et al., 2011; Parker et al., 2011; O’Dell et al., 2012; Crisp et al., 2012; Schepers et al., 2012; Cogan et al., 2012). Through detailed analysis of the retrieval results and some additional case studies (Uchino et al., 2012), we identified the major bias sources.
In this paper, we describe our updated retrieval algorithm, SWIR L2 version 02.xx (V02.xx), and show its validation against the TCCON data. Section 2 describes major bias sources of the SWIR L2 V01.xx and their impacts on the retrieved XCO2and XCH4. Section 3 summarizes the SWIR
L2 V02.xx retrieval algorithm, and its validation results are presented in Sect. 4. Section 5 gives a summary.
2 Major bias sources of the SWIR L2 V01.xx retrievals
We have identified several causes of bias in the SWIR L2 V01.xx XCO2and XCH4. Sensitivity tests were conducted to
quantify the impact of each bias source on the retrieval results by changing various aspects of the retrieval settings. Table 1 summarizes the difference of retrieval settings between sen-sitivity tests. Other retrieval settings were the same as those of the SWIR L2 V01.xx (see Yoshida et al., 2011 for de-tails). About two years of data from April 2009 to May 2011 (∼250 000 scans after cloud screening) were used in these sensitivity studies.
2.1 Solar irradiance database
A high-resolution solar irradiance database reported by R. Kurucz (http://kurucz.harvard.edu/sun/irradiance2008/) was used in the SWIR L2 V01.xx retrieval analysis (Yoshida et al., 2011). This database was based on a solar spec-trum measured with a high-resolution FTS at the Kitt Peak
Table 1. Retrieval settings of the sensitivity studies shown in this paper. The other settings are the same as those of the SWIR L2 V01.xx retrieval.
Solar Aerosol L1B
irradiance profile non-linearity zero-level database (SPRINTARS) correction offset Case 1-1 Kurucz No No No Case 1-2 Toon No No No Case 2-1 Toon 0–2 km (V3.54) No No Case 2-2 Toon 0–2 km (V3.84) No No Case 2-3 Toon retrieved (V3.84) No No Case 3-1 Toon No No No Case 3-2 Toon No applied No Case 3-3 Toon No No retrieved Case 3-4 Toon No applied retrieved
National Observatory, and the telluric line structure was re-moved in the same manner as Kurucz (2005). A new so-lar spectrum provided by G. C. Toon based on balloon FTS spectra acquired from above 30 km altitude, in addition to ground-based Kitt Peak and TCCON spectra, was evaluated for the SWIR L2 V02.xx retrievals. As reported by Uchino et al. (2012), residual telluric absorptions were observed in the Kurucz solar database that were not present in the Toon solar spectrum (see Fig. 5 of Uchino et al., 2012).
Figure 1 shows a result of a retrieval sensitivity test by changing from the Kurucz solar irradiance (Case 1-1) to the Toon database (Case 1-2). Here, the retrieval was conducted under the assumption of zero aerosol to focus on the impact of the solar spectrum. The resulting difference in the surface pressure was small (<0.2 %) due to overwhelmingly strong telluric O2absorption in the A-band range, while differences
in XCO2and XCH4reached 2 and 1 % respectively,
depend-ing on air mass. Typical biases in XCO2and XCH4due to
the solar spectrum were evaluated to be about−3 ppm and +7 ppb, respectively.
2.2 Aerosol parameter and surface pressure
The TANSO-FTS SWIR Bands 1 (0.76 µm), 2 (1.6 µm), and 3 (2.0 µm) are used for simultaneously retrieving XCO2,
XCH4, aerosol parameter, and surface pressure. Most of the
information on aerosol and surface pressure is contained in the Band 1 spectra. Since this is spectrally distant from Bands 2 and 3, in which CO2 and CH4 information is contained,
any wavelength dependence of the aerosol scattering causes the optical path length modifications to be different in Band 1 and Bands 2 and 3. Knowledge of the wavelength depen-dence of AOD is therefore necessary for accurate retrievals of XCO2and XCH4.
In the SWIR L2 V01.xx retrieval algorithm, the com-position of aerosols was assumed to be the same as that simulated by an offline three-dimensional aerosol transport model, the Spectral Radiation-Transport Model for Aerosol Species (SPRINTARS; Takemura et al., 2000). SPRINTARS
1
Figure 3. Histograms of the a priori AOD simulated by SPRINTARS. (a) 2
SPRINTARS V3.54 and (b) SPRINTARS V3.84. 3
4
45
Fig. 3. Histograms of the a priori AOD simulated by SPRINTARS. (a) SPRINTARS V3.54 and (b) SPRINTARS V3.84.
simulates the vertical distribution of mass mixing ratio for several aerosol species (soil dust, carbonaceous, sulfate, and sea salt). However, we did not use this vertical profile in-formation and assumed aerosols were uniformly distributed within a 2 km layer from the surface in the SWIR L2 re-trieval, because we had planned to use aerosol optical prop-erties derived from TANSO-CAI, which has no sensitivity to the aerosol vertical profile. The aerosol optical properties were calculated using Mie theory for a vertically averaged aerosol composition at each measurement point. Using this information, AOD and surface pressure were retrieved simul-taneously with gas concentrations to represent the equivalent optical path length (Yoshida et al., 2011).
The retrieved AOD and surface pressure tend to be un-realistically large: more than 0.5 for AOD at wavelength of 1.6 µm, and more than 50 hPa higher than the a priori surface pressure (the grid point value data provided by the Japan Me-teorological Agency) (Fig. 2). This causes negative biases in XCO2and XCH4. Uchino et al. (2012) showed that most of
the biases in AOD and surface pressure vanished and the bias in XCO2lessened, if more accurate vertical profile and
op-tical properties of aerosols were considered in the retrieval, or if the aerosol vertical profile was retrieved instead of in-tegrated AOD, although the sample size of their study was limited (9 scans at 1 site).
Size distributions of aerosols simulated by SPRINTARS were used in the calculation of aerosol optical properties. The contribution of coarse-mode particles seemed too large for the SPRINTARS V3.54 used in the SWIR L2 V01.xx, and this produces biases in XCO2and XCH4via AOD and
sur-face pressure over the region where fine-mode particles were dominant. This issue can be solved by using the latest version
1
Figure 4. Histograms of retrieved AOD (a, b, c) and the difference between retrieved 2
and a priori surface pressure (d, e, f). (a, d) Case 2-1, (b, e) Case 2-2, and (c, f) Case 2-3. 3
Thick black line in (a, b, c) indicates the threshold value of AOD = 0.5 for post-screening. 4
5
46
Fig. 4. Histograms of retrieved AOD (a, b, c) and the difference between retrieved and a priori surface pressure (d, e, f). (a, d) Case 2-1, (b, e) Case 2-2, and (c, f) Case 2-3. Thick black line in (a, b, c) indicates the threshold value of AOD=0.5 for post-screening.
of SPRINTARS (V3.84; Takemura et al., 2009), which uses different aerosol emission inventories and parameterizations (Fig. 3).
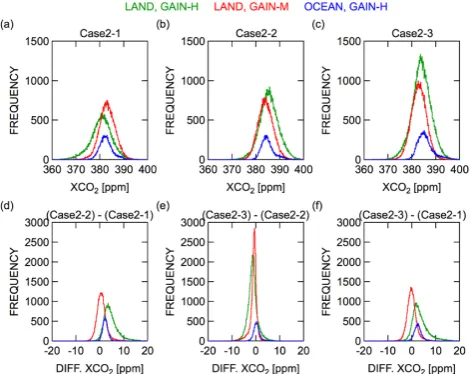
Three retrieval tests were conducted: (Case 2-1) AOD of aerosol with an assumed 2 km thick layer was retrieved with aerosol optical properties based on SPRINTARS V3.54 (same as the SWIR L2 V01.xx), (Case 2-2) same as the Case 2-1 but using SPRINTARS V3.84 optical properties, and (Case 2-3) a logarithm of aerosol mass mixing ratio pro-file was retrieved with aerosol optical properties based on SPRINTARS V3.84. The retrieval results are summarized in Figs. 4 and 5. Retrieved AOD over land with Gain-H dramat-ically decreased with the change in the aerosol optical prop-erties (Case 2-1 to Case 2-2) and retrieving the aerosol ver-tical profile (Case 2-2 to Case 2-3). As a result, the retrieved AOD showed a reasonable range for Case 2-3, and it resulted in a larger number of retrievals that passed the AOD post-screening filter, although there was no guarantee that each retrieved AOD was an accurate value. The impacts on the re-trieved XCO2and XCH4are especially large for regions with
a large negative bias in SWIR L2 V01.xx; i.e., XCO2values
lower than 370 ppm in Case 2-1 became more than 10 ppm higher in Case 2-2 and 2-3 (Fig. 5) (figures for XCH4 are
not shown, but show similar tendency as XCO2). Changes in
retrieved AOD and surface pressure between Case 2-1 and 2-2 were relatively small for Gain-M case. Because most of the Gain-M region is over deserts, where dust particles are dominant, differences in aerosol optical properties between SPRINTARS V3.54 and V3.84 are also relatively small. Dif-ferences in retrieved values over ocean are also small, be-cause the retrieved AODs are small for all sensitivity tests.
1
Figure 5. Histograms of retrieved XCO2 for (a) Case 2-1, (b) Case 2-2, and (c) Case 2-3. 2
Histograms of the XCO2 differences between the sensitivity studies are also shown (d, e, 3
f). 4
5
47
Fig. 5. Histograms of retrieved XCO2for (a) Case 2-1, (b) Case 2-2, and (c) Case 2-3. Histograms of the XCO2differences between
the sensitivity studies are also shown (d, e, f).
In summary, the impacts of aerosol parameters on XCO2
and XCH4 were large for land using Gain-H, where
fine-mode aerosols were expected to be dominant. Typical biases in XCO2and XCH4due to the aerosol optical properties for
land using Gain-H cases were about−3 and−12 ppb, and those due to the aerosol vertical profile handling were about +1 ppm and+4 ppb, respectively.
2.3 Non-linearity of TANSO-FTS Band 1 and surface pressure
A problem with the analog circuitry and a separate problem with the analog-to-digital converter (ADC) of the TANSO-FTS Band 1 channel cause a non-linear response of the signal chains (Suto et al., 2011; Kuze et al., 2012). In the TANSO-FTS L1B V141.141 and later, the analog circuit non-linearity was corrected, but the ADC non-linearity was not corrected due to difficulty in evaluating the correction parameters. The analog circuit non-linearity response depends on the incident radiance level and was corrected using a third-order poly-nomial to minimize the out-of-the-band artifact (Kuze et al., 2012).
In SWIR L2 V01.xx retrieval analysis, the former ver-sions of the TANSO-FTS L1B radiance spectra were used (TANSO-FTS L1B V050.050, V080.080, V100.100, V110.110, and V128.128), to which the non-linearity cor-rection (NLC) was not applied. The non-linear response of the detector recording the interferogram creates a radiance offset in the spectral domain, whose magnitude is changing with the input radiance level, resulting in apparently weaker absorption lines. Associated systematic biases are therefore to be expected in the results of the SWIR L2 V01.xx re-trievals. Figure 6 compares a retrieved surface pressure nor-malized with its prior value from the radiance spectra with
Table 2. Empirical noise coefficients. The coefficients of each spectral window were preliminarily evaluated from the relationships between SNR and the mean-squared values of the residual spectra. For details, see text in Sect. 3.2.
a0 a1 a2
O2sub-band
land, Gain H 1.095 −9.616×10⁻⁵ 1.246×10⁻⁵ land, Gain M 0.8903 3.925×10⁻³ 2.633×10⁻⁶ ocean 1.027 1.137×10⁻³ 1.096×10⁻⁵
CO2sub-band
land, Gain H 1.163 −6.922×10⁻⁴ 8.207×10⁻⁶ land, Gain M 0.8956 9.440×10⁻⁴ 5.801×10⁻⁶ ocean 1.064 4.094×10⁻⁴ 9.595×10⁻⁶
CH4sub-band
land, Gain H 1.115 −1.003×10⁻³ 8.121×10⁻⁶ land, Gain M 1.240 −1.844×10⁻³ 8.871×10⁻⁶ ocean 0.986 2.413×10⁻⁴ 1.163×10⁻⁵
SCO2sub-band
land, Gain H 0.995 3.151×10⁻⁴ 1.505×10⁻⁵ land, Gain M 0.393 3.193×10⁻³ 1.302×10⁻⁵ ocean 0.912 8.419×10⁻⁴ 1.875×10⁻⁵
1
Figure 6. Relationship between the retrieved surface pressure normalized with its a 2
priori value and SNR. (Case 3-1) TANSO-FTS L1B without non-linearity correction 3
(NLC). (Case 3-2) TANSO-FTS L1B with non-linearity correction. 4
5
48
Fig. 6. Relationship between the retrieved surface pressure normal-ized with its a priori value and SNR. (Case 3-1) TANSO-FTS L1B without non-linearity correction (NLC). (Case 3-2) TANSO-FTS L1B with non-linearity correction.
and without NLC (Cases 3-2 and 3-1). To focus on the non-linearity response impact, only ocean data were used and we assumed aerosol-free conditions for these scenarios. The op-tical path length shortening effect is dominant over the ocean due to the low reflectance of the ocean surface except for the sun-glint direction. Therefore, the upper envelope of the plotted data in Fig. 6 can be considered to be largely unin-fluenced by aerosols. The negative slope of the upper en-velope of the corrected spectra indicates that the non-linearity response increases as the signal level (and hence the signal-to-noise ratio (SNR)) increases. The retrieved sur-face pressures from the corrected spectra were higher than those from the uncorrected spectra, because the removal of the non-linearity response makes the absorption lines deeper. However, the upper envelope for corrected spectra still shows a less steep but negative slope. This remaining SNR depen-dency might come from the ADC non-linearity, which was not corrected in the TANSO-FTS L1B used in these tests. Butz et al. (2011) showed that the impact of the non-linearity
1
Figure 7. (a) Retrieved surface pressure normalized with its a priori value and (b) 2
retrieved zero-level offset value as a function of SNR when the zero-level offset for 3
TANSO-FTS Band 1 is retrieved simultaneously. (Case 3-3) TANSO-FTS L1B without 4
non-linearity correction is used. (Case 3-4) TANSO-FTS L1B with non-linearity 5
correction is used. 6
7
49
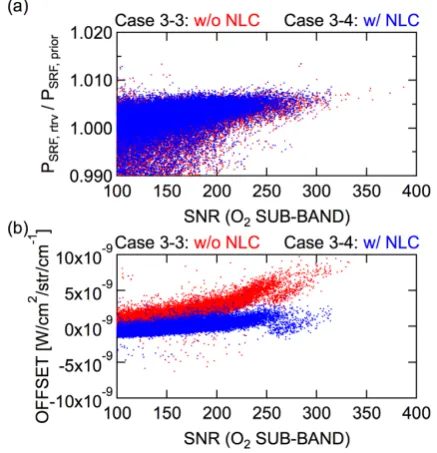
Fig. 7. (a) Retrieved surface pressure normalized with its a priori value and (b) retrieved zero-level offset value as a function of SNR when the zero-level offset for TANSO-FTS Band 1 is retrieved si-multaneously. (Case 3-3) TANSO-FTS L1B without non-linearity correction is used. (Case 3-4) TANSO-FTS L1B with non-linearity correction is used.
response of TANSO-FTS L1B could be reduced by includ-ing a wavenumber-independent offset for the O2A-band
ra-diances (hereafter referred to as zero-level offset) into the state vector. Figure 7 shows the retrieved surface pressures and zero-level offsets (Cases 3-3 and 3-4). The upper en-velopes of the retrieved surface pressures became flatter by retrieving the zero-level offset simultaneously. Furthermore,
1
Figure 8. Retrieved scaling factor for the absorption cross-section of O2 as a function of 2
SNR. A constant value of 1.01 (blue line) shows the upper envelope of the retrieval 3
results. 4
5
50
Fig. 8. Retrieved scaling factor for the absorption cross section of O2as a function of SNR. A constant value of 1.01 (blue line) shows the upper envelope of the retrieval results.
1
Figure 9. Fractions of data which passed (a) pre- and (b) post-screening filter of the 2
SWIR L2 V02.xx analysis. As for the reference, fractions for pre-screening with 3
blended-albedo filter (PRE + blended_albedo) and pre-screening without SNR filter 4
(PRE - SNR) are also shown. 5
6
51
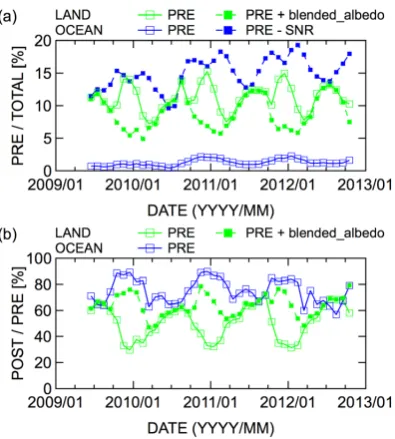
Fig. 9. Fractions of data that passed (a) pre- and (b) post-screening filter of the SWIR L2 V02.xx analysis. As for the reference, fractions for pre-screening with blended-albedo fil-ter (PRE+blended albedo) and pre-screening without SNR filter (PRE – SNR) are also shown.
no significant difference was found between the retrieved surface pressures from non-corrected spectra and those from corrected spectra, because the wavenumber dependency of the corrected non-linearity response in the TANSO-FTS L1B was small. From the view point of the retrieval results, NLC just changed the retrieved zero-level offset values. The re-trieved zero-level offsets provide some confirmation of the validity of the NLC; retrieved zero-level offsets from the NLC spectra were closer to zero than those from the non-corrected spectra.
A positive bias still remains in the retrieved surface pres-sure (Fig. 7a). This residual bias was removed by adjusting the absorption cross section of O2(Butz et al., 2011; Crisp
et al., 2012), although its root cause of the bias was un-clear. The O2absorption cross section scaling factor of 1.01
1
Figure 10. Comparison of the latitudinal distributions of the (a, c) number of data 2
points and (b, d) zonal mean of the retrieved XCO2 and XCH4, respectively. For V01.xx 3
and V02.xx in June 2009. The error bars in (b, d) are the standard deviations of the 4
zonal variation. 5
6
7
52
Fig. 10. Comparison of the latitudinal distributions of the (a, c) number of data points and (b, d) zonal mean of the retrieved XCO2
and XCH4. For V01.xx and V02.xx in June 2009. The error bars in
(b, d) are the standard deviations of the zonal variation.
was evaluated according to the method of Butz et al. (2011) (Fig. 8). Note that different algorithms use different values of this scaling factor: 1.030 for Butz et al. (2011) and 1.025 for Crisp et al. (2012).
3 SWIR L2 V02.xx retrieval algorithm
The basic strategy of the SWIR L2 V02.xx retrieval algo-rithm is the same as that of V01.xx: good-quality spectra ob-served in cloud-free regions are selected first; then XCO2and
XCH4 are simultaneously retrieved based on the maximum
a posteriori (MAP) retrieval (Rodgers, 2000) under the as-sumption of a cloud-free atmosphere, and finally the quality of the retrieved results is evaluated. In the following section, the differences between V01.xx and V02.xx are described.
3.1 Geometric and radiometric corrections
There is a known pointing anomaly in the TANSO-FTS (Kuze et al., 2012). The anomaly has changed with time and has been quantified using a monitor camera image by JAXA and NIES. The pointing anomaly was corrected by shifting the pointing angle, and this made small changes in the viewing angle (∼0.5 deg. for along-track direction and ∼0.3 deg. for cross-track direction) and, as a result, the air mass value (∼0.01). The apparent TANSO-FTS footprint area projected on the TANSO-CAI image was also shifted, changing the cloud-screening results. Furthermore, the radio-metric degradation of TANSO-FTS was corrected according to Yoshida et al. (2012).
3.2 Retrieval settings
In the SWIR L2 V02.xx retrieval, we use all spectral channels within four spectral windows: 12950 to 13 200 cm−1 (here-after referred to as the O2 sub-band), 6180 to 6380 cm−1
(CO2 sub-band), 5900 to 6150 cm−1 (CH4 sub-band), and
4800 to 4900 cm−1(SCO2 sub-band). The gaseous profiles
1
Figure 11. Monthly averages of the retrieved XCO
2within 5 x 5 degree grid boxes. A
2
blank indicates that no valid retrieval result was available within the grid box.
3
4
53
Fig. 11. Monthly averages of the retrieved XCO2within 5×5 degree grid boxes. A blank indicates that no valid retrieval result was available within the grid box.
of CO2, CH4, and water vapor (H2O) are simultaneously
re-trieved with the aerosol profile, surface pressure, offset of the a priori temperature profile, wavenumber dispersions for each spectral window, zero-level offset for the O2sub-band,
surface albedos for each spectral window for land case, and surface wind speed for ocean case. The number of vertical layers for gaseous profiles is 15 and for aerosol profile is 6. The a priori profiles and variance–covariance matrices of CO2and CH4are taken from the most recent version of the
atmospheric transport model (Saeki et al., 2013). As for the aerosol parameter, logarithms of the mass mixing ratios of fine-mode aerosols (carbonaceous and sulfate) and coarse-mode aerosols (soil dust and sea salt) are retrieved. The a priori values of these aerosol mass mixing ratio profiles are calculated by SPRINTARS V3.84 (Takemura et al., 2009).
The optimal solution of the MAP retrieval can be obtained by minimizing the following cost function:
J (x)=[y−F (x,b)]TS−ε1[y−F (x,b)]
+(x−xa)TSa−1(x−xa) (1)
whereyis the measurement vector,x the state vector to be retrieved,F (x,b)a forward model that relates the state vec-tor to the observed spectrum,ba vector of model parame-ters assumed in the forward model,xa the a priori state of
x, Sathe a priori variance–covariance matrix, and Sε the
er-ror covariance matrix. The residual spectrumεbetween the measured and simulated spectra comprises the measurement errorεmeas, the forward model error1f, and the model
pa-rameter error Kb
b− ˆb.
ε≡y−F (x,b)=εmeas+1f+Kb
b−bˆ (2) Here, Kbis the Jacobian matrix for a model parameterb, and
ˆ
bis the true value ofb.
1
Figure 12. Monthly averages of the retrieved XCH
4within 5 x 5 degree grid boxes. A
2
blank indicates that no valid retrieval result was available within the grid box.
3
4
54
Fig. 12. Monthly averages of the retrieved XCH4within 5×5 degree grid boxes. A blank indicates that no valid retrieval result was available within the grid box.
In the SWIR L2 V01.xx retrievals, we neglected the contri-bution of the forward model error and the model parameter error and assumed a diagonal matrix Sε with diagonal
ele-ments(εmeas)2. However, in this case, the chi-squared cost
function of the retrieved state (χ2=J(x)/m, wherem indi-cates the number of channels used in the retrieval analysis) increased as the SNR increased, indicating that the contribu-tion of the forward model error and/or the model parameter error became large with SNR. Because it was hard to eval-uate the forward model error and the model parameter error adequately, the contributions of these error components were empirically modeled as a function of SNR (Crisp et al., 2012; note that they use a different formula for empirical noise).
εempirical=εmeas
q
a0+a1SNR+a2SNR2 (3)
Here, coefficients a0, a1, and a2 of each spectral window
were preliminarily evaluated from the relationships between SNR and the mean-squared values of the residual spectra
(Table 2). A diagonal matrix Sε with its diagonal value of
εempirical 2
is used in the SWIR L2 V02.xx retrieval.
3.3 Post-screening
According to the above-mentioned changes, the post-screening items and their thresholds were also re-examined. The requirement for the degrees of freedom for signal (DFSs), which describes the number of independent quan-tities obtainable from the observation, to be greater than or equal to unity is the same as for V01.xx. Regarding the check of the spectrum fitting, the mean-squared values of the resid-ual spectra must be less than or eqresid-ual to 1.2, 1.2, 1.3, and 1.4 for O2, CO2, CH4, and SCO2sub-bands, respectively. Since
the typical range of the retrieved AOD had changed (Fig. 4), a threshold of 0.1 is now used (i.e., retrieved AOD at wave-length of 1.6 µm must be less than or equal to 0.1). Further, to exclude outliers due to the highly biased surface pressure, the retrieval results are removed when the deviation of the
Table 3. Summary of the comparison between SWIR L2 V02.xx products and TCCON measurements for (a) XCO2and (b) XCH4. Com-parisons are made for different versions of the GGG software and observation periods. The GOSAT data are retrieved within a±2 degree latitude/longitude box centered at each TCCON site, and TCCON data are the mean values measured within±30 min of GOSAT overpass time.N,A, andσ indicate number of matched data, average of their differences (station bias), and standard deviation of their differences. Average and standard deviation of the station bias is also shown at the bottom of the table.
(a)
GOSAT – TCCON (GGG2009) GOSAT – TCCON (GGG2012) GOSAT – TCCON (GGG2012) Site Latitude [deg.] Longitude [deg.] June 2009∼July 2010 June 2009∼July 2010 whole available period
N A[ppm] σ[ppm] N A[ppm] σ[ppm] N A[ppm] σ[ppm]
Eureka 80.05 −86.42 0 – – 0 – – 5 −1.49 0.98
Sodankyla 67.37 26.63 5 −0.70 2.00 11 −1.28 1.88 28 −0.97 1.57 Bialystok 53.23 23.03 3 1.76 2.22 3 1.09 2.20 4 0.61 2.04 Bremen 53.10 8.85 3 0.21 0.83 3 −0.34 0.83 6 0.25 1.25 Karlsruhe 49.10 8.44 0 – – 4 −0.71 1.84 32 −1.48 2.12 Orleans 47.97 2.11 7 −0.27 1.52 10 −1.06 1.35 20 −1.14 1.55 Garmisch 47.48 11.06 3 −0.38 1.07 6 0.09 1.32 20 −0.35 2.20 Park Falls 45.95 −90.27 14 −2.21 1.75 16 −2.56 1.75 49 −1.56 1.70 Lamont 36.60 −97.49 88 −2.25 1.33 102 −2.32 1.46 326 −2.23 1.62 Tsukuba 36.05 140.12 39 0.56 1.85 39 0.07 1.88 77 0.90 2.04 Darwin −12.42 130.89 13 −1.94 1.54 16 −2.31 1.47 32 −1.82 1.63 Wollongong −34.41 150.88 30 −0.32 1.84 24 −1.00 1.86 92 −1.25 2.66 Lauder −45.04 169.68 5 −1.98 1.47 6 −2.45 1.28 28 −1.67 1.30 Total (single scan) 210 −1.20 1.97 240 −1.56 1.88 719 −1.48 2.09 Total (station biasA) 11 −0.68 1.30 12 −1.06 1.18 13 −0.94 0.98 (b)
Eureka 80.05 −86.42 0 – – 0 – – 5 10.3 10.2
Sodankyla 67.37 26.63 5 −9.6 12.1 11 −10.0 8.9 28 −7.8 9.6 Bialystok 53.23 23.03 3 13.5 4.3 3 12.2 4.7 4 7.8 9.7
Bremen 53.10 8.85 3 5.3 5.9 3 4.3 5.9 6 2.6 7.8
Karlsruhe 49.10 8.44 0 – – 4 −14.0 3.1 32 −6.2 12.3 Orleans 47.97 2.11 7 −4.1 7.4 10 −4.3 8.3 20 −4.5 8.8 Garmisch 47.48 11.06 3 11.8 3.5 6 12.9 5.7 20 3.9 16.1 Park Falls 45.95 −90.27 14 −8.3 10.0 16 −8.0 10.0 49 −1.1 11.0 Lamont 36.60 −97.49 88 −9.5 10.1 102 −8.1 9.9 326 −7.5 10.7 Tsukuba 36.05 140.12 39 1.7 10.8 39 3.8 10.9 77 4.0 10.6 Darwin −12.42 130.89 13 −13.1 6.9 16 −14.4 7.6 32 -10.3 9.6 Wollongong −34.41 150.88 30 −14.1 11.8 24 −11.6 11.8 92 −12.3 14.8 Lauder −45.04 169.68 8 −10.9 26.5 9 −8.4 24.8 32 −7.9 15.1 Total (single scan) 213 −7.3 12.6 243 −6.1 12.3 723 −5.9 12.6 Total (station biasA) 11 −3.4 9.9 12 −3.8 9.7 13 −2.2 7.3
retrieved surface pressure from its prior value is larger than 20 hPa. Data over the ice/snow surface are removed by using the so-called blended albedo (Wunch et al., 2011b), because the retrieved XCO2and XCH4over the ice/snow surface tend
to show very low concentrations, probably due to undetected aerosols/clouds.
3.4 Retrieval results
The SWIR L2 V02.xx retrievals use the TANSO-FTS L1B V141.141 and later (V141.141, V150.150, and V150.151 as of December 2012, corresponding to SWIR L2 V02.00, V02.10, and V02.11, respectively). The TANSO-FTS L1B V141.141 is the sample of V150.150 and processed by the same algorithm with a different computer system; therefore, differences between them are negligibly small. An
inade-quate parameter setting for sun-glint flag was found in the TANSO-FTS L1B V150.150 and former, and it was fixed in V150.151. Because the SWIR L2 V02.xx processing does not use the sun-glint flag, SWIR L2 V02.00, V02.10, and V02.11 can be treated as a single version.
Figure 9 shows the time series of the fractions of the pre- and post-screened measurements. The average fraction of about 10 % for the pre-screened measurements over land is roughly consistent with the clear-sky occurrence of 11 % evaluated by Eguchi and Yokota (2008). The large seasonal variation of the spatial coverage over land is a result of the solar zenith angle requirement (less than 70 deg.) and the misidentification of the CAI cloud flag over snow surface at northern high-latitudinal regions in winter and early spring. Due to the low reflectance of water, the pre-screened mea-surements over ocean are limited to the sun-glint region and
Fig. 13. Time series of the SWIR L2 V02.xx and TCCON XCO2(GGG2012) and their difference for each TCCON site. All available data are used. The GOSAT data are retrieved within a±2 degree latitude/longitude box centered at each TCCON site, and TCCON data are the mean values measured within±30 min of GOSAT overpass time.
the fraction is smaller than 1 to 2 %. The number of pre-screened measurements over ocean is increased after Au-gust 2010, because the image motion compensation (IMC) has been used for the sun-glint observation to reduce the cloud contamination (Kuze et al., 2012). More than 50 % of the pre-screened measurements passed the post-screening fil-ter except for the land cases during October to March. For
these periods, about half of the measurements were over ice/snow surfaces, and the blended albedo post-screening filter removes most of the snow/ice-covered measurements. The strictest post-screening filter is the AOD, and the sea-sonal variation of the post-screened fraction could reflect the spatiotemporal distribution of aerosols; for example, a larger fraction over ocean might be due to the smaller AOD over
Fig. 14. Time series of the SWIR L2 V02.xx and TCCON XCH4(GGG2012) and their difference for each TCCON site. All available data
are used. The GOSAT data are retrieved within a±2 degree latitude/longitude box centered at each TCCON site, and TCCON data are the mean values measured within±30 min of GOSAT overpass time.
ocean; a smaller fraction over land during February to May might be related to the activities of the Saharan dust and Asian dust. Figure 10 shows the comparison of the latitudi-nal distributions of the XCO2 and XCH4 between V01.xx
and V02.xx for June 2009. The number of post-screened measurements is increased especially at northern mid- and high-latitudinal regions where V01.xx tended to show large
AOD and surface pressure values. The increase of the aver-aged XCO2 value by more than 5 ppm indicates a smaller
bias in XCO2 for V02.xx. Further, the much smaller
stan-dard deviations in XCO2and XCH4for V02.xx indicate the
substantially improved consistency of the results and the re-duced number of potential outliers. Figures 11 and 12 show the global distributions of XCO2and XCH4from June 2009
Fig. 15. Difference between the SWIR L2 V02.xx and TCCON data (GGG2012) as a function of (a, b) retrieved surface pressure, (c, d) retrieved surface albedo, (e, f) retrieved AOD, and (g, h) time for XCO2and XCH4. All available data are used. Red dots are the individual
results, and the average and standard deviation are shown with blue squares and vertical bars. Gray histograms show the number of data points contained within each bin.
1
2
Figure 16. (a, b, c) Difference between retrieved and a priori surface pressures and (d, 3
e, f) the retrieved AOD as a function of SNR. The measured scan is categorized with 4
the gain (Gain-H / Gain-M) and surface type (LAND / OCEAN). 5
6
58
Fig. 16. (a, b, c) Difference between retrieved and a priori surface pressures and (d, e, f) the retrieved AOD as a function of SNR. The measured scan is categorized with the gain (Gain-H/Gain-M) and surface type (LAND/OCEAN).
to May 2010 (see Supplement for other months). The sea-sonal cycle in XCO2 and latitudinal gradient in XCH4 are
clearly evident.
4 Validation results
The SWIR L2 V02.xx products are compared with TCCON data in the same manner as described in Morino et al. (2011). The TCCON data used in this paper represent the mean values measured at each TCCON site within ±30 min of GOSAT overpass time (around 13:00 local time in general). The SWIR L2 V02.xx products are selected within a ±2 de-gree latitude/longitude box centered at each TCCON site. Recently, the data analysis software used commonly in TC-CON was updated from its previous version of GGG2009 to the latest version of GGG2012. Therefore, we compare the SWIR L2 V02.xx products with TCCON data under the following three conditions: (1) TCCON data analyzed by GGG2009 are used, and the observation period is limited until July 2010 (same conditions with Morino et al., 2011); (2) TCCON data analyzed by GGG2012 are used, and the
observation period is limited until July 2010; and (3) TC-CON data analyzed by GGG2012 are used for the whole available period. Figures 13 and 14 show the time series of the SWIR L2 V02.xx products, TCCON data (GGG2012), and their differences (hereafter, 1XCO2 and 1XCH4) at
each TCCON site. Also, Table 3 summarizes the statistics of1XCO2and1XCH4for all cases. The time-series plots
for GGG2009 case and the validation results using a±5 de-gree latitude/longitude box instead of a±2 degree box are shown in the Supplement.
The XCO2 and XCH4 of the SWIR L2 V02.xx are in
reasonable agreement with the TCCON data, although there still exist some outliers. The average and standard deviation of the differences between the SWIR L2 V02.xx products and TCCON data using different versions of the GGG soft-ware and observation periods give similar results, and they are evaluated to be−1.48 and 2.09 ppm for XCO2and−5.9
and 12.6 ppb for XCH4when using GGG2012 for the whole
available period. The standard deviation of the averaged dif-ferences at each TCCON site, which indicates the relative regional-scale accuracy, is 0.98 ppm for XCO2 and 7.3 ppb
for XCH4. The results of the intercomparison with TCCON
are greatly improved compared to V01.xx. Figure 15 shows the 1XCO2 and 1XCH4 as a function of simultaneously
retrieved auxiliary parameters and time. The 1XCO2 and
1XCH4show small dependencies on these auxiliary
param-eters. Although the dependencies are generally small, the negative values of1XCO2and1XCH4in regions with high
surface albedo may indicate overcorrection of aerosols, be-cause the optical path lengthening effect is dominant in re-gions with high albedo. Slightly large negative biases are found before January 2010 probably due to the insufficient correction of the radiometric degradation of TANSO-FTS. Since TANSO-FTS rapidly degraded in this period (Yoshida et al., 2012), a simple exponential degradation model might not represent the actual degradation.
Unfortunately, the comparison using TCCON data is re-stricted to land data with Gain-H, because there is no suitable TCCON site for validating the retrieval results over bright surfaces, where the TANSO-FTS operates in Gain-M, and those over ocean, where the wind speed is retrieved instead of surface albedo. The characteristics of the retrieved sur-face pressure and AOD, which determine the equivalent op-tical path length, are checked instead of validating the XCO2
and XCH4for these cases. Figure 16 shows the SNR
depen-dencies of the retrieved surface pressure and AOD. The re-trieved surface pressure shows almost zero bias for land us-ing Gain-H, while those for land usus-ing Gain-M show clear negative biases of about 5 hPa. For measurements made over ocean, the surface pressure bias is almost zero when the SNR is relatively high (>150); however, it tends to be overes-timated when the SNR is low. Furthermore, AOD tends to be too large when SNR is high (low) for measurement over land (ocean). The different tendencies between Gain-H and Gain-M over land might be caused by the uncorrected
non-linear response of the TANSO-FTS. The non-non-linearity re-sponse due to the ADC, which is not corrected in the lat-est TANSO-FTS L1B product, makes the absorption lines deeper (H. Suto, personal communication, 2012). In other words, the ADC non-linearity response makes the equiva-lent optical path length longer. It results in overestimations of surface pressure and/or AOD for bright surfaces. The large AODs at high SNRs retrieved over land are consistent with this. The different response between land and ocean using Gain-H might come from the different handling of the sur-face reflectance. One ocean wind speed parameter might be insufficient to describe a reflectance of “dark” ocean surface. Further investigations are necessary to reduce the Gain-H/M and land/ocean differences.
Extended validation using aircraft measurement data (In-oue et al., 2013), comparison with other retrieval algorithms (Oshchepkov et al., 2013), and a preliminary analysis of CO2
flux estimation using the SWIR L2 V02.xx data (Maksyutov et al., 2012) are discussed in other papers.
5 Summary
An improved retrieval algorithm for XCO2and XCH4from
GOSAT TANSO-FTS SWIR observations for cloud-free scenes is presented and validated using the TCCON data. Most of the biases in the SWIR L2 V01.xx XCO2and XCH4
are reduced due to (i) replacing the solar irradiance database (+3 ppm and−7 ppb, respectively), (ii) improving the opti-cal properties of aerosols (+3 ppm and+12 ppb), (iii) chang-ing the handlchang-ing of the aerosol vertical profile (−1 ppm and −4 ppb), and (iv) removing the surface pressure bias by scaling the absorption cross section of O2 (+2 ppm and
+10 ppb). As a result, the biases in XCO2and XCH4are
im-proved from−8.85 ppm and−20.4 ppb to −1.48 ppm and −5.9 ppb, respectively. Furthermore, standard deviations are also improved mainly due to the simultaneous retrieval of the aerosol vertical profiles (from 4.75 ppm and 18.9 ppb to 2.09 ppm and 12.6 ppb). However, differences in the retrieval results due to the Gain-H/M and land/ocean differences still remain. More precise analysis including the non-linearity re-sponse of the TANSO-FTS L1B is needed to further improve the retrieval results.
Supplementary material related to this article is available online at: http://www.atmos-meas-tech.net/6/ 1533/2013/amt-6-1533-2013-supplement.pdf.
Acknowledgements. The authors wish to thank Hiroshi Suto for providing useful comments on the non-linearity response of TANSO-FTS L1B and the non-linearity-corrected spectral data over ocean used in the sensitivity tests. The authors also wish to thank Ha Tran for kindly providing the line mixing and collision induced absorption code used in this study. Retrieval sensitivity
their sources of funding can be found on the TCCON website (https://tccon-wiki.caltech.edu/).
Edited by: P. Stammes
References
Butz, A., Hasekamp, O.P., Frankenberg, C., and Aben, I.: Retrievals of atmospheric CO2from simulated space-borne measurements of backscattered near-infrared sunlight: accounting for aerosol effects, Appl. Opt., 48, 3322–3336, 2009.
Butz, A., Guerlet, S., Hasekamp, O., Schepers, D., Galli, A., Aben, I., Frankenberg, C., Hartmann, J.-M., Tran, H., Kuze, A., Keppel-Aleks, G., Toon, G., Wunch, D., Wennberg, P., Deutscher, N., Griffith, D., Macatangay, R., Messerschmidt, J., Notholt, J., and Warneke, T.: Toward accurate CO2 and CH4 observations from GOSAT, Geophys. Res. Lett., 38, L14812, doi:10.1029/2011GL047888, 2011.
Chevallier, F., Br´eon, F.-M., and Rayner, P. J.: Contribution of the Orbiting Carbon Observatory to the estimation of CO2 sources and sinks: Theoretical study in a variational
data assimilation framework, J. Geophys. Res., 112, D09307, doi:10.1029/2006JD007375, 2007.
Chevallier, F., Maksyutov, S., Bousquet, P., Br´eon, F.-M., Saito, R., Yoshida, Y., and Yokota, T.: On the accuracy of the CO2surface fluxes to be estimated from the GOSAT observations, Geophys. Res. Lett., 36, L19807, doi:10.1029/2009GL040108, 2009. Cogan, A. J., Boesch, H., Parker, R. J., Feng, L., Palmer, P. I.,
Blavier, J.-F. L., Deutscher, N. M., Macatangay, R., Notholt, J., Roehl, C., Warneke, T., and Wunch, D.: Atmospheric carbon dioxide retrieved from the Greenhouse gases Observing SATel-lite (GOSAT): Comparison with ground-based TCCON obser-vations and GEOS-Chem model calculations, J. Geophys. Res., 117, D21301, doi:10.1029/2012JD018087, 2012.
Crisp, D., Fisher, B. M., O’Dell, C., Frankenberg, C., Basilio, R., B¨osch, H., Brown, L. R., Castano, R., Connor, B., Deutscher, N. M., Eldering, A., Griffith, D., Gunson, M., Kuze, A., Man-drake, L., McDuffie, J., Messerschmidt, J., Miller, C. E., Morino, I., Natraj, V., Notholt, J., O’Brien, D. M., Oyafuso, F., Polonsky, I., Robinson, J., Salawitch, R., Sherlock, V., Smyth, M., Suto, H., Taylor, T. E., Thompson, D. R., Wennberg, P. O., Wunch, D., and Yung, Y. L.: The ACOS CO2retrieval algorithm – Part II: Global
XCO2 data characterization, Atmos. Meas. Tech., 5, 687–707,
doi:10.5194/amt-5-687-2012, 2012.
Eguchi, N. and Yokota, T.: Investigation of clear-sky occurrence rate estimated from CALIOP and MODIS observations, Geo-phys. Res. Lett., 35, L23816, doi:10.1029/2008GL035897, 2008. Houweling, S., Hartmann, W., Aben, I., Schrijver, H., Skidmore, J., Roelofs, G.-J., and Breon, F.-M.: Evidence of systematic errors
Tans, P. P., Andrews, A. E., and Patra, P. K.: Validation of XCO2 derived from SWIR spectra of GOSAT TANSO-FTS with air-craft measurement data, Atmos. Chem. Phys. Discuss., 13, 3203– 3246, doi:10.5194/acpd-13-3203-2013, 2013.
Kurucz, R. L.: High resolution irradiance spectrum from 300 to 1000 nm, presented at the AFRL Transmission Meeting, 15–16 June 2005, Lexington, Mass., 2005.
Kuze, A., Suto, H., Nakajima, M., and Hamazaki, T.: Thermal and near infrared sensor for carbon observation Fourier-transform spectrometer on the Greenhouse Gases Observing Satellite for greenhouse gases monitoring, Appl. Optics, 48, 6716–6733, 2009.
Kuze, A., Suto, H., Shiomi, K., Urabe, T., Nakajima, M., Yoshida, J., Kawashima, T., Yamamoto, Y., Kataoka, F., and Buijs, H.: Level 1 algorithms for TANSO on GOSAT: processing and on-orbit calibrations, Atmos. Meas. Tech., 5, 2447–2467, doi:10.5194/amt-5-2447-2012, 2012.
Maksyutov, S., Takagi, H., Valsala, V. K., Saito, M., Oda, T., Saeki, T., Belikov, D. A., Saito, R., Ito, A., Yoshida, Y., Morino, I., Uchino, O., Andres, R. J., and Yokota, T.: Regional CO2flux
es-timates for 2009–2010 based on GOSAT and ground-based CO2
observations, Atmos. Chem. Phys. Discuss., 12, 29235–29288, doi:10.5194/acpd-12-29235-2012, 2012.
Mao, J. and Kawa, S. R.: Sensitivity studies for space-based mea-surement of atmospheric total column carbon dioxide by re-flected sunlight, Appl. Opt., 43, 914–927, 2004.
Morino, I., Uchino, O., Inoue, M., Yoshida, Y., Yokota, T., Wennberg, P. O., Toon, G. C., Wunch, D., Roehl, C. M., Notholt, J., Warneke, T., Messerschmidt, J., Griffith, D. W. T., Deutscher, N. M., Sherlock, V., Connor, B., Robinson, J., Sussmann, R., and Rettinger, M.: Preliminary validation of column-averaged vol-ume mixing ratios of carbon dioxide and methane retrieved from GOSAT short-wavelength infrared spectra, Atmos. Meas. Tech., 4, 1061–1076, doi:10.5194/amt-4-1061-2011, 2011.
O’Dell, C. W., Connor, B., B¨osch, H., O’Brien, D., Frankenberg, C., Castano, R., Christi, M., Eldering, D., Fisher, B., Gunson, M., McDuffie, J., Miller, C. E., Natraj, V., Oyafuso, F., Polonsky, I., Smyth, M., Taylor, T., Toon, G. C., Wennberg, P. O., and Wunch, D.: The ACOS CO2retrieval algorithm – Part 1: Description and
validation against synthetic observations, Atmos. Meas. Tech., 5, 99–121, doi:10.5194/amt-5-99-2012, 2012.
Oshchepkov, S., Bril, A., Maksyutov, S., and Yokota, T.: Detec-tion of optical path in spectroscopic space-based observaDetec-tions of greenhouse gases: Application to GOSAT data processing, J. Geophys. Res., 116, D14304, doi:10.1029/2010JD015352, 2011. Oshchepkov, S., Bril, A., Yokota, T., Morino, I., Yoshida, Y., Matsunaga, T., Belikov, D., Wunch, D., Wennberg, P., Toon, G., O’Dell, C., Butz, A., Guerlet, S., Cogan, A., Boesch, H., Eguchi, N., Deutscher, N., Griffith, D., Macatangay, R., Notholt, J., Sussmann, R., Rettinger, M., Sherlock, V., Robinson, J.,
Kyr¨o, E., Heikkinen, P., Feist, D.G., Nagahama, T., Kady-grov, N., Maksyutov, S., Uchino, O., and Watanabe, H.: Ef-fects of atmospheric light scattering on spectroscopic observa-tions of greenhouse gases from space: Validation of PPDF-based CO2 retrievals from GOSAT, J. Geophys. Res., 117, D12305,
doi:10.1029/2012JD017505, 2012.
Oshchepkov, S., Bril, A., Yokota, T., Wennberg, P.O., Deutscher, N.M., Wunch, D., Toon, G.C., Yoshida, Y., O’Dell, C.W., Crisp, D., Miller, C.E., Frankenberg, C., Butz, A., Aben, I., Guer-let, S., Hasekamp, O., Boesch, H., Cogan, A., Parker, R., Grif-fith, D., Macatangay, R., Notholt, J., Sussmann, R., Rettinger, M., Sherlock, V., Robinson, J., Kyr¨o, E., Heikkinen, P., Feist, D.G., Morino, I., Kadygrov, N., Belikov, D., Maksyutov, S., Matsunaga, T., Uchino, O., and Watanabe, H.: Effects of atmo-spheric light scattering on spectroscopic observations of green-house gases from space. Part 2: Algorithm intercomparison in the GOSAT data processing for CO2retrievals over TCCON sites, J.
Geophys. Res., 118, 1493–1512, doi:10.1002/jgrd.50146, 2013. Palmer, P. I., Feng, L., and B¨osch, H.: Spatial resolution of tropical
terrestrial CO2 fluxes inferred using space-borne column CO2
sampled in different earth orbits: the role of spatial error corre-lations, Atmos. Meas. Tech., 4, 1995–2006, doi:10.5194/amt-4-1995-2011, 2011.
Parker, R., Boesch, H., Cogan, A., Fraser, A., Feng, L., Palmer, P.I., Messerschmidt, J. Deutscher, N., Griffith, D. W. T., Notholt, J., Wennberg, P. O., and Wunch, D.: Methane observations from the Greenhouse Gases Observing SATellite: Comparison to ground-based TCCON data and model calculations, Geophys. Res. Lett., 38, L15807, doi:10.1029/2011GL047871, 2011.
Rayner, P. J. and O’Brien, D. M.: The utility of remotely sensed CO2concentration data in surface source inversions, Geophys.
Res. Lett., 28, 175–178, 2001.
Reuter, M., Buchwitz, M., Schneising, O., Heymann, J., Bovens-mann, H., and Burrows, J. P.: A method for improved SCIA-MACHY CO2retrieval in the presence of optically thin clouds, Atmos. Meas. Tech., 3, 209–232, doi:10.5194/amt-3-209-2010, 2010.
Rodgers, C. D.: Inverse Methods for Atmospheric Sounding: The-ory and Practice, World Sci., Singapore, 2000.
Saeki, T., Saito, R., Belikov, D., and Maksyutov, S.: Global high-resolution simulations of CO2and CH4using a NIES transport
model to produce a priori concentrations for use in satellite data retrievals, Geosci. Model Dev., 6, 81–100, doi:10.5194/gmd-6-81-2013, 2013.
Schepers, D., Guerlet, S., Butz, A., Landgraf, J., Frankenberg, C., Hasekamp, O., Blavier, J.-F., Deutscher, N.M., Griffith, D.W.T., Hase, F., Kyro, E., Morino, I., Sherlock, V., Sussmann, R., and Aben, I.: Methane retrievals from Greenhouse Gases Observ-ing Satellite (GOSAT) shortwave infrared measurements: Perfor-mance comparison of proxy and physics retrieval algorithms, J. Geophys. Res., 117, D10307, doi:10.1029/2012JD017549, 2012. Suto, H., Kuze, A., Shiomi, K., and Nakajima, M.: Updated Level-1 processing after two-years operation of TANSO-FTS, Proc. SPIE, 8154, 81541A, doi:10.1117/12.893405, 2011.
Takagi, H., Saeki, T., Oda, T., Saito, M., Valsala, V., Belikov, D., Saito, R., Yoshida, Y., Morino, I., Uchino, O., Andres, R.J., Yokota, T., and Maksyutov, S.: On the Benefit of GOSAT Ob-servations to the Estimation of Regional CO2Fluxes, SOLA, 7,
161–164, doi:10.2151/sola.2011-041, 2011.
Takemura, T., Okamoto, H., Maruyama, Y., Numaguti, A., Hig-urashi, A., and Nakajima, T.: Global three-dimensional simula-tion of aerosols optical thickness distribusimula-tion of various origins, J. Geophys. Res., 105, 17853–17873, 2000.
Takemura, T., Egashira, M., Matsuzawa, K., Ichijo, H., O’ishi, R., and Abe-Ouchi, A.: A simulation of the global distribution and radiative forcing of soil dust aerosols at the Last Glacial Max-imum, Atmos. Chem. Phys., 9, 3061–3073, doi:10.5194/acp-9-3061-2009, 2009.
Uchino, O., Kikuchi, N., Sakai, T., Morino, I., Yoshida, Y., Na-gai, T., Shimizu, A., Shibata, T., Yamazaki, A., Uchiyama, A., Kikuchi, N., Oshchepkov, S., Bril, A., and Yokota, T.: Influence of aerosols and thin cirrus clouds on the GOSAT-observed CO2:
a case study over Tsukuba, Atmos. Chem. Phys., 12, 3393–3404, doi:10.5194/acp-12-3393-2012, 2012.
Wunch, D., Toon, G. C., Blavier, J.-F. L., Washenfelder, R. A., Notholt, J., Connor, B. J., Griffith, D. W. T., Sherlock, V., and Wennberg, P. O.: The Total Carbon Column Observing Network (TCCON), Philos. T. Roy. Soc. A., 369, 2087–2112, doi:10.1098/rsta.2010.0240, 2011a.
Wunch, D., Wennberg, P. O., Toon, G. C., Connor, B. J., Fisher, B., Osterman, G. B., Frankenberg, C., Mandrake, L., O’Dell, C., Ahonen, P., Biraud, S. C., Castano, R., Cressie, N., Crisp, D., Deutscher, N. M., Eldering, A., Fisher, M. L., Griffith, D. W. T., Gunson, M., Heikkinen, P., Keppel-Aleks, G., Kyr¨o, E., Lindenmaier, R., Macatangay, R., Mendonca, J., Messerschmidt, J., Miller, C. E., Morino, I., Notholt, J., Oyafuso, F. A., Ret-tinger, M., Robinson, J., Roehl, C. M., Salawitch, R. J., Sher-lock, V., Strong, K., Sussmann, R., Tanaka, T., Thompson, D. R., Uchino, O., Warneke, T., and Wofsy, S. C.: A method for eval-uating bias in global measurements of CO2total columns from
space, Atmos. Chem. Phys., 11, 12317–12337, doi:10.5194/acp-11-12317-2011, 2011b.
Yokota, T., Oguma, H., Morino, I., and Inoue, G.: A nadir looking SWIR FTS to monitor CO2column density for Japanese GOSAT
project, Proc. Twenty-fourth Int. Sympo. on Space Technol. and Sci. (Selected Papers), JSASS and Organizing Comm. of the 24th ISTS, 887–889, 2004.
Yoshida, Y., Ota, Y., Eguchi, N., Kikuchi, N., Nobuta, K., Tran, H., Morino, I., and Yokota, T.: Retrieval algorithm for CO2and CH4
column abundances from short-wavelength infrared spectral ob-servations by the Greenhouse gases observing satellite, Atmos. Meas. Tech., 4, 717–734, doi:10.5194/amt-4-717-2011, 2011. Yoshida, Y., Kikuchi, N., and Yokota, T.: On-orbit radiometric
cal-ibration of SWIR bands of TANSO-FTS onboard GOSAT, At-mos. Meas. Tech., 5, 2515–2523, doi:10.5194/amt-5-2515-2012, 2012.