AN MHD AVALANCHE IN A MULTI-THREADED CORONAL LOOP
A. W. Hood1, P. J. Cargill1,2, P. K. Browning3, and K. V. Tam1,4
1
School of Mathematics and Statistics, University of St Andrews, St Andrews, Fife, KY16 9SS, UK;[email protected]
2
Space & Atmospheric Physics Group, The Blackett Laboratory, Imperial College London, Prince Consort Road, London, SW7 2AZ, UK 3
School of Physics and Astronomy, University of Manchester, Oxford Road, Manchester, M13 9PL, UK 4
Space Science Institute, Macau University of Science and Technology, Avenida Wai Long, Taipa, Macau, China Received 2015 June 11; accepted 2015 November 30; published 2016 January 18
ABSTRACT
For the first time, we demonstrate how an MHD avalanche might occur in a multithreaded coronal loop. Considering 23 non-potential magnetic threads within a loop, we use 3D MHD simulations to show that only one thread needs to be unstable in order to start an avalanche even when the others are below marginal stability. This has significant implications for coronal heating in that it provides for energy dissipation with a trigger mechanism. The instability of the unstable thread follows the evolution determined in many earlier investigations. However, once one stable thread is disrupted, it coalesces with a neighboring thread and this process disrupts other nearby threads. Coalescence with these disrupted threads then occurs leading to the disruption of yet more threads as the avalanche develops. Magnetic energy is released in discrete bursts as the surrounding stable threads are disrupted. The volume integrated heating, as a function of time, shows short spikes suggesting that the temporal form of the heating is more like that ofnanoflaresthan of constant heating.
Key words:magnetohydrodynamics(MHD)–methods: numerical–Sun: activity–Sun: corona–Sun: magnetic
fields
1. INTRODUCTION
The physical mechanism responsible for energy release in the solar corona remains unknown, but must involve the rapid dissipation of magnetic energy that is either stored in situ or injected as waves. In the former case, it is becoming widely accepted that the energy release does not occur at a single site
(e.g., a monolithic current sheet), but involves dissipation over a large volume, a consideration motivated originally by the particle acceleration requirements in solar flares. However, in view of the power-law distribution of event sizes over a broad range of energies, such considerations can also be assumed to apply to smaller events such as microflares and hypothesized nanoflares.
One example of such large-scale energy release of importance to this paper are the recent studies of the magnetohydrodynamic (MHD) kink instability (Browning et al.2008; Hood et al.2009; Bareford et al.2013)in a single twisted magnetic flux strand. Hood et al.(2009) showed that the magnetic energy is released as one extended“event,”which may correspond to a microflare or swarm of nanoflares. While the initial stages correspond to the fast release of energy when a helical current sheet forms, the sheet then fragments and the plasma appears turbulent with many small current sheets forming throughout the loop cross section. These sheets also release their energy as the magnetic field relaxes toward the
final lowest energy(Taylor)state with a constant alpha force-freefield. Temperatures up to around 107K result from Ohmic and viscous heating(Tam2014). The importance of this result is that it provides a triggering mechanism for the release of magnetic energy. Prior to the onset of the ideal MHD instability, the magnetic field is in a stressed but stable configuration. Current sheet formation occurs during the nonlinear development.
During the relaxation process, the loop expands in the radial direction until it is approximately 1.5 times its original value. Hence, we expect that an unstable loop could influence any
nearby neighbors if they are within this new expanded radius. Tam et al. (2015) investigated the conditions under which a nearby stable loop could be disrupted by an unstable loop. They showed that the disruption could occur when the second loop was sufficiently close. The addition of other closely spaced loops sets up the intriguing possibility of initiating an MHD avalanche.
Lu & Hamilton (1991) proposed that the solar coronal magneticfield is in a state of self organized criticality(SOC), analogous to a sandpile onto which sand is being slowly poured, which naturally produces a power-law distribution for the dependence of solar flare magnitude on occurrence frequency. In the SOC paradigm, a local instability at a site occurs if a critical parameter value is exceeded: the subsequent reconfiguration releases some energy and also affects neighbor-ing sites, possibly causneighbor-ing critical conditions to arise there, with an avalanche resulting as the disturbance spreads out. In the standard approach, the system is subject to random external driving during the intervals between avalanches, with SOC being reached when a statistical balance between external energy input and the dissipation is achieved. Models are based on simple rules to determine when instability is reached and how thefield subsequently reconfigures, usually with a cellular automaton(CA)approach.
This approach to modeling solar flares, and solar coronal heating through nanoflares, has been developed extensively
ensemble of semi-circular field lines, giving a discrete model not using a rectangular lattice. Morales & Charbonneau(2008, 2009) present a CA approach based on magnetic field lines rather than magnetic field values on a grid, guaranteeing a divergence-free magneticfield. Strugarek et al.(2014)develop avalanche models with deterministic driving representing the slow twisting of a loop, with the stochasticity required for SOC introduced through the criticality or relaxation algorithms. A CA model in which the instability criterion is inspired by kink instability of twisted loops has recently been proposed by Mendoza et al.(2014); however, this model does not consider the reconnection between neighboring loops, which is predicted by our model.
SOC models have the advantage of being simple, with readily understandable physical principles and the capability of modeling large volumes and time periods efficiently. They generally predict power-law distributions of event sizes, consistent with observations of solar flares. However, the assumed rules for instability onset and relaxation are not derived directly from the underlying MHD equations. For example, it is difficult directly to relate the relaxed state in CA models to the predictions of MHD models (Taylor 1974; Yeates & Hornig2014).
In this paper, we predict an avalanche-type energy release using an ab initio MHD approach. It is not our aim to incorporate ongoing driving, which would be computationally unfeasible at this time. We, thus, consider an initially stressed
field with only a single avalanche, in contrast to the discrete models discussed above, which are repeatedly driven through a sequence of avalanches toward the SOC state. While earlier MHD models are restricted to 2D and use the approximate equations of reduced MHD (Dmitruk et al.1998; Georgoulis et al.1998), we present fully 3D results that place no artificial restrictions on the evolution of the magneticfield.
To the present date, there has never been a demonstration of how an avalanche can arise from first principles using the full equations of 3D MHD. It is the purpose of this paper to demonstrate the proof of principle of an MHD avalanche. We build on the work of Tam et al.(2015)and investigate how a single coronal structure (e.g., a loop or part of an AR) that consists of 23 individual magnetic threads evolves in time when there is initially only one unstable thread surrounded by 22 non-potential but stable threads. The basic model is described in Section2and illustrated in Figure1. In Section3, we demonstrate that an avalanche involving the majority of the threads can arise on rapid timescales. Section 4 presents our conclusions.
2. INITIAL SETUP
We assume that the magneticfield in a coronal loop consists of a number of threads. In our case, we take 23 threads. Each thread is described below and is non-potential. However, only one thread is actually unstable to the ideal MHD kink instability. The other threads are well below the marginal stability threshold. Thus, we initiate the MHD avalanche through a kink instability in a single thread. This is equivalent to the ideas of CA that reconfigurefields once a local gradient
(or other quantity)exceeds a critical value.
We solve the resistive MHD equations using the Lagrangian Remap code, Lare3D, as described in Arber et al. (2001). Shock viscosities are used to treat shocks and the Ohmic and shock heating are added to the thermal energy equation
(Bareford & Hood2015). To keep the results simple, we ignore thermal conduction and optically thin radiation. The effects of these terms have been considered by Botha et al. (2011), Bareford et al.(2016), and Tam(2014). There are no additional ad hoc heating terms included, so that all the heating comes from the dissipation of energy in shocks and Ohmic dissipation. To avoid any additional diffusion of the background current, the resistivity is zero and is only switched on if the magnitude of the current density exceeds a threshold value. This is discussed in, for example, Hood et al. (2009), where the non-dimensionalization is also described. We select a length scale of a0=1Mm, based on the radius of each thread, a field
strength of B0=10 Gauss and a density of
1.67 10
0
12
r = ´ - kg m−3
that corresponds to a number density of 1015m−3. The reference time is 1.45 s, based on the Alfvén travel time across a thread.
The number of grid points is limited by the computational resources available and we used 480 points in both directions of the loop cross section and 960 along the loop length. The boundaries are located at x= 5,y= 5, andz= 10. All boundaries are taken as line-tied so that there are no velocities on any of the boundaries.
[image:2.612.323.566.51.332.2]The single loop analysis has shown how the instability depends on numerical resolution and boundary conditions. Tam et al.(2015)showed that insufficient resolution results in some numerical diffusion of the current and an unstable loop is destabilized without any initial disturbance. In our case, each thread has approximately 100 grid points across its diameter and this is sufficient to reduce the influence of numerical diffusion. The side boundaries and the location of the loop footpoints tend to stabilize the kink instability if the sides are
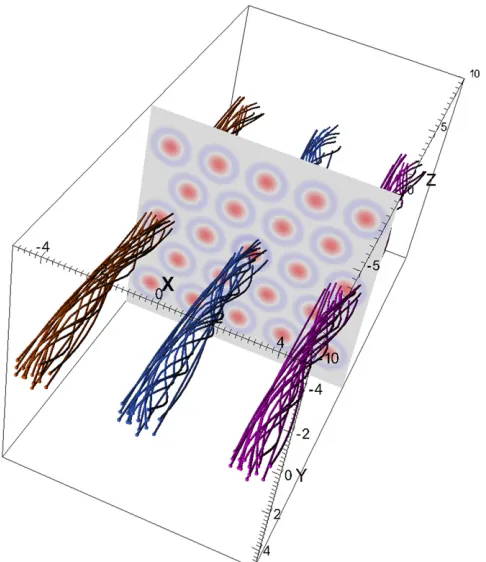
Figure 1. Twenty-three threads are used in the avalanche simulation. The twistedfield lines outline just three of the threads. The contours of the axial current density are shown in the midplane. The gaps between the threads are
too close to the loop and the loop length is too short. However, what is clear is that any instability in these stabilizing circumstances means that there will be an instability when the boundary conditions are relaxed.
2.1. Initial Equilibria
Consider the coronal situation, where the ratio of the gas pressure to the magnetic pressure is so small(around 10−3), so that the magneticfield can be assumed to be force-free. Hence,
B aB
´ = . For simplicity of modeling, we assume that each equilibrium magnetic thread can be modeled by a straight twisted cylinder, with the cylinder axis of theith thread located at(x yi, i), and we use the smoothαprofile that only depends on radius, r, as described by Hood et al.(2009). Therefore, each magnetic thread is non-potential but has zero net axial current, corresponding to localized twisting. For a radial coordinate defined byr2=(x-xi)2 +(y-yi)2, where the location of the axis of the thread is(x yi, i), the magneticfield components of the ith thread, forr1, has the form
Bq=Bilir(1-r2 3) , ( )1
B B 1 r r r
7 7 1 1 , 2
z i i i i
2 2
2 7 2 2 2 6
( ) ( ) ( )
l l
l
= - + - -
-r r
B
2 1 1 4
, i
z
2 2 2
( ) ( )
a= l -
-and, forr>1,
Bq=0, ( )3
Bz=Bi 1-li2 7, ( )4
0. a=
Biis the magneticfield strength onr=0 of theith thread and
i
l is a constant parameter related to the twist in the magnetic
field. Thus, the space between the threads isfilled with an axial
(untwisted) field; note that fields are continuous everywhere, and in force balance. The maximum value ofliis restricted by the fact thatBz2must be positive and, therefore,li<2.438.li controls the stability properties of the thread and the marginal stability value, lcrit, does depend on the length, 2Lz, of the thread. For our case,2Lz=20andlcrit=1.586. The stability
threshold for longer threads will be given by smaller values of
i
l (Bareford et al.2010). If the system can create an avalanche with short threads, there will definitely be an avalanche for longer, less stable threads.lialso controls the maximum value of the magnitude of the initial current, i.e.,2liBi. Note thatliis positive in each thread so that they all have the same sense of rotation.
The critical current used in switching on the anomalous resistivity is always chosen to be larger than the maximum value. The axial flux within a thread is of the form
B f
2p i ( )li
F = , where f( )l is a monotonically decreasing function ofλ. Thus, the magnitude of the magneticfield on the axis of each thread is Bi and this is proportional to the axial
magneticflux in the thread. Note that the values ofliandBiare
related for the different threads. From Equation (4), a smaller value oflirequires a smaller value ofBiso that all threads are
embedded in the same uniform potential field.
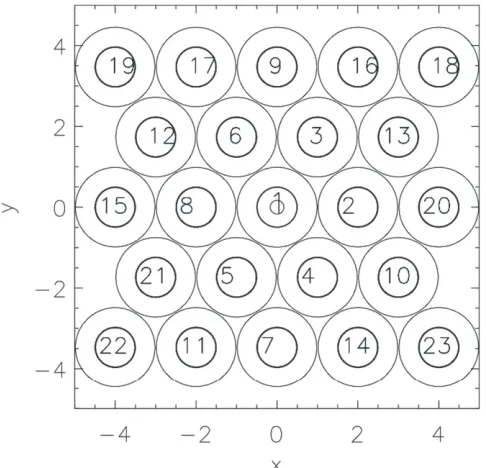
The initial array of magnetic threads is shown in Figure 2. This has a similar but superficial appearance to the lattice used
by Charbonneau et al.(2001), where each node was assigned a valueBkas a measure of the magnetic energy. However, it is
important to remember that in this paper the magneticfield is continuous and that a small sample of contours for the axial current density is chosen to aid in the identification of each thread in Figure2. Contours of the axial current are shown at the midplane z=0. The individual threads are numbered by the order in which they are disrupted. The unstable thread is labelled as “1” and has l1=1.8>lcrit. All the remaining
threads have the same value ofli given byli=1.4<lcrit.
Thus, all the stable threads have aλvalue that is significantly below the marginal value oflcrit»1.6. In order to emphasize that this simulation is using a continuous magnetic field, the initial axialfield,Bz, and the initialBycomponent are shown in
Figure3as functions ofx, at the midplane,z=0, and aty=0. Five threads in this cut are clearly visible and the larger values ofBzand Byindicate the unstable thread.
Since the radial profile ofα has both positive and negative values, the total magnetic helicity in the equilibriumfield will be relatively small. In this case, the Taylor relaxed state will be weakly twisted and close a potential field. Hence, in the midplanez=0, the magneticfields will eventually evolve to a nearly uniformfield in the axial direction.BxandByare small
and will only be significantly larger near the photospheric boundaries,z= Lz.
3. RESULTS
To initiate the simulation, a small velocity disturbance is applied to the unstable thread, as discussed in Tam et al.
[image:3.612.323.566.51.285.2](2015). Note that if this disturbance is applied to a stable thread nothing happens. Hence, all except one thread are stable to small disturbances. Remember that the magnetic field varies continuously across each thread and that each thread is surrounded by a potential field with a constant axial field component.
3.1. Axial Current Density
To illustrate the development of an MHD avalanche, we show results in the cross section at the midplane, z=0. Contours of the axial current, jz, give a clear indication of
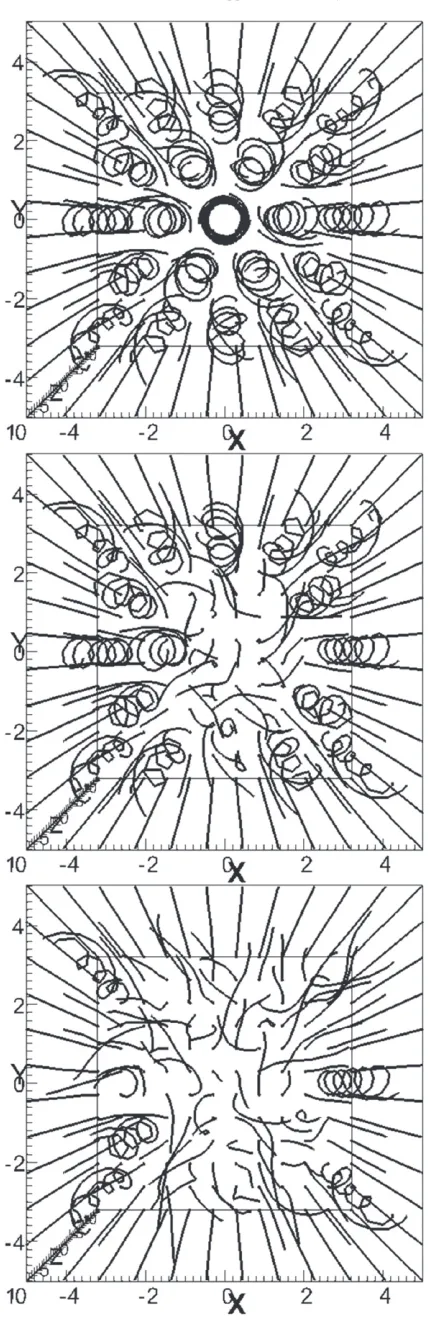
current sheet formation, break up and relaxation. The simulation runs to afinal time of t=800. During this period, there are nine distinct interaction stages that lead to the MHD avalanche. These are shown in Figures4and5. Figure4shows contours of jz at three early times and covers stage 1 (linear
[image:4.612.327.563.46.682.2]phase, top), stage 1(nonlinear phase, middle), and stage 2(first interaction). The top panel is during the initial kink instability of loop 1 at time t=75. Thefirst current sheet is clearly seen in loop 1. The middle panel is at time t=150. The current sheet in the unstable loop has fragmented and small current sheets are forming throughout the volume of loop 1. This is during the first stage of the avalanche, as the single unstable thread is evolving. The fragmented currents are reminiscent of a turbulent system, with a range of scales all the way down to dissipation. In addition, thread 1 has expanded and is now interacting with the neighboring threads, numbered 2, 3, 4, 5, 6, and 8 as indicated in Figure2. However, thefirst stable loop to be disrupted is thread 2, as can be seen in the bottom panel in Figure 4 and this is the start of stage 2. Because of the
Figure 3.Initial(a)axialfield,Bz, and(b)transversefield,By, at the midplane
(z=0)and aty=0 as a function ofx.
[image:4.612.52.293.53.435.2]fragmented current sheet development of thread 1, it is not clear why it should be thread 2 that is disruptedfirst, though this loop is closest to the initial midplane current sheet in thread 1(see top panel of Figure2). Note that as thread 2 begins to coalesce with thread 1, it interacts strongly with threads 3 and 4, forming current sheets between them. At the midplane, thejzcontours
are still remarkably symmetric, despite the kink instability breaking symmetry and the turbulent nature of the plasma.
Interactions then start to happen more frequently, as shown in Figure5. The top panel showsjzcontours at timet=200. This
is stage 3 and threads 3 and 4 have been pulled into the middle and there is evidence of current sheets forming at threads 5 and 6. The symmetry in the interactions is no longer seen at time
t=290 (middle panel) and thread 5 is already beginning to disrupt before thread 6 in stage 4. The following stages are noted. In stage 5, thread 7 is disrupted, essentially on its own. Stage 6 involves threads 8, 9, and 10(in that order). Stage 7 sees the disruption of threads 11–14. Stage 8 covers the disruption of threads 15 and 16 and thefinal stage in this simulation(bottom panel)involves the disruption of threads 17 and 18.
There may be a few more interactions after the end of the simulation but it is also possible that the avalanche ends with a few threads still remaining unaffected. In this simulation, those unaltered are threads 19–23.
3.2. Magnetic Field Lines
Figure6shows a sample of the magneticfield lines for three times: namely the initial state, the partially relaxed state at
t=400, and the state at the end of our simulation (t=800). The individual twisted threads are clearly seen in the topfigure and as the threads are disrupted the twist is reduced, leaving only weakly twistedfield lines at the end. The system has not yet fully relaxed, as there are 5 threads that are still twisted and in their initial state.
3.3. Heating
As one would expect, the magnetic energy is reduced at each of the stages when a thread is disrupted. The volume integrated magnetic energy, minus its initial value, is shown as a function of time in Figure7. There is no reduction in magnetic energy until the kink instability develops around t=75. Then, there are several times when the gradient is steep and then followed by a shallower gradient. These periods of rapid decrease in magnetic energy correspond to the various loops being disrupted.
The maximum free magnetic energy of each thread depends on the value of the twist parameter,λ, and this can be estimated as its initial energy minus the potentialfield with the same axial
[image:5.612.55.288.46.683.2]flux. Strictly speaking the radius of the relaxed thread will be larger than the original thread, but we ignore this small effect. For the unstable thread,l=1.8and the free volume integrated magnetic energy is 1.8. From Figure 7, the magnetic energy released is approximately 1.3 betweent=75 andt=145. Not all the available energy is released in this time partly because the relaxed state is not a potentialfield and partly because the relaxation process takes longer to reach its final equilibrium. Stage 2 is triggered before this can happen. For the stable threads the volume integrated magnetic energy available is 0.8 and during stage 2, the magnetic energy of the thread is reduced by 0.6. Again not all the energy is released. Similar
amounts of energy are released during the other stages. For example, stage 7 lasts between t=490 andt=600 and the magnetic energy is reduced by 2.8 units. There are 4 threads disrupted during this period so that around 0.7 units of magnetic energy is released per thread.
The time derivative of the volume integrated magnetic energy is related to the Ohmic heating. However, it is better to calculate the volume integrated heating due to both Ohmic and viscous heating, where the viscous heating is due to shock heating, which has proven to be a very important effect
(Bareford & Hood 2015). The volume integrated heating function,H(t), is plotted in Figure8as a function of time. This is the form of heating function that should be used in the single
field line modeling of coronal loops. From thisfigure, the nine different stages can be identified. Stage 1 starts aroundt=75. The start times of each of the stages can be estimated from the
jzcontours. The start of a stage is determined by the time that
the first thread in a group starts to move. The start times are plotted as vertical dashed lines in Figure 8. They are always just when the heating function starts to rise rapidly.
[image:6.612.61.276.43.703.2]The heating function is clearly not uniform but instead consists of bursts of heating with the amplitude of the burst depending on the number of threads that are disrupted around
Figure 6.Magneticfield lines shown for times 0(top), 400(middle), and 800 (bottom)showing the initial state, halfway through the simulation and the
final time.
[image:6.612.323.565.50.214.2]Figure 7.Change in the volume integrated magnetic energy as a function of time. Each rapid change in energy corresponds to a significant release of magnetic energy. The dashed vertical lines indicate the start of the different stages, as determined from thejzcontour plots.
[image:6.612.324.566.269.429.2]the same time. In addition, the length of time of the burst of heating also depends on the number of threads involved.
Note that there is a low background level of Ohmic heating during the simulation, after the onset of the initial instability.
4. CONCLUSIONS
Using a fully 3D MHD simulation, we have demonstrated for thefirst time how a local instability in the coronal magnetic
field can trigger large-scale energy release through an avalanche. This involves an initial instability in one magnetic thread, the nonlinear phase of which leads to magnetic reconnection with neighboring stable threads. The process is repeated until most of the stable threads have been engulfed, leading to a large, highly structured, weakly twistedflux rope. Each disruption results in significant release of magnetic energy and, in our simulation, approximately three-quarters of the maximum magnetic energy is released in each thread. This results in a series of heating events, whose height and width depend on the number of threads disrupted at each stage. The
final state shows some aspects that may be ascribed to a turbulent or chaotic system, such as a large hierarchy of scales in thefinal current profiles.
The demonstration here does not yet address many of the aspects present in the Self Organized Criticality or SOC-type models discussed in the Introduction, such as power-law distributions of energy release as well as the lack of continual driving. In part that is a computational issue(see below), but it is important to note the need for avalanches to have varying degrees of efficiency. In the present simulation, that requires the termination of the avalanche before it can engulf all the threads. Two aspects are likely to be important. One is the separation between the threads but this may not be a major issue if all the threads come from discrete photospheric magnetic sources. If there is no normal magneticfield between the photospheric sources, then the field will automatically expand until it touches its neighboringfields. The second issue is whether the introduction of threads with opposite twist can “block” the spread of the avalanche. Preliminary simulations suggest that this can indeed happen, and this will be presented fully in the future.
While SOC/CA models have been very useful in under-standing coronal phenomenon, there are always concerns about whether their “rules” are consistent with the equations of MHD. A meaningful examination of avalanches in MHD has been precluded in the past by the large computer resources required. Even now, it will be a major challenge to simulate, in proper 3D MHD, the statistical balance between driving and avalanches that are central to SOC models.
A.W.H. would like to thank KU Leuven for the kind hospitality where this work was completed. A.W.H., P.J.C.,
and P.K.B. are three of Eric Priest’s earliest research students and it is a pleasure to acknowledge his contribution to the development of their research careers. We acknowledge the
financial support of STFC through the Consolidated grants to the University of St Andrews and the University of Manchester. This work used the DIRAC 1, UKMHD Consortium machine at the University of St. Andrews and the DiRAC Data Centric system at Durham University, operated by the Institute for Computational Cosmology on behalf of the STFC DiRAC HPC Facility (www.dirac.ac.uk). This equipment was funded by a BIS National E-infrastructure capital grant ST/K00042X/1, STFC capital grant ST/ K00087X/1, DiRAC Operations grant ST/K003267/1 and
Durham University. DiRAC is part of the National
E-Infrastructure.
REFERENCES
Arber, T. D., Longbottom, A. W., Gerrard, C. L., & Milne, A. M. 2001,JCoPh,
171, 151
Aschwanden, M. J., Crosby, N. B., Dimitropoulou, M., et al. 2014, SSRv, 198, 47
Bareford, M. R., Browning, P. K., & van der Linden, R. A. M. 2010,A&A,
521, A70
Bareford, M. R., Gordovskky, M., Browning, P. K., & Hood, A. W. 2016, SoPh, 291, 187
Bareford, M. R., Hood, A. W., & Browning, P. K. 2013,A&A,550, A40
Bareford, P. K., & Hood, A. W. 2015,RSPTA,373, 20140266
Botha, G. J. J., Arber, T. D., & Hood, A. W. 2011,A&A,525, A96
Browning, P. K., Gerrard, C., Hood, A. W., Kevis, R., & van der Linden, R. A. M. 2008,A&A,485, 837
Charbonneau, P., McIntosh, S. W., Liu, H.-L., & Bogdan, T. J. 2001,SoPh,
203, 321
Dmitruk, P., Gómez, D. O., & DeLuca, E. E. 1998,ApJ,505, 974
Georgoulis, M. K., Velli, M., & Einaudi, G. 1998,ApJ,497, 957
Hood, A. W., Browning, P. K., & van der Linden, R. A. M. 2009,A&A,
506, 913
Hughes, D., Paczuski, M., Dendy, R. O., Helander, P., & McClements, K. G. 2003,PhRvL,90, 131101
López Fuentes, M., & Klimchuk, J. A. 2010,ApJ,719, 591
López Fuentes, M., & Klimchuk, J. A. 2015,ApJ,799, 128
Lu, E. T., Hamilton, E. T., McTiernan, J. M., & Bromund, K. R. 1993,ApJ,
412, 841
Lu, E. T., & Hamilton, R. J. 1991,ApJL,380, L89
Mendoza, M., Kaydul, A., de Arcangelis, L., Andrade, J. S., Jr., & Herrmann, H. J. 2014,NatCo,5, 5035
Morales, L., & Charbonneau, P. 2008,ApJ,682, 654
Morales, L., & Charbonneau, P. 2009,ApJ,698, 1893
Parker, E. N. 1988,ApJ,330, 474
Strugarek, A., Charbonneau, P., Joseph, R., & Pirot, D. 2014,SoPh,289, 2993
Tam, K. V. 2014, PhD thesis, St Andrews Univ., http://hdl.handle.net/ 10023/6373
Tam, K. V., Hood, A. W., Browning, P. K., & Cargill, P. J. 2015,A&A,
580, A122
Taylor, J. B. 1974,PhRvL,33, 1139
Vlahos, L., & Georgoulis, M. K. 2004,ApJL,603, L61