Molten Metal Flow through Solid Network in Semi-Solid Al–Si Alloy
Nakornriab Nicom
*1and Hiroyuki Nomura
*2Department of Materials, Physics and Energy Engineering, Graduate School of Engineering, Nagoya University, Nagoya 464-8603, Japan
Based on Darcy’s equation, permeability was measured for the flow of molten metal through solid network in order to evaluate slurry fluidity in semi-solid casting process. An experimental apparatus is constructed to control the morphology of globular and dendrite structure for varied fraction of solid and applied pressure. Semi-solid AC4CH alloys with 7 mass% silicon content have been squeezed by argon gas at pressure of 0.50 MPa to force liquid phase through a filter. The fraction of solid is varied from 0 to as high as 0.55. Filtrate weight ratio and gauge pressure are shown to reach to each constant value with pressurizing time of 20 s. At low fraction of solid, permeability depends strongly upon solid morphology,i.e.dendrite structure yields the lower permeability due to large friction factor. Liquid movement throughsolid phase network prevails under the formation of cake layer on the filter surface with most fractions of solid and with the fraction more than 0.33 for the dendritic and globular structure of the slurry, respectively. For the globular structure, on the other hand, liquid motion in the filter becomes important for fraction of solid less than 0.33.
(Received December 16, 2004; Accepted May 10, 2005; Published August 15, 2005)
Keywords: permeability, dendritic structure, globular structure, semi-solid, cake filtration, depth filtration
1. Introduction
Interdendritic fluid flow during solidification has been investigated since thirty years ago. Apelianet al.1)measured specific permeability using Darcy’s equation for a molten aluminum through porous media. They indicated that a flow through the porous dendritic networks obeyed Darcy’s law, and the equations were derived from the capillaric flow model for the liquid volume fraction less than 0.35. Takahashiet al.2)made an artificial hole in the solid–liquid coexisting zone in order to measure fluidity of the interden-dritic liquid as an effective permeability. The results on Al– 2.4 mass% Si alloys indicated that the permeability depends on the dendrite morphology. Poirier and Ganesan3) used a permeameter for Al–Cu alloys. They treated the mushy zone as a porous medium, in which the interdendritic liquid moves in the solid network, and found out that permeability of globular structures was approximately one order of magni-tude greater than that for dendritic-globular structures. Poirer and Ocansey4)selected Pb–Sn alloys for permeability test. They found out that there was reasonable agreement among the permeability for dendrite, dendrite-globular, and globular microstructure, nevertheless some solid flowed with liquid in their experiment. Acostaet al.5)developed the mathematical model to represent the fluid flow in a ceramic foam filter used for the molten metal filtration. The results indicated that the specific permeability was strongly dependent on the pore size distribution. Nielsen et al.6) used Kozeny–Carman’s equa-tion7)in order to measure the mushy zone permeability for Al–Cu alloys with the globular microstructure. But the result was considerably scattered due to the coarsening of the microstructure during the experiments, which made it difficult to evaluate specific surface area of solid, related to permeability. Moreover, the microstructure evolution was uncertain.
Most of literature reviews8–11) are on the experimental
design still leading to simultaneous solid–liquid movement. From these studies, permeability of liquid through solid network is not estimated reasonably. Hence, in this work, molten metal flow through the solid network were inves-tigated using a filtration system. In particular, liquid move-ment both in dendritic network and globular solid structure is discussed in the present study. This is a basic research giving the data base on liquid fluidity for semi-solid processing and solidification of aluminum alloys in the final stage.
2. Experimental Design and Procedure
2.1 Experimental design
[image:1.595.305.551.335.363.2]Table 1 shows the chemical composition of experimental material: AC4CH with 7 mass% silicon. The experimental apparatuses, which were used to measure the flow of liquid for Al–Si alloys are shown in Fig. 1. Melting unit is composed of stainless steel crucibles, a removable tundish, a ceramic foam filter for passing metal and a reservoir for the dropped metal. Stainless steel crucible consists of two parts. One is the internal crucible with 35 mm in inside diameter and 45 mm in outside diameter to hold the molten sample during experiment. The other is the external crucible of 85 mm in outside diameter with the shutter and filter at the bottom. Since the atmosphere in the tundish is controlled, the oxide films and dross are easily removed, and solid particle sizes are expected to become fine during flowing throughout the nozzle. Metal pouring temperature of 903 K was measured directly in the molten metal within resistance furnace. Figure 1(b) shows the apparatus at pressurization stage. The tundish was removed and crucible lid is placed instead of the tundish. The sample and the stainless crucible were lifted up to get stable temperature. The variation of solid morphology was investigated in two cases of dendrite and
Table 1 Chemical composition of AC4CH (mass%).
Si Mg Fe Ti Mn Zn Al
7.0 0.23 0.07 0.28 0.003 0.002 Bal.
*1Graduate student, Nagoya University
rounded structure at the fraction of solid varying in the range of 0 to 0.55 before the eutectic reaction. Three kinds of ceramic foam filters were used, in which pore number is 10, 20 and 30 PPI (pore per linear inch)12)and these correspond to the fraction of pore of 0.51, 0.45 and 0.43 (to the normal to flow direction), respectively. A filter with 35 mm in diameter and 22 mm in thickness is covered by the sheath to prevent the lateral metal flow.
2.2 Control of solid phase morphology
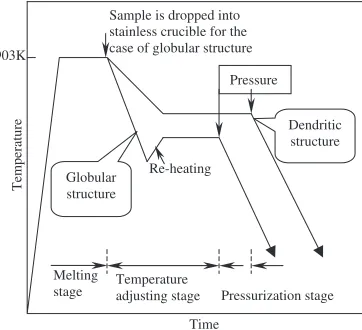
Figure 2 shows the heat profile and the relationship between a pressurization and a heating time for different solid phase morphologies of dendrite and globular phase. In the case of globular structure of slurry, the alloy AC4CH of about 80 g was melted in the tundish, and then dropped into the stainless crucible at 903 K via lifting up the stopper. The turbulent flow of the melt through the nozzle and the following solidification provided the globular structure in the semi-solid state. Then, the stainless crucibles were lifted up and the sample within the stainless crucible was reheated to
the test temperature (858, 869, 877, 883, 888 and 895 K) between liquidus (892 K) and solidus (850 K) under an argon atmosphere, and held isothermally for 1800 s. The measured temperature of slurry within crucible was converted to the fraction of solid using Scheil’s equation. After temperature leading to stable solid morphology was obtained in the slurry metal, the shutter was removed and argon gas of 0.50 MPa was applied from the top on the slurry for 60 s, causing the melt flow through the mushy zone and the filtration into reservoir. The pressurizing time is varied during 5 to 60 s with fraction of solid of 0.30 for the sample group for the study of pressurizing time dependence. Filtrated metal was weighed and permeability calculated using Darcy’s equation. Finally, the crucible and sample left on the filter were quenched to a room temperature by a tap water with cooling rate of 5.5 K/s.
In the case of the dendrite structure of slurry, the sample was maintained in the liquid state of 903 K. Then the sample within crucible was cooled to the test temperature (858, 869, 877, 883, 888 and 895 K) of the mushy zone with the rate of 5 K/s. Solidification without any vibration and turbulence yields a dendrite structure. The slurry is held on the isothermal temperature for 1800 s, although the coarsening phenomena may go on. Finally, the shutter is removed, the argon gas applied to the molten sample and the crucible quenched by the tap water.
Figure 3 shows the typical solid morphology of the slurry at the fraction of solid of 0.30 without the pressurization. The growth of a dendrite structure is seen with the secondary dendrite. For the globular structure, it appears that grain grows and aggregation of grains occur during the experiment.
2.3 Calculation of the permeability
The convection of interdendritic liquid in solidifying alloys is responsible for many types of macro-segregation, in which liquid flowability in solid network is estimated using Darcy’s law. Liquid flowability in solid network, i.e.
permeability is calculated by Darcy’s equation with meas-ured pressure as follows:13,14)
k¼Qx
AP ; ð1Þ
where k is permeability; Q, slurry flow rate; , viscosity (103Pas15) for molten aluminum); x, length of filter medium or slurry thickness;A, crucible cross section area and P, pressure difference. This equation was applied for both Thermocouple 1
(TC 1)
Resistance furnace
TC 2
TC 3
TC 4
SUS crucible
Shutter
Filter
Reservoir Tundish with
nozzle
Stopper
Molten metal
35 45 85
Pressure sensor
TC 1
Argon gas for pressurization
Resistance furnace
TC 2 TC 3
TC 4 Slurry metal
Reservoir (a)
Unit: mm (b)
Fig. 1 Schematic sketch of the experimental apparatus for (a) melting stage and (b) pressurization stage.
903K
Globular structure
Dendritic structure Pressure
Pressurization stage Melting
stage
Time
Temperature
Re-heating Sample is dropped into stainless crucible for the case of globular structure
Temperature adjusting stage
Fig. 2 The heating profile and the relationship between a pressurization and heating time.
300 µm
(a) (b)
[image:2.595.52.286.72.268.2] [image:2.595.79.260.591.756.2] [image:2.595.307.547.650.758.2]the filtration mechanism of a cake and a depth filtration as shown in Fig. 4. We call ‘‘cake filtration’’, where the collected primary phase form a coherent cake on the filter surface and the initial slurry thickness was regarded asxin eq. (1). In another way, the primaryparticles are entrapped inside the filter called ‘‘depth filtration’’. In this case, the cross section area, (A) is changed as described later in the paragraph 3.2. In the present study, flow through solid particles are a common phenomenon for both the cake and depth filtration, which can be treated by eq. (1) with only changing liquid flow area as written above. Usage of filter of 20 PPI and pore fraction of 0.45, for example, yields the effective area of4:35104m2. It is the basic idea for using this equation to semi-solid slurry filtration in the present study. As for the other values of parameter besidein eq. (1) is as follows; xis obtained by measuring the thickness of cake layer or the filter thickness as described later, A is obtained by calculating the cross section area of slurry metal with 35 mm in diameter, and Q is estimated from the increasing rate of filtrated metal weight.
3. Results and Discussion
3.1 Effect of pressurizing time on flow behavior
The experimental samples of the slurry were adjusted to the fraction of solid of 0.30. Each sample is squeezed by the argon gas pressure during 5 to 60 s. The filtrate weight ratio, namely the ratio of the weight of filtrated metal to the reservoir to that of initial slurry metal were obtained for the fraction of solid 0.3. The result is indicated in Fig. 5. The variation of the curves reflect two stages during the pressurization. At the initial stage, a gauge pressure and the filtrate weight ratio are dependent on time. The highest gauge pressure appeared at the beginning of pressurizing and then it decreased with increasing time until 20 s. This region corresponds to the increase of filtrate weight ratio curve, suggesting that a liquid in the slurry mixture flows down through filter in this time. But the next is constant stage, where the filtrate weight ratio and gauge pressure is maintained nearly at 70% and 0.082 MPa, respectively. Since the fraction of solid is set at 0.3, filtrate weight ratio about 70% indicates that the primarysolid particles in the slurry are entrapped by the filter.
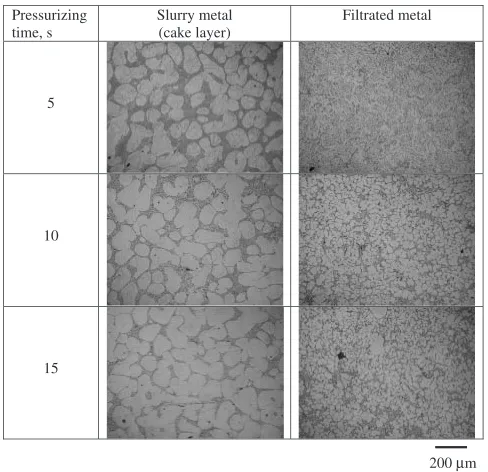
The microstructures of the central part of samples obtained by pressurization are shown in Fig. 6. In this case, no slurry
was left on the filter after pressuring times of 20 s, so that no pictures are presented for cake layer on the filter after 20 s. Microstructure of slurry metal shows decreasing of liquid portion (increasing of primary solid portion) with increasing time. Moreover, from the series of slurry metal micro-structure, primary particles coarsened during quenching. On the other hand, filtrated metal shows the finer grain structure with pressurizing time due to the rapid cooling rate in the reservoir.
3.2 Effect of solid phase morphology on permeability
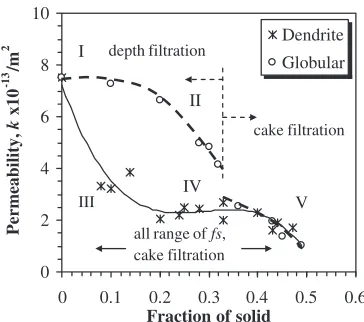
Figure 7 shows the calculated permeability using Darcy’s equation for slurry processing both the dendrite and globular structure (pressurizing for 60 s). The case of globular structure shows the depth filtration at low fraction of solid (0 to 0.33, which is schematically drawn as case (I) and (II) in Fig. 8) because isolated small solid particles were easily filtrated and not left on the filter. For this case, crucible cross section area, (A) in eq. (1) is replaced to the effective area, Slurry or
mushy zone
Filter
Filtrated metal Primary phase
Pore
(a) (b)
Fig. 4 Schematic sketch of filtration mechanism; (a) cake filtration and (b) depth filtration.
0 20 40 60 80 100
0 10 20 30 40 50 60
Pressurizing time, t /s
Filtrate weight ratio (%)
0.08 0.085 0.09 0.095 0.1
Gauge pressure,
∆
P
/MPa
fs 0.3
Fig. 5 Plot of the filtrate weight ratio and gauge pressure as a function of pressurizing time (fraction of solid: 0.3).
Pressurizing time, s
Slurry metal (cake layer)
Filtrated metal
5
10
15
200 µm
[image:3.595.335.517.74.213.2] [image:3.595.79.265.75.195.2] [image:3.595.305.549.266.502.2]("A) of the filter, and the thickness of filter, (x) is utilized. So the permeability of this case is obtained for the slurry movement in the filter pore. For the case of the fraction of solid more than 0.33 with the globular structure (case (V) in Fig. 8), solid particles aggregated on the filter and cake filtration prevails throughout the process. For this volume fraction, only melt in the slurry moves through the globular solid network. Thus,xwill be replaced from the length of filter medium to cake layer thickness,i.e.the slurry thickness in eq. (1), andAis used for the cross section area. Between (II) and (V) stages, there is much difference of flow resistance, producing permeability gap near the fraction of solid 0.33 in the Fig. 7. The permeability curve reflects two regions (depth and cake filtrations). For dendrite structure samples, the cake filtration is obtained at most cases of fractions of solid (in Fig. 8 case (III), (IV) and (V)). In these cases we can obtain permeability for liquid movement in the cake layer. Filtration condition of each stage, (I) to (V) shown
in Fig. 7 is illustrated schematically in Fig. 8: (I) globular structure atfs<0:10; thesolid particles in slurry metal are rather small in size, so most of slurry metal flows throughout the filter like liquid movement. (II) globular structure at fs from 0.10 to 0.33; the phase are coarsened partly in the slurry metal. Some of them are entrapped in the filter and then depth filtration is occurred during the pressurization. (III) dendrite structure at fs<0:12; the dendrites in the slurry metal are not so many and isolated. Due to their imperfect and very weak structure, they are easily broken off during pressurization. However, dendritic structure still aggregated on the filter due to interlocking of dendrite branches. (IV) dendrite structure at fs from 0.12 to 0.40; coarsening of dendrite structures become remarkable in the slurry metal, which promotes the formation of the cake layer on the filter. (V) high fraction of solid with the formation of the cake layer; the solid phases of both the dendritic and globular structure in the slurry metal contact closely with each other to form the cake layer like the pack bed. There are no solid phases captured in the filter and only liquid phase is allowed to flow through solid network.
At low fraction of solid, permeability depends strongly upon the solid phase morphology even though two types filtration are concerned as shown in Fig. 4 i.e. the lower permeability for dendrite structure due to large friction. Otherwise at high fraction of solid, permeability in the case of globular structure becomes the value almost equal to that of dendrite structure, because solid particles form the intertwined structure at high fraction of solid. In addition, we found that the fraction of solid for slurry metal with globular structure becomes higher value during the experiment. But the slurry metal with dendritic structure shows the skeleton-like without densification. This result is unique one different from the previous study,3)in the point that there is increase of solid particles with flowout of liquid during the present experiment. We presume that difference of experimental conditions produces difference of the permeability values between the present result and previous one.
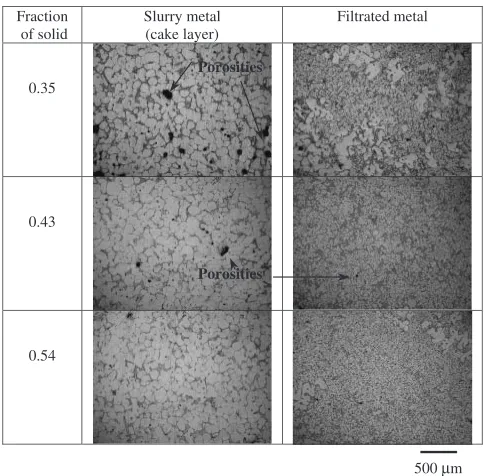
The microstructure of pressurized samples with globular structure is shown in Fig. 9. At low fraction of solid, porosities and coarsening particles are found out in slurry metal (cake layer) due to the high temperature. For the filtrated metal with fraction of solid 0.35, solid particles grow because of high temperature and low cooling rate. At high fraction of solid, the microstructure in slurry metal shows densification, however, filtrated metal shows the finer grain size.
The structures for the case of slurry with dendrite are shown in Fig. 10. For lower fraction of solid, a secondary and primary dendrite arm are observed to be collapsed, and no connection of each dendrite is found out. At high fraction of solid, on the other hand, no primary and secondary dendrite collapsed, and some dendrite arms are connected.
3.3 Effect of filter pore size on permeability
To clarify the effect of filter pore size on permeability, pore number of 10, 20 and 30 PPI are used for the slurry with globular structure. Permeability is related to the fraction of solid for every filter pore number in almost the same manner as shown in Fig. 11. In addition, most of pressurized samples 0
2 4 6 8 10
0 0.1 0.2 0.3 0.4 0.5 0.6
Fraction of solid
Permeability,
k
x10
-13
/m
2 Dendrite
Globular
cake filtration depth filtration
all range of fs, cake filtration I
II
III IV V
Fig. 7 Plot of the calculated permeability as a function of fraction of solid for dendrite and globular structure.
I V
III V
II
IV
Fig. 8 Initiate stage of sample for mushy zone with globular and dendrite structure (upper) flowing through filter (lower): (I) Globular structure at
fs<0:10, (II) Globular structure at fs from 0.1 to 0.33, (III) Dendrite
structure atfs<0:12, (IV) Dendrite structure atfsfrom 0.12 to 0.40 and
[image:4.595.77.259.72.233.2] [image:4.595.49.289.288.487.2]indicate formation of cake filtration with fraction of solid more than 0.33. It is evident that the solid particles for this case act as the network on each filter during pressurization. As in Fig. 7, here also permeability curves are discriminated in the two regions of depth and cake filtration.
In general, a larger filter pore size yields a higher permeability (in Fig. 11). This result is for the filter pore number of 20 and 30 PPI in the figure. But in the case of 10 PPI, the reverse results are obtained due to influence of void and open channel, which are the flow path of gas during pressurization throughout the filter as shown in Fig. 12(a). So the result in the case of 10 PPI is not included in Fig. 11. This
result is unique one different from the experiments by water and gas filtration without solidification.4,16) However, the pressurized samples using the filter pore nuber of 20 and 30 PPI form the cake layer on the filter surface without open channels as shown in Figs. 12(b) and (c).
4. Conclusion
Basic experiments are carried out to obtain the perme-ability of semi-solid aluminum alloys using ceramic foam filter. The results are obtained as follows:
(1) Variation of solid morphology of semi-solid slurry has a large influence on permeability value under the same fraction of solid.
(2) In the case of slurry with globular structure, depth filtration is observed for low fraction of solid 0:33. Cake filtration is observed for high fraction of solid >0:33.
(3) In the case of slurry with dendrite structure, cake filtration mechanism is observed for most fractions of solid. Permeability values for depth filtration of globular structure are higher than those for cake filtration of dendritic structure.
(4) Permeability of both the semi-solid slurry movement in the filter and liquid flow through the solid network in the cake layer is estimated reasonably by the present method.
Fraction of solid
Slurry metal (cake layer)
Filtrated metal
0.25
0.33
0.48
[image:5.595.47.292.71.309.2]500 µm Pore
Fig. 10 Typical microstructure of the pressurized samples with dendrite structure for varied fraction of solid.
0 2 4 6 8 10
0 0.1 0.2 0.3 0.4 0.5 0.6
Fraction of solid
Permeability,
k
x10
-13
/m
2 20 PPI
30 PPI
cake filtration
depth filtration globular structure
Fig. 11 Plot of the permeability as a function of fraction of solid with changed filter pore size.
Open channel
(a) (b) (c)
0.28fs 0.36fs 0.40fs
[image:5.595.335.516.76.232.2]10 mm
Fig. 12 Typical filtration characteristics of the pressurized samples with changed pore size; (a) 10 PPI, (b) 20 PPI and (c) 30 PPI.
Fraction of solid
Slurry metal (cake layer)
Filtrated metal
0.35
0.43
0.54
500 µm
Porosities
Porosities
[image:5.595.308.548.290.412.2] [image:5.595.47.291.365.593.2]Acknowledgments
The authors would like to thank to Metal Division, Mie Prefectural Research Institute for chemical composition analysis. Finally, to Assoc. Prof. Mitsuharu Takita and Asst. Prof. Eiji Kato, Laboratory of Casting and Solidification Process, Graduate School of Engineering, Nagoya University for useful discussions and technical support.
REFERENCES
1) D. Apelian, M. C. Flemings and R. Mehrabian: Metall. Trans.5(1974) 2533–2537.
2) T. Takahashi, M. Kudoh and K. Yodoshi: J. Mater. Soc. Metals43 (1979) 1086–1091.
3) D. R. Poirier and S. Ganesan: Mater. Sci. Eng. A157(1992) 113–123. 4) D. R. Poirier and P. Ocansey: Mater. Sci. Eng. A171(1993) 231–240. 5) F. A. Acosta G., A. H. Castillejos E., J. M. Almanza R. and A. Flores
V.: Metall. Trans. B26B(1995) 159–171.
6) Ø. Nielsen, L. Arnberg, A. Mo and H. Thevik: Metall. Mater. Trans. A 30A(1999) 2455–2462.
7) P. C. Carman: Flow of gases through porous media, (Butterworth Scientific, London, 1959) pp. 11–13.
8) N. Streat and F. Weinberg: Metall. Trans. B,7(1976) 417–423. 9) R. Nasser-Rafi, D. Deshmukh and D. R. Poirier: Metall. Trans. A16
(1985) 2263–2271.
10) D. R. Poirier: Metall. Trans. B18(1987) 245–255.
11) K. Murakami and T. Okamoto: Acta Metall.32(1984) 1741–1744. 12) Foseco Japan Ltd:Metal filter data, Koube, Japan.
13) J. Bear and A. Verruijt:Modeling groundwater flow and pollution, (D. Reidel Publishing Company, 1987) pp. 27–52.
14) N. de Nevers:Fluid mechanics for chemical engineers, (McGraw-Hill, Inc., 1991) pp. 411–457.
15) L. Orgeas, J.-P. Gabathuler, Th. Imwinkelried, Ch. Paradies and M. Rappaz: Modelling Simul. Mater. Sci. Eng.11(2003) 553–574. 16) S. Mauran, L. Rigaud and O. Coudevylle: Transport in Porous Media