A study on conversion and storage of sustainable energy using aquatic civil structures
Author
E. E. Juffermans
Colophon
Enschede, July 22, 2017 Version: Final
E. E. (Eva) Juffermans (Author) University of Twente.
Bachelor Civiele Techniek
Campuslaan 45 7522NG Enschede
[email protected] +31 6 422 449 06
P. (Paulien) Hoogvorst MSc (Daily supervisor) Witteveen + Bos
Industrile automatisering & duurzame energie
Van Twickelostraat 2 P.O. Box 233
7400 AE Deventer
[email protected] +31 6 192 908 35
Dr. Ir. A. G. (Bram) Entrop (UT supervisor) University of Twente.
Construction Management & Engineering
Drienerlolaan 5 P.O. Box 217 7500 AE Enschede
Preface
This is a study on conversion and storage of sustainable energy using aquatic civil struc-tures. This report is the final result of my bachelor thesis project in Civil Engineering. Commisioned by Engineering and consultancy bureau Witteveen + Bos inquiries have been performed for the group Smart Infra Systems within a period of 11 weeks from May to July 2017 in Deventer. I am very grateful for the cooperation and ambience with and from Witteveen + Bos, especially from Paulien Hoogvorst and Johan Kornet.
Many thanks to my supervisor from the University Bram Entrop for trying to make sense of unstructured reports and support in the process. To Izak Hanse, Bas van Haaren and my parents my sincerest gratitude for digging through my text looking for improve-ments. Also special thanks to Emiel van Druten, Peter Suijdendorp and Herman Meester from Witteveen + Bos for enthusiastic responses to my research and help with collecting data.
For me this research is the link between two fields of study I very much enjoy: civil engineering and sustainable energy or hopefully my bachelor and master.
Abstract
The objective of this research is to gain information on possibilities concerning conversion and storage techniques in aquatic civil structures. Specifically on those techniques that use water in (a part of) the process.
Contents
Colophon ii
Preface iii
Abstract iv
1 Introduction 1
1.1 Background . . . 1
1.2 Structure of this report . . . 3
2 Research setup 4 2.1 Research objective . . . 4
2.2 Scope . . . 4
2.3 Research questions and methodology . . . 5
3 Conversion and storage of electricity 6 3.1 Criteria of selection . . . 6
3.2 Conversion techniques . . . 8
3.2.1 Hydro power . . . 8
3.2.2 Wave energy . . . 9
3.2.3 Tidal Energy . . . 12
3.2.4 Blue Energy . . . 14
3.2.5 Aquatic biomass . . . 15
3.3 Storage techniques . . . 17
3.3.1 Pumped hydroelectric storage . . . 17
3.3.2 Hydrogen storage . . . 18
3.4 Selection of techniques . . . 20
4 Test locations 21 4.1 Conditions . . . 21
4.2 Chosen locations . . . 23
5 Implementation 25 5.1 Sluis Sambeek . . . 25
5.2 Waaiersluis . . . 29
6 Analysis of the test locations 31
7 Conclusion 32
8 Discussion of the results 32
9 Recommendations for further research 33
References 34
Appendices 38
A Richtlijn Vaarwegen 2011 - Minimum vaarwegprofiel voor rechte
B Power output of reversible electro-dialysis 39
C List of various gates used in locks worldwide 40
D Blueprints of test locations 42
D.1 Sluis Sambeek . . . 42 D.2 Waaiersluis Gouda . . . 43
E Matlab script Sluis Sambeek 44
F Transcripts of interviews 48
1
Introduction
The discussion on sustainable energy sources has truly started during the last decades. However, a large part of the problems remain unsolved. Engineering bureau Witteveen+Bos is well aware of this problem, designing solutions to large projects on water, infrastruc-ture and other landmarks. Encountering the consequences of environmental change and limited resources on everyday basis in design constraints, questions on how to level the extremes in sustainable electricity supplies emerged. Regarding conversion and storage of sustainable electricity, several solutions among which the application of electricity stor-age for traffic purposes (like lighting systems and traffic regulators) or heating facilities were considered. The most promising solution appeared to be storage using aquatic civil structures due to the present level of expertise in the field by those involved and the possibilities those systems would provide. The involvement of water creates additional solutions, offering a broader set of sustainable techniques to resolve the issue.
[image:7.595.373.523.327.450.2]1.1 Background
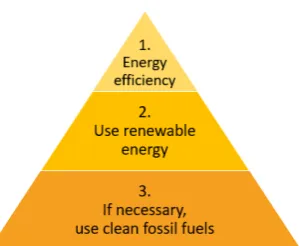
Figure 1: The Trias Energetica
When pursuing sustainability in the use of energy, the ’Trias Energetica’ can give guidance in approaching this goal. Internationally employed since 2001 by A.G. Hestnes (former president of the ’International Solar En-ergy Society’) it contains a roadmap to sustainable de-sign (see Figure 1) (Entrop & Brouwers, 2009). In the second step, use of renewable energy, an obstacle can be exposed. Renewable energy resources are character-ized by extremes in supply of electricity, as their sources are not enforceable in the amount of power they provide. For example with the use of photo-voltaic panels or wind turbines, whenever solar radiation or wind respectively
is strongly present or absent, these extremes are incited. The net load (calculated by subtracting the forecasted electricity production from the forecasted demand) does not follow these extremes: while the net load peaks during the evening and is relatively low during the day, Photo Voltaic panels (PV-panels, also known as solar panels) peak during mid-day (Denholm, O’Connell, Brinkman, & Jorgenson, 2015). See for example Figure 2 showing net load and electricity production from solar radiation and wind on a day in March in the state of California. According to this graph there is a risk of overgeneration around 12pm, meaning there would be more electricity generated than can be used at that moment. In 2013 California Independent System Operator (CAISO) made a projec-tion on the developement of the net load towards 2020 (California Independent System Operator, 2016). The already large differences in net load and the overgeneration risk will likely extrapolate in the upcoming years due to the increasing capacity of PV-panels during mid-day. This is also known as the ’Duck curve’(see Figure 3). This projection was recently confirmed by energy consultant ScottMadden (Vlahoplus, Litra, Quinlan, & Becker, 2016) reading even higher extremes than predicted .
Figure 2: Energy profile of March 29th 2013 in Cal-ifornia. Reprinted from Denholm et al., 2015, p.14
Figure 3: CAISO’s Duck curve: Daily energy load pro-file in California. Reprinted from Denholm et al., 2015, p.3
capacity of sustainable sources. The downside of this option is that the energy often needs to be transported a long path coming from the source, which causes major losses of energy due to resistance of the cables. Moreover, when considering smaller energy networks like neighbourhoods with average house holds, these heavy consumers might not be present in a suitable range. Besides, when all energy sources have been converted to be sustainable, this solution will not suffice.
Another option could be to store energy generated during mid-day hours for later use. The most common method of storing energy is in chemical batteries. After many years this process has been improved, but an efficiency up to 90% seems to be the limit (Anton & Sodano, 2007). Even with an efficiency of 90% the life cycle of a chemical battery is unsustainable. Storing energy in potential and kinetic energy of water, also known as ’Pumped hydro power’, is a mature, sustainable method of storing energy used in Australia, USA, Switzerland and many other countries (Paish, 2002). Although large scale applications require more head difference than present in the Netherlands, small or micro hydro power might form a solution for Dutch generation and storage.
When using potential and kinetic energy of water for storing and regenerating elec-tricity a necessary element is the existence of water in a controlled environment. This element can be found in all aquatic civil structures. Of these structures a potential source for generation of electricity may lie in those that discharge superfluous water. When dispensing superfluous water, potential energy is set loose and transformed into kinetic energy. Possibly techniques can be found to efficiently access and use this energy.
The problem statement is: ”Generation of sustainable electricity does not align with the demand of electricity consumers creating an environment in which sustainable
[image:8.595.303.523.88.234.2]1.2 Structure of this report
2
Research setup
[image:10.595.337.529.146.315.2]2.1 Research objective
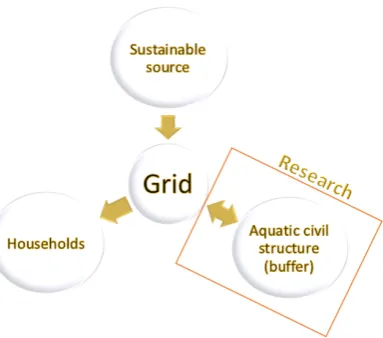
Figure 4: Research demarcation
With this research the options will be investi-gated for integrating energy conversion and stor-age techniques in civil structures that discharge superfluous water. These options could for exam-ple be present in sluices or weirs. Primary focus will be electricity and dammed water as energy carriers, because electrical energy will be both the supplying carrier (from the surrounding network) and the final carrier to enable consumers of the network to easily access and use the energy. In Figure 4 an overview of the positioning of this research can be found. Thermal energy will not be investigated due to the short amount of time available for this research and the absence of prior knowledge on critical subjects like exergy and ef-ficient use of thermal energy. This is a possibility
for further investigation to be conducted by a thermal energy expert.
The research objective is: ”To integrate energy conversion and storage in aquatic discharge structures using electricity and dammed water as energy carriers.”
2.2 Scope
The research will be done while keeping applications in the Netherlands in mind. This limits the scope by creating several issues. As a result the difference in altitude in the environment will be relatively low and when building up a volume of water as storage method this will form a restriction. The dimensions of the volume are limited to increase in surface (length and width) as opposed to depth causing restrictions in finding possible areas which are non-existent in areas with more altimeters. Additionally the water balance in most situations in the Netherlands is on a tight schedule of discharge and pumping due to the many polders and deltas in the Netherlands. This might not be compatible with discharge and pumping volumes needed for storing or converting energy.
Another important issue will be the changes needed to implement the desired tech-niques in real situations in the Netherlands. The operational techtech-niques used in the Netherlands are not designed to facilitate energy conversion or storage systems. When the current operational techniques should be replaced entirely, it is questionable how prof-itable such a project would be in both environmental and financial aspects. The emissions and materials necessary to facilitate such a project might diminish the positive effects of clean energy. It is also quite possible that no financial support can be found for projects with a long payback period in ratio to the profit since this research will probably result in small scaled solutions.
An output of relative small scale solutions is assumed because the potential of kinetic energy in Dutch rivers and waterways can estimated by the formula Ekin = 12mv2. This
equals a potential of Ekin = 12ρQv2 per second expressed by means of flow rate. The
mean flow rate of the Rhine at Lobith, representing the highest flow rate of the rivers of the Netherlands on average, is 2300 m3/s and the mean velocity at that point is
potential of Ekin = 12 ·1000·2300·12 = 1550000J/s = 1550kW for the largest river in
the Netherlands (neglecting efficiency of conversion techniques and assuming all water can be used). Compared to the energy needed to contribute to the national grid, this is a potential for local grids (US Department of Energy, 2002). If the profits outweigh the costs, it is desirable to implement such measures.
2.3 Research questions and methodology
The research objective can be achieved by answering the main research question:
”Can electrical energy be converted and stored using existing structures that dispense superfluous water?”
This question can be split in research to two separate subjects: conversion techniques and storage techniques. Although their application is tightly linked when aiming for high efficiency, they can first be investigated separately to better understand their relation and possibilities in aquatic discharge structures. After this they need to be evaluated together and tested on actual situations.
The process is described by three subquestions as listed below:
1. How can electricity be converted using dispensation of superfluous water?
2. How can electricity be stored using aquatic structures that dispense superfluous water?
The disadvantages and advantages of both options will be tested on the criteria pro-posed in Section 2.2 and a decision will be made on the most suitable techniques.
3. How can storage and conversion of electricity be implemented in aquatic civil structures that dispense superfluous water in the Netherlands?
Figure 5: The hypothetico-deductive method. Reprinted from MacLeod, 2017, slide 32.
3
Conversion and storage of electricity
To answer the first two research questions posed in Section 2.3 the possible techniques will be elucidated and evaluated on several criteria. These criteria will be alleged and cat-egorized in the first section. After setting the framework the techniques will be discussed and in the last section of this chapter an analysis is performed on both the conversion and storage techniques. With the analysis high potential techniques can be distinguished.
3.1 Criteria of selection
The conversion and storage techniques will be compared on several criteria to determine which techniques are better applicable in civil discharge structures. This is executed by comparing the advantage the technique offers when operating with the disadvantage of the investment needed, considering the circumstances that the impact of the technique will create.
Impact; the effect of implementing a conversion or storage technique in a water lock will be measured by two aspects: the impact on the water balance and on the (original) function of the lock. The effect on the water balance will be measured by percentage of deviation of the local and total1volume flow rate in m3/s. The impact
on the original function will depend on the primary goal the original structure had, in which two categories can be distinguished: navigation and retaining water. The impact on the first category will be measured by percentage of delay in passage in minutes, the impact on retaining water by percentage of deviation in head in meters.
Total Cost of Ownership (TCO); an estimation of the TCO should indicate the financial benefit of the technique that is to be implemented. Aspects of the TCO are installation and maintenance costs, the revenue from supplied electricity measured in Euro and deducible from the first aspects, payback time.
Performance; the total power (kW), maximum capacity (kWh per year) and effi-ciency should be as high as possible. The first goal will be electricity supply for the structure itself and when this amount can be exceeded, supply for the local grid is considered.
The criteria for consideration of conversion and storage techniques need to be measur-able and comparmeasur-able to extract conclusions. The criteria are made comparmeasur-able by use of the rating scale of Likert (1932). This measurement method provides an attitude scale towards degrees of approval with the questionnaire materials and has often proved itself in research papers. A study on review of scale developments (Hinkin, 1995) has shown that up to five point scaling the coefficient alpha reliability increases. Reliability of scaling methods using more than five points level off. Therefore, a five point scaling system is applied. All criteria have been given values for each rating relative to each other, where a very positive rating corresponds with much potential for local grid supply and a very negative rating with few potential for even supporting the energy supply of an average lock system (see Table 1).
The impact is scaled to a commonly used method of design for safety in waterways, the project ’Veiligheid Nederland in Kaart’ (Projectbureau VNK, 2013). When implementing conversion techniques, the flow rate will often slow down due to extraction of energy from the water resulting in a decrease in head. With a deviation of the head higher than 10%,
Table 1: Rating of criteria
Rating: - - - -/+ + ++
Impact
Water balance (% of m3/s) ≥20 15 10 5 0
Function of the water lock (% of m or min) ≥20 15 10 5 0
TCO
Installation cost (e/kWh) ≥2000 1000 500 250 ≤100
Maintenance cost (e/kWh/year) ≥200 100 50 25 0
Payback time (years) ≥40 30 20 10 ≤5
Performance
Power (kW) 0 25 50 100 ≥200
Capacity (MWh per year) 0 100 200 400 ≥800
industrial navigation might not be possible depending on the waterway causing extra costs for dredging. The same is assumed for the flow rate (the relation between flow rate and head is not lineair, but they are strongly related). The time to lock ships in larger navigation lock amounts to approximately 15 minutes (Provincie Flevoland, 2017). A deviation of a few minutes is acceptable although not preferable and set to the rating +/-.
The total cost of ownership is scaled to the performance criteria. The installation costs that are higher than those that would correspond to the ++ rating of power and capacity are set to the – rating, costs that are lower than those that would correspond to the – rating of power and capacity are set to ++ and the installation costs corresponding to the +/- rating of power and capacity are set to +/-. Similarly, the maintenance costs are processed. The rating of payback time is based on several case studies in sustainable energy for moveable bridges and locks (Bierling, 2015) and the assumption that most renewable energy systems have a life span of a maximum of 40 years. Costs of replacement of the technologies after lifespan and subsequential revenue and payback times have not been taken into account. The revenue is estimated using the present price categories from www.apxgroup.com ofe40/MWh When knowing the installation, maintenance and revenue, the payback time can be estimated.
3.2 Conversion techniques
Currently many techniques using several different sources are in some phase of the process from research to competing on the energy market. The ones listed below have been filtered to techniques using water in (a part of) the process. They are sorted by source of energy.
3.2.1 Hydro power
Hydro power is a conversion technique using the pressure of water (from velocity or head) to drive some sort of turbine. In the turbine the gyration of the rotor is converted to electricity by making changes in the surrounding magnetic field inducing an alternating or direct current.
Impact
The impact on the water balance from implementing hydro power can be minimized by homogenizing the original flow rate distribution (over time) with the flow rate exhaust from the turbine(s). Locally the flow rate will increase with the ratio of the width of the river to the width of the turbine entrance. Common crossflow turbines have an entrance width of 0.2 m on average (Chaurette, n.d.), compared to large rivers and canals in the Netherlands of 100 m in width this results in a ratio of 500. Erosion of the waterway can be protected from this acceleration by monitoring the exhaust of the turbine and when encountering high speeds arrangements could be made to reduce the exhaust flow, for example by facilitating a stilling basin.
The impact on the function of the lock depends on the application. When using dis-charge of the lock to convert energy, disdis-charge times need to be estimated in advance. When obstructing passage of navigation or deviating too far from the desired discharge rate the flows should be separated or it should be possible to bypass the turbine. Conse-quences of deviation from the flow rate could for example include: obstruction of industrial purpose navigation causing issues in economic and transportation equilibria.
TCO
The total cost of ownership can be estimated assuming the potential power would be around 15 000 kW and capacity around 60 000 MWh (hypothetical case in between the calculated power output of paragraph ’Performance’ below). This is performed using a study from the energy research centre (ECN) on characteristic numbers for small hydro projects (Beurskens & van Sambeek, 2003). Installation costs are dependent on the cur-rent situation of implementation. Assuming the use of an existing structure, following the scope of this research, the installation costs would be between e1000 ande1500 per kW, adding to a total of 1250·15000 =e18 750 000. Maintenance can be estimated to 2% of the installation costs per kW each year, resulting in e375 000 per year (Lako & Wakker, 2009).
The price of electricity varies greatly over day and year, for present price categories see www.apxgroup.com. Assumed is an average of e40 per MWh resulting in a revenue of about e2 400 000. This suggests a payback period of approximately 8 years.
Performance
The source of pressure defines the maximum power output and two sources can be dis-cerned: kinetic energy and potential energy.
output can be derived from the basic formula of kinetic energy, EKin = 12mv2, as shown
in Equation 1.
PKin=
1 2ρQv
2η (1)
Where: P is the potential power output in W. ρ is the density of the water in kg/m3.
Q is the flow rate of the water in m3/s.
v is the velocity of the water in m/s.
η is the dimensionless efficiency of the turbine.
Potential energy is converted by placing a turbine at the base of a head difference in water and aiming a flow pressurized by the head difference at a turbine. Potential energy of the water is transformed to kinetic energy and to work done on the blades. The maximum power output from potential energy can be derived from the basic formula for potential energy, EP ot=mgh, as shown in Equation 2.
PP ot=ρQghη (2)
Where: g is the standard gravitational acceleration of 9.81 in m/s2.
h is the difference in head before and after the obstruction in m.
In both equations it is assumed that the flow rate will remain the same (instead of decreasing due to friction losses) and that the water flowing through a certain point in the river can exclusively be directed through turbines and used for conversion of energy.
The potential power output from each source is equal when the ratio of velocity versus head is 0.051v2 = h. The mean head at weirs in the largest rivers of the Netherlands (Rhine and sub rivers and Meuse) is between 2 and 3 meters (Meulen et al., 2008). To match the potential in power from potential energy, the velocity would need to meet values of at least 7 m/s. A multiplication as such would have consequences for the water balance. The potential energy will therefore be used to calculate the potential for hydro power, with the Meuse and Rhine/Waal as examples. The Rhine has a mean flow rate of 2300 m3/s, the Meuse 290 m3/s and a mean head of 2 m is used for the Rhine and 3 m
for the Meuse (although in reality this strongly depends on the location).
This forms a potential for the Rhine of 1000·2300·9.81·2 = 45126η kW peak power. Assuming the turbine could run 50% of the time (due to differences in flow rate), the po-tential capacity would be 45126·365·24·0.5 = 1.98·108η kW hper year. For the Meuse in a similar calculation: 1000·290·9.81·3 = 8535η kW and 8535·365·24·0.5 = 3.74·107η kW h. This amount is not entirely accessible due to turbine efficiencies of 70-90% (Nasir, 2014), friction losses, unwanted deceleration of the flow rate and the inability to guide the entire stream through a turbine. Assumed is that 75% of the flow rate can be guided through turbines, with 80% efficiency, this means approximately 60% of the total amount is ac-cessible. This results in a final estimated power of 27 076 kW and 118 591 MWh per year for the Rhine and 5 121 kW, 22 430 MWh per year for the Meuse.
3.2.2 Wave energy
or vessel induced pressure gradient. For this analysis wind induced waves have been left out of the scope since wind induced waves reduce greatly in size before encountering civil discharge structures due to blocking of the wind by shore, vessels and decrement of depth of the water.
Impact
The impact of wave capturing techniques is positive. Drivers or pressure pads along the side of waterways adds to protection of the shore by forming a physical boudary to ero-sion of water, wind or objects tempering the surface. The impact on water balance and function of the lock is non-existent.
TCO
A study on energy from waves along shore estimates the installation costs for piezo elec-tric materials or drivers alongside the shore at a maximum of e200 per running meter (van der Wal, de Jong, & Weller, 2010). Exact numbers on maintenance costs are unclear. Assumed is that by use of drivers or piezo electric materials relatively much maintenance is needed due to the impact of algae or damage to the performance of the systems. The revenue on vessel induced wave energy would be approximately e120/m considering the performance of drivers (the best perofrming technique, see ’Performance’) 3000 kWh/m2. The amount is a hypothetical case between the potentials of the Meuse and Waal. To make the technique profitable, the maintenance costs should be below e120/m per year or lower. When maintenance costs of e80/m could be established, the payback period would be approximately 15 years. Assumed is the same price per MWh as hydro power and that the vertical length of the area of potential energy is utilized fully by the chosen technique.
[image:16.595.301.522.474.594.2]Performance
Figure 6: A water column in the x, y, z field used to calculate the wave energy. Reprinted from Holthuijsen, 2007, p.131.
The available amount of energy from waves can be calculated using the Airy wave the-ory, also known as linear wave thethe-ory, from George Beddell Airy (1801-1892) describ-ing the time averaged wave induced en-ergy per unit horizontal area by addition of potential and kinetic energy (Holthuijsen, 2007). The potential energy of a wave is the potential energy of the water column including the wave, minus the potential energy of the water column excluding the wave as illustrated in Figure 6. This can be described by the following intervals:
Epot =
Z η
−d
ρgz dz −
Z 0
−d
ρgz dz =
Z η
0
ρgz dz (3)
Where: Epot is the energy of a wave over area ∆x∆y inJ/m2.
d is the water depth in m. η is the surface elevation in m.
ρ is the density of the water in kg/m3.
The result of this integral expressed in terms of wave amplitude a is:
Epot=
1 2ρgη
2 = 1
4ρga
2 (4)
The kinetic energy of this wave can be expressed as 12ρ∆x∆y∆zu2 with u2 = u2x +u2z. Under the conditions from the linear wave theory this can be abbreviated as:
Ekin =
1 4ρga
2 (5)
Describing the kinetic energy per unit horizontal area. The total wave energy density is then Epot+Ekin:
Ewave=
1 2ρga
2 (6)
The available amount of power that theoretically could be extracted (provided the effi-ciency of all conversion systems is 100%) is defined by multiplying the wave energy with the group velocity:
Pwave =Ewave·cg =c·n·
1 2ρga
2 (7)
Where: Pwave is the power of a wave in W/m2.
cg is the propagation velocity of a group of waves in m/s.
c is the phase speed of a wave in m/s. n is a dimensionless ratio 1
2 1 + 2kd sinh(2kd)
.
An equation from (Permanent International Association of Navigation Congresses, 1987) based on an analysis of nine empirical studies on wave height (Sorensen, 1997), can be used to calculate the maximum wave height:
hmax=A”d
S
d
−0.33
F2.67 (8)
Where: hmax is the maximum wave height in m.
A” is a dimensionless coefficient accounting for vessel properties. S is the distance from the origin of creation in m.
F is the ratio of flow inertia to the external field √v
[image:17.595.323.538.565.734.2]gd or Froude number.
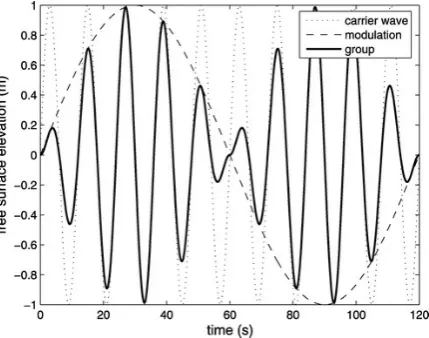
Figure 7: Wave pattern of a group of waves. Reprinted from Soldini et al., 2013, p.64.
With the wave height, the propagation speed c can be estimated based on the wave height from empirical data on the IJsselmeer (Effing, 2005). This value is set to 6 m/s which is slightly lower than the propagation speed at very shallow depth ofc=√gd= 6.9. This cor-responds with the Froude value which in shal-low waters should be greater than 0.7 and in this case is √v
gd = 0.56 or 0.60 depending on
the respective speed of the vessel.
Coefficient A” equals 0.8 for conventional in-land vessels and their speed is on average 14 km/h (van Ommeren, 2011), for recreational navigation A” is 0.25 and the speed varies. Recreational navigation speed is estimated on 15 km/h to account for an average of smaller
A group of waves is assumed to have a pattern of maximum wave height at the highest point, surrounded by waves at 80% of the maximum wave height, 60%, 40% and 20% along each side, illustrated by the bolt black graph in Figure 7.
Most waterways in the Netherlands appropriate for industrial navigation purposes like the Rhine, Meuse and many large channels, are monitored by Rijkswaterstaat and kept to certain design requirements on fairway profile conditions (Rijkswaterstaat, 2011). The minimum depth is 4.9 m and the average distance from the side of the vessel to shore is 14.1 m (0.5Wt+ 0.5∆w−0.5Wd, see Appendix A CEMT-VI). Furthermore, a report of
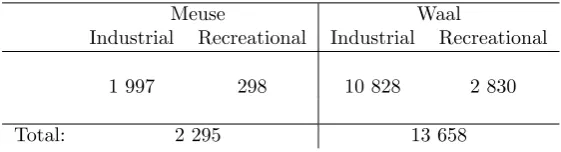
[image:18.595.157.438.297.373.2]Adviesdienst verkeer en vervoer and CBS (2003) provides general numbers for recreational and industrial passages. Of the larger rivers in the Netherlands, the Meuse and Waal or ’boven Rijn’ form high potential with much passage. In table 2 the potential energy of vessel-created waves in the Meuse and Waal have been calculated for one side of the river (with the most potential, i.e. the most vessels passing on the respective side).
Table 2: Potential power of vessel induced waves inkW h/m2 per year
Meuse Waal
Industrial Recreational Industrial Recreational
1 997 298 10 828 2 830
Total: 2 295 13 658
The efficiency of conversion of tidal power is depend on the technique used and only preliminary research is currently available.
By use of drivers the power output is estimated by (van der Wal et al., 2010) on approximately 0.5 kW on average. Considering a wave period of 3.9s, based on the research of (Effing, 2005), and 23392 vessel passages (based on the Meuse, amount of industrial and recreational passages on the northern/eastern side of the river) the capacity would be 760 kWh/year. Sub sequential the efficiency equals 760./2295·100 = 33%. For the Rhine 160915 vessel passages is used to result in a capacity of 5230 kWh/year
For piezo electric materials the efficiency is estimated in a research from Anton and Sodano (2007) to be 3%, yielding a capacity of 69 kWh/m2for the Meuse and 410 kWh/m2
for the Rhine.
Because of the better estimated performance of drivers, this technique will be compared in the selection of techniques.
3.2.3 Tidal Energy
Elevation of the water surface also occurs on larger intervals of approximately 12 hours. This is induced by the gravitational pull from the moon and sun causing respectively high and low tide and spring and neap tide.
Impact
The impact of tidal energy techniques is large on the global water balance due to relying on storage of large volumes of water to provide an outflow through a turbine. The largest issue would be how salt or brackish water could easily be stored without heavily impacting the surrounding (sweet water) environment. The function of the water lock however, bears close to no impact from such techniques.
these will not further be included in this research.
TCO
The installation costs for a turbine strongly depends on the application. The costs for the fabrication of a storage facility would be very large considering the options of a concrete bunker or excavation of some sort of lake. The latter is disregarded due to salinization of the environment.
At www.familyhandyman.com and www.concretenetwork.com an approximation of concrete costs of 90$per cubic yard is advised which equals about e100/m3. To estimate
the costs of a concrete storage environment, a price ofe120/m3 is assumed, including 10%
spilling and 10% extra for special finishing for submerged concrete exposed to salinity. Assuming an area of 1000 m2 (f.e. a river or channel 200 m in length and 5 m in width
or a basin of 1 km by 1 km) and considering an amplitude of 0.7 m with a capacity of 0.06 Wh/m2 surface area (see next paragraph), this solution would have a capacity of
0.06 kWh. With no maintenance costs and no installation costs regarding the turbine or implementation of the materials, the payback time would amount to 50 million years.
Performance
The power of tidal energy can be calculated with a similar approach as hydro and wave energy: the total energy is the potential plus kinetic energy (Gorlov, 2001).
When implementing such techniques considering a basin for storage, the tidal velocity will be close to zero, therefore the kinetic energy is negligible and the total energy can be calculated by integrating over the vertical coordinate of the lifted volume:
ET idal=Agρ
Z
z dz = 1 2gρAH
2
(9)
Where: ET idal is the tidal energy inJ.
A is the surface of the lifted volume inm2.
g is the standard gravitational acceleration of 9.81 inm/s2. ρ is the density of sea water of 1035 kg/m3.
z is the vertical coordinate of the lifted volume in m. H is the head of tide inm.
This is the energy generated in one period of high tide - low tide - high tide taking 12 hours and 25 minutes in the Netherlands. A study from Ecofys (van de Berg, Geurts, & Stolk, 2010) shows that a tidal amplitude of 0.7 m is the optimum for inland applications, where a lower amplitude would tend towards a non-beneficial amount of energy conversion and a higher amplitude to large surcharge of the payback period due to high installation and maintenance costs. This would result in a potential power of 12·9.81·1035·0.72·A = 2.5
kW/m2 2488· 1
12.42·3600 = 0.06 Wh/m
2 surface area.
When using turbines to use tidal velocity the power from potential energy becomes negligible. According to Gorlov (2001), using turbines to extract power from a free un-constrained flow can be calculated with Equation 10.
PT idal =
1 2ρAv
3
(10)
3.2.4 Blue Energy
Blue energy is the name for all techniques using salinity difference to extract energy from water. The two most commonly employed techniques are pressure-retarded osmosis or ’PRO’ and reverse electro-dialysis or ’RED’. There are other forms of extracting en-ergy from salinity difference like applications of electric double-layer capacitors, Faradaic pseudo capacitors and abiotic nano fluids, but they are still under developement (Jia, Wang, Song, & Fan, 2014). In several years these might be worthwhile.
Impact
The impact of blue energy systems on the water balance would be minimal at structures that form a barrier between salt and sweet water. The output of the systems could be guided back to its respective origin and the brackish water should be led to the salt water side. Considering the never ending supply of salt water, this would have minimal effect on the salt concentration (especially in tidal areas) and the salinization would have no effect on the sweet water environment.
The impact on the function of the lock for guard locks would be at risk to a certain extend. When the function is to make an absolute division between salt and sweet water, a problem might occur in the extraction of sweet water. Since the sweet water is partly mixed with salt water, the amount of discharge to the sweet water source will be less than the original amount (small for PRO systems and none for RED). This should be taken into account. Implementation by combination of the streams to the lock is not practical. The flow rate of sweet water is about 700 mL/min which would cause the locking function to delay by a very large amount of days.
TCO
Information on the costs of PRO and RED systems is not publicly available. The system’s preliminary results are insufficient to review the technique as an option for civil discharge structures for now.
[image:20.595.322.548.525.659.2]Performance
Figure 8: Construction of pressure-retarded os-mosis electricity generation. Reprinted from Jia et al., 2014, p.93.
PRO uses the pressure difference of salt and sweet water to drive a turbine. Sweet water is directed aside from salt water separated by a membrane only permeable by water (not by any dissolved substances). This induces a flow from sweet to salt water to alleviate the low pressure in the sea water tube. The added water causes the pressure to rise and this pressurized water is leaded through a turbine to generate electric-ity, illustrated in Figure 8. Theoretically this pressure difference is about 23 ATM under nor-mal circumstances (20◦C and 3,5% difference in salinization), equivalent to the potential en-ergy of a 231 m dam (Jia et al., 2014). However, the power density is strongly dependent on the
properties of the membrane used. A pilot project from the company Statkraft generated roughly 1 W per m2 of membrane division. Graphene membranes, consisting of a
hexag-onal honeycombed lattice with sp2-bonded atoms, potentially form a large improvement
has chosen to discontinue its investments in the project in 2014 because the goal to make the technology competing on the market has proved to be too difficult for now (Stattkraft, 2013).
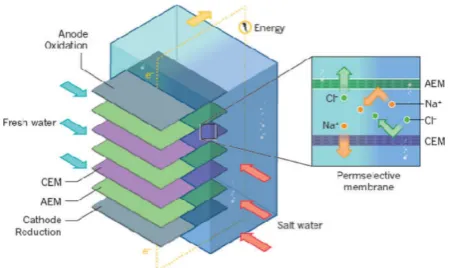
RED systems use the different ion solutions of sweet and salt water to create a current from one solution to the other. Membranes dividing two different solutions flowing in the opposite direction are only permeable by either cathodic or anodic ions, illustrated in Figure 9. The positive and negative ions in the salt water move in opposite directions to the sweet water due to the respective filter of the membranes, thereby creating a current when the outer sides are connected by a circuit. By stacking multiple layers of salt and sweet water on top of each other, a circuit is created of multiple small ’batteries’ each adding an even amount of power to the circuit.
The maximum power output of RED systems can be described by Equation 112.
Pmax =
(V0)2 4Rstack
[image:21.595.321.546.304.438.2](11)
Figure 9: Construction of reverse electro-dialysis electricity generation. Reprinted from Jia et al., 2014, p.95.
The company REDstack is the leading re-search facility on RED systems in the Nether-lands. Currently a project on the Afsluit-dijk near Harlingen is the world’s first ’real world’ feed water operated plant, see also www.redstack.nl. A lot of progress has been made over the last few years, but considering the necessary amount of water needed to flow through all stacks the technique is not ready for small scale plants implemented in locks. Since the product of RED is only brackish water, the generated power is generally considered to be limited most by the available amount of fresh water. Possible locations in the Netherlands are therefore limited to the Afsluitdijk and perhaps
in the province of Zeeland. The results on REDstack’s project may shed some light on the possibilities. For this research the potential of blue energy is insufficient.
3.2.5 Aquatic biomass
Aquatic biomass can be divided in two main categories, breeding micro algae and breeding seaweed. The latter is mainly used for cultivating nourishment. In the ’80s and ’90s experiments on harvesting energy have been conducted, but due to issues on rinsing the biomass and damage to the breeding environment in harsh weather the technique could not compete with the low oil prices (van de Berg et al., 2010). Since then other experiments have been conducted and although there is potential in projects at sea, none have proven competitive with other energy sources.
The breeding systems used to cultivate micro algae can be divided in open systems (exposed to open air) and closed systems. Currently projects with open systems are trying to find solutions to the relatively low biomass concentrations, sensitivity of the system to other organisms like competing algae or animals feeding on algae and lack of control on the temperature among other things. These issues do not (or in lesser intensity) occur in closed systems.
Basically all algae cultivations need light, carbon dioxide, nutrients, water and a mild temperature. Closed systems like bubble columns, horizontal tube reactors or flat plate
reactors can easily control these substances. There are many variations on the above men-tioned systems, elucidated in the book ’Duurzame Energietechniek’ (Ouwehand, Papa, Entrop, & de Geus, 2017) and the article (van de Berg et al., 2010).
Impact
Closed systems barely interact with civil discharge structures. The only factor they have in common is the water flow and the amount needed for cultivation is far below 1 m3/s. The impact on the environment however, is in contrary to the previous renewable sources, not zero. The process of cultivating algae is in need of light, nutrients and controlled tem-perature, all produced by using electricity (or other power sources) and emitting exhaust fumes in production and/or transportation.
TCO
A project in Spain, Jerez with a volume of 85 m3 and a area footprint of 1000 m2
de-manded an investment of e200/m2, a total demand ofe200 000. An example of a project
in Spain, Almria is a six unit photo bio-reactor with a cultivated volume of 30 m3 and
area footprint of 600 m2. A study from Ecofys (van de Berg et al., 2010) compared this to the potential outcome in the Netherlands, resulting in a revenue of 109 GJ per year. The installation and maintenance costs of such a scale have not been explicitly calculated, but assumed is 50% of the installation costs for maintenance. In comparison with the project in Jerez, the investment costs is assumed to be similar since the maintenance is slightly lower in proportion to the scale (less algae will probably need less nutrients and carbon dioxide) but the lower scale usually results in higher investment costs in proportion to up-scaled projects. With investment or installation costs of e200/m2 and maintenance
costs of 50%·e200/m2, results in maintenance costs of e60 000 per year and installation
costs of e120 000. The revenue of 98.8 GJ/year (or 27 444 kWh/year) equals e1 097 per year assuming an energy price of e40 per GWh (see Section 3.2.1). The revenue of this project does not become beneficial overtime considering the maintenance costs are a factor of 60 higher than the revenue.
Performance
3.3 Storage techniques
Similar to the conversion techniques, the storage techniques have been filtered to those using water in (a part of) the process. Below the two hydro storage forms are elucidated and described on each criterium.
3.3.1 Pumped hydroelectric storage
Pumped hydro electric storage or ’Pumped hydro’ is a form of mechanical energy storage using pressure from potential energy of water and converting the energy to electricity by use of turbines.
Impact
Pumped hydro has a large impact on the flow rate, it’s the main parameter that is altered. The deviation could easily exceed 20% depending on the situation.
The impact on the function can be high if the lock is a scouring lock. In such situa-tions the water balance is usually tight which is the reason for existence. The impact on navigation locks is minimal. The function will require a certain amount of water for each lock cycle, but when comparing this to the flow rate of a turbine it is negligible.
TCO
Considering the costs involved to implement pumped hydro in navigation locks, the only investment would be in turbines. These costs are similar to those before mentioned in section 3.2.1, but will require slightly less payback time due to the more efficient use of the turbine.
Performance
Potential energy storage in civil discharge structures can use an upstream lake (or river or channel) to store water. The weir is already in place, but to generate electricity turbines will need to be installed.
The performance of the system will depend on the dimensions of the available basin and efficiency of the turbine. The same parameters for calculations of turbine power will be used as in Section 3.2.1. The capacity however, will be calculated taking the basin into account. The effect on the capacity will be that in times when the flow rate exceeds the design rate for the turbine, water can be impeded (to certain amounts) extending the operation time of the turbine.
Rijkswaterstaat has provided flow rate distributions over the last few years of measuring point Sambeek in the Meuse (Personal Communications, 2017). The normative high water level or ’Maatgevende Hoogwaterstand’ for the Meuse is based on a recurrence time of 1/1250 years and amounts to 3800 m3/s (van Schrojenstein Lantman, 2004). When designing a turbine with peak performance on the average flow rate of 277 m3/s, the flow
rate is lower than the design flow rate in 1864 days over 10 years, illustrated in Figure 10. That is 66% of the time in which the turbine could perform better. When stocking water between the weir and the previous weir upstream, the exceeding amounts in wet periods could (to certain extend) be used in dry periods. The weir of Sambeek raises to a height of 10.85 m+NAP. A discharge amount of the mean flow rate raises the water level to 10.88 m+NAP upstream and each year a peak in discharge occurs in the late winter. Since the mean flow rate already causes the weir to overflow, the turbine should be designed to perform best on a lower flow rate.
Figure 10: Flow rate at Sambeek in the Meuse from 2001-01-01 till 2015-12-31.
to weir design rate a constant maximum power is assumed. With a design flow rate of 277 m3/s and head of 2.77 m the capacity equals 1000·277·9.81·2.77·0.8·241·24·0.5 = 17414
MWh/year. An example is calculated with a design flow rate of 230 m3/s. The turbine
peak power would amount to 1000·230·9.81·3.02·0.8 = 5.45 MW. The turbine is shut down during the entire period the flow rate is higher than the weir design rate of 277 m3/s. The capacity of the system would be 5.45·(213·0.5 + 28)·24 = 17596 MWh/year. Due to linearisation of the turbine power below design flow rate, this is not completely accurate, but it indicates towards benefit of a study on design flow rate for the turbine and improvement of the original capacity of the turbine.
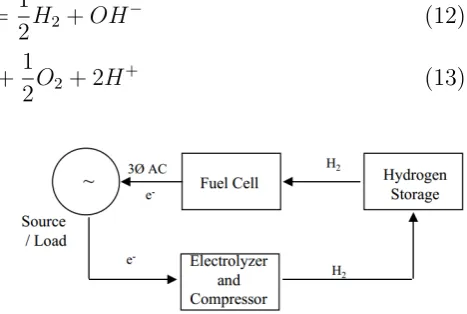
3.3.2 Hydrogen storage
Electricity can be stored by use of hydrogen. The technique stores power using fuel cells and regenerates electricity by converting chemical energy back to electricity or using hydrogen in a combustion engine or turbine, illustrated in Figure 11. Production of hydrogen with electrolysis is by the chemical reaction of Equation 12 at the cathode and Equation 13 at the anode. After that it can be stored in liquid or pressurized gas form (Huggins, 2010).
H2O+e− =
1
2H2+OH
−
(12)
H2O =e−+
1
2O2+ 2H
+
(13)
Figure 11: Hydrogen energy storage system using fuel cells. Reprinted from (Schoenung, 2001, p.8).
[image:24.595.291.525.553.710.2]Impact
The impact on the flow rate as well as the function of the lock is non-existent. If water is needed at all, it is only needed for the first charge cycle to sustain electrolytic production of hydrogen. Discharging the battery or reversing the reaction reproduces water, so it could be used again. The steam reforming process of producing hydrogen is more cost efficient and therefore more often used technique for hydrogen production. The plant consumes a large area and can be connected to a large grid.
TCO
In an article on the combination of solar and wind power with hydrogen storage (Shakya, Aye, & Musgrave, 2005), a project with a capacity of 25 185 kWh estimated total capi-tal costs of e340 000 with a lifespan of 25 years. The maintenance costs of the storage amount to 30% of the total capital costs 340000/25185·0.3/25 =e0.16/kWh/year. The installation costs aree149 090. The revenue ise40 296/kWh/year resulting in a payback time of slightly below 4 years.
Performance
3.4 Selection of techniques
[image:26.595.67.530.191.359.2]The rating discussed in Section 3.1 is applied to all conversion and storage techniques listed in Sections 3.2 and 3.3. The score of each technique is based on a five point rating scale from – to ++, listed in Table 3, and is deduced from the information listed in the previous sections. With this information a judgement can be made on the best conversion
Table 3: Rating of conversion and storage techniques
Impact TCO Performance
W ater balance F unction Installation Main tenance P a ybac k time P o w er Capacit y T otal
Conversion Hydro power -/+ -/+ - + + ++ ++ 5+
Wave energy ++ ++ ++ - + - - + 5+
Tidal energy - - ++ - - - ++ - -
6-Blue energy -/+ -/+ N/A N/A N/A N/A N/A 0
Aquatic biomass ++ ++ ++ -/+ - - - - ++ 4+
Storage Pumped hydro - - -/+ -/+ ++ ++ ++ 5+
Hydrogen ++ ++ ++ ++ ++ ++ ++ 14+
and storage technique for aquatic civil structures.
Two best techniques tied with a score of five above average or nineteen out of twenty-eight points for conversion: hydro power and wave energy. Comparing the two techniques, wave energy scores much better on impact while hydro power excels at performance. When considering the three criteria as one each, instead of by each component the score of hydro power is -/+, +, ++ for impact, TCO and performance and the score of wave energy is ++, -/+ or + and - or -/+ respectively. The slightly down-graded components of wave energy in comparison to hydro power favors the result of the best conversion technique in hydro power.
The best storage technique according to the rating scale is hydrogen storage. However, this technique should not be implemented in aquatic discharge structures. The only component where water from the Dutch waterways could play a role is the process of producing hydrogen. The amount of water involved in this process is not very voluminous and should be treated before ready to produce hydrogen. A good location for a hydrogen storage plant could be near or implemented in a water treatment plants. Closer to a larger grid connection would also be advantageous. Taking into account the implementation of hydro power as conversion technique, storage of energy by pumped hydro will be part of the design process when optimizing turbine design to the water balance.
With the answer on the first two sub-questions a hypothesis can be phrased:
”Electrical energy can be converted and stored using hydro power and pumped hydro storage in existing structures that dispense superfluous water”
4
Test locations
To be able to answer the main question and achieve the goal of this research, a few ex-isting situations will be investigated to test the applicability of conversion and storage techniques. These situations will be determined by conditions derived from both compat-ibility with the restrictions that are encountered and optimization of the resulting power output. The first and second condition ensure compatibility with restrictions posed in the scope (see section 2.2), the third optimizes the resulting power output.
Adaptability of operational techniques; the properties of mechanisms used to dis-charge and lock the water should be accessible and (to a certain extend) adaptable to changes. They can help in the storage and conversion process when flows are already separated (or otherwise directed beneficial to the energy density), but also oppose the possibilities when (part of) the available water volume is needed to pro-ceed with the primary functions like navigation and regulation of the water level.
Flexibility of the water balance; when energy is extracted from speed or pressure of water, firstly the water is directed to a smaller space to increase energy density. Afterwards the remains are redirected to the original flow. This affects the surround-ings by corrosion and temporal deficits and surplus. The water balance in the chosen situation should be flexible, able to cope with water level and speed fluctuations.
Scale; the potential for each situation can partially be assessed in advance by review-ing the physical dimensions of the lock system and water flow rate. When considerreview-ing smaller constructions with fewer discharge, the potential will likely be smaller than in sizeable systems with a large dispensation of water.
Depending on the situation the solution could be used to ensure an energy neutral struc-ture or function as a storage system for sustainable energy from local electricity networks if the scale of the solution proves to be substantial.
4.1 Conditions
To determine which situations are practical and representative, a short evaluation has been made on the previously discussed conditions: adaptability of operational techniques, flexibility of the water balance and scale.
Adaptability of operational techniques In the Netherlands there are many different types of gates used to lock water. In Appendix C a list of different gates has been included. In these types a general pattern can be found. They all dispense using one (or more) of the mechanisms listed below (Glerum & Vrijburcht, 2000) (US Army Corps of Engineers, 1995a) (US Army Corps of Engineers, 1995b):
Lock culverts (see Figure 12)
These tubes form a water transportation system circumventing the gates of the lock. Due to the concentrated flow through the tubes, turbines could form potential in these mechanisms.
Gate openings or valves (see Figure 13, marked green)
Gate openings are sliding lids opening vertically or horizontally to let the water through the doors. They are operated mechanically due to large pressure.
Moving gate (see Figure 13, marked orange)
Figure 12: Example profile intersec-tion water lock with lock culverts
Figure 13: Frontal intersection lock gate with valve openings and a moving gate
Of these mechanisms two will be investigated in a currently existing scenario from the Netherlands. Firstly inquiries shall be made on gate openings (or valves). These types of dispensation are most common in the Netherlands. When finding a sustainable application for these types, it would be applicable to many situations in the Netherlands. Secondly lock culverts will be investigated. These types are less common than gate openings, but form a high potential for turbines due to separation of the water from the rest of the system: more spacious solutions will be applicable and the impact on the river dynamics will be lower. Moving gates will not be investigated due to the large amount of changes needed to facilitate conversion and storage techniques and their relatively low presence in locks in the Netherlands.
Flexibility of water balance As mentioned earlier corrosion and temporal deficits or surplus will be the main disadvantages when energy is extracted from pressure of water. All waterways in the Netherlands are on a relative tight schedule of discharge and pumping due to the chance of flooding in all areas with few elevation. This controlled environment is even more present in channels than in (canalized) rivers due to the low range in flow rate. Channels are therefore excluded from the potential locations for testing conversion and storage techniques.
Scale To optimize the possible amount of conversion the discharge of water should be increased for either potential energy or kinetic energy. Translated to river properties this means either a large pressure head or large velocity.
[image:28.595.82.201.87.231.2]Of the situations that could be exemplary for the use of lock culverts, three of the larger water locks in the Netherlands using this technique are compared: the ’Sluis III’ in the Wilhelminakanaal, the ’Noordersluis’ in IJmuiden and the ’Waaiersluis’ in Gouda. These three are all situated in a channel since lock culvert discharge systems do not exist in the rivers of the Netherlands. Of these situations the first two are both under renovation. Therefore the ’Waaiersluis’ in Gouda (in the ’Hollandse IJssel’) has been chosen as test location.
4.2 Chosen locations
The chosen test locations are reviewed more fully and an overview is presented below.
Sluis Sambeek River: Meuse
This water lock complex in the river Meuse is situated below Boxmeer, near Sambeek (see Figure 14) and is in utilization since 1929. The water flow in the Meuse at this point is between 60 m3/s and 2200 m3/s, the mean head is 2.8 m (Rijkswaterstaat,
Personal Communication, June 2017).
[image:29.595.72.525.328.456.2]Figure 14: Plan of Sluis Sambeek. Reprinted from https://www.openstreetmap.org
Figure 15: Situation photo Sluis Sambeek. Reprinted from http://www.debinnenvaart.nl
The complex contains three navigation locks and a scouring sluice (see Figure 15). The scouring sluice is located on the north-east side of the river. It consists partially of a Poiree barrier, a frame with thirteen gaps in which three vertically aligned par-tition boards of 4.85 m wide and 1.56 m tall control the flow area for each gap. The other part of the scouring sluice are Stoney gates: two gates of 17 m wide in which an upward sliding lid controls the flow area (Rijkswaterstaat / Afdeling Multimedia Rijkswaterstaat, n.d.). In the south-west half of the river a navigation lock of 260 m in length by 16 m in width grants passage to larger barges and two smaller navi-gation locks of 142 m in length and 16 m in width form additional passage capacity for smaller ships. The blueprints of the situation can be found in Appendix D.1.
Waaiersluis Gouda River/canal: Hollandsche IJssel
level of 0.55 m +NAP on the east in the channel (Hoogheemraadschap De Stichtse Rijnlanden, 2017) (Rijkswaterstaat, Personal Communication, June 2017).
Figure 16: Plan of the Waaiersluis. Reprinted from https://www.openstreetmap.org
Figure 17: Situation photo Waaiersluis. Reprinted from http://rijksmonumenten.nl
5
Implementation
In the analysis of techniques, Section 3.4, a hypothesis was phrased with regard to applica-tion of conversion and storage in existing structures: ”Electrical energy can be converted and stored using hydro power and hydrogen storage in existing structures that dispense superfluous water”. This will be tested using the lock systems selected in the previous chapter. Possibilities on implementing the techniques in each system will be discussed and examples on implementation will be presented for each lock system. The possibilities will be analysed in Chapter 6.
5.1 Sluis Sambeek
Design properties of hydro power will be discussed regarding gate openings as opera-tional techniques and relative large flow and head for the Netherlands. This also means implementing part of the principle of pumped hydro storage to optimize turbine power and capacity. All properties on the current situation of Sluis Sambeek discussed below originate from Rijkswaterstaat / Afdeling Multimedia Rijkswaterstaat (n.d.) and personal communication with Rijkswaterstaat (2017) unless otherwise indicated.
Power
The first choice regarding implementation of hydro power is between a free flow turbine and a pressurized turbine or stated differently, between kinetic and potential energy. The ratio between potential and kinetic energy equals 0.051v2 =h(see Section 3.2.1). With a
mean head of 2.77m for Sluis Sambeek and an equal efficiency of both turbines a velocity of 7.38 m/s should be matched or exceeded. The velocity in the current situation when the weir is down is 1070 m3/s divided by the profile area of the complete weir at 10.8 m+NAP (see Appendix D.1 and (Rijkswaterstaat / Afdeling Multimedia Rijkswaterstaat, n.d.)) is 1201070·4.7 = 1.9 m/s, almost a factor 4 too few. Matching the potential power with kinetic power could also be accomplished by larger efficiency of the free flow turbine or larger operational time, but a factor 4 is highly unlikely to achieve.
The flow and head for which the turbine should have the highest efficiency, the design flow and head, can be calculated by optimization of h·Q·t. Q and h are related, the time t is the time the combination of Q·h is available in days over a period of 15 years (2001-2015). The design flow rate and head is calculated with the computer program Matlab, see Appendix E. The turbine will not be in use when flow rates higher than 1070 m3/s occur. At those times the weir is let down on the bottom of the river and the head
difference is 0. This is approximately 8 days per year. The design flow is 208.8 m3/s, the
design head is 2.95 m and during 159 days out of the year the turbine can produce on peak power. The potential power without energy losses is P =ρ·g·Q·h= 6.04 MW.
control the volume flow through the weir the pressure head would be close to impossible to capture in a pipe at that location. The eastern side of the river is the final possibility. By placing a pipe circumventing the Poiree valves the water can be led to a few meter downstream, where the turbine would have no hinder of the Poiree frame when putting the weir down. By installing the turbine in the side embankment of the river, it could be placed approximately 30 m downstream from the weir, which is where the reinforcements of weir end. A penstock length of 30 m is presumed. The internal penstock diameter can be estimated using Equation 14 and the minimum tickness with Equation 15 with a manning coefficient of 0.014 for an uncoated cast iron pipe (Nasir, 2014). The internal penstock diameter is 621 mm with a minimum thickness of 4 mm.
Dp = 269·
n2p·Q2·Lp
Hg
0
.1875 (14)
tp =
Dp+ 508
400 + 1.2 (15)
Where: Dp is the penstock diameter in mm.
np is the dimensionless manning coefficient
Q is the design flow rate in m3/s.
Lp is the penstock length in m.
Hg is the design head or gross head in m.
tp is the minimum penstock thickness inmm.
The head loss can than be calculated using the Darcy-Weisbach equation (Equation 16, (Brown, 2002)).
hl=fD
Lp
D · v2
2g, with Q= π 4D
2v, so h
l =fD
8L π2g ·
Q2
D5 (16)
Where: hl is the head loss in m.
fD is the Darcy friction factor of Re64
D is the penstock diameter in m.
v is the average speed in the penstock in m/s.
[image:32.595.356.526.569.716.2]g is the gravitational acceleration coefficient of 9.81 in m/s2.
Figure 18: Efficiency curve over the rated capacity (%). Reprinted from (Sangal et al., 2013, p.426).
The friction coefficient equals Re64 withRe= vlν. The kinematic viscosity ν is 1.6438 ·10−6m2/s which means that fD = 1.02·10−6 for water of
approx-imately 1°C. The head loss is then 0.35 m, resulting in a nett head of 2.95−0.35 = 2.60 m.
Knowing the nett head, the rated power can be estimated with Equation 2: η·1000·9.81·208.8·2.6 = 5.3η MW, η being the turbine efficiency. The rated capacity equals the rated power times the amount of time the turbine has the respective power output. The efficiency of a turbine is partially dependent on the percentage of design capacity that is led through the turbine and varies per turbine type, see Figure 18.
Relying on research on multi criteria analysis for turbines based on flow rate and head (Williamson,
Figure 19: Weighted scores of 13 different tur-bines over head, ’DT’= draft tube. Reprinted from (Williamson et al., 2014, p.48)
[image:33.595.304.502.223.304.2]Criterium Weight Power density 0.30 Full flow efficiency 0.25 Part head/flow efficiency 0.20 Civil works (adjustment environment) 0.15 Maintainability and servicability 0.05 Modularity 0.05
Table 4: Weighted criteria used in the multi cri-teria analysis.
is not applicable when implementing the turbine in the embankment as proposed. The weights and aspects of the analysis can be found in Table 4.
Subsequently the efficiency curve for the rated capacity calculation is modelled to match curve b of the middle curve group in Figure 18. A relation of the form η = 0.9−0.2·(Ep−1).2 for Ep>0.3 and Ep<1.3 is used. In this equation Ep is the percentage
of rated capacity of the maximum rated capacity. Calculated with Matlab (see Appendix E) resulting in a total rated capacity of 27.5 MWh per year.
For this situation, the flow rate that is directed into the turbine has to be controlled. When reaching higher values than the design flow rate, the flow rate is cut to the value of the design flow rate to optimize turbine efficiency. This means that a large part of the available flow rate is often unused (discharged through the weir), illustrated in Figure 20. Addition of another turbine would add a rated capacity of 5.25 MWh per year and addi-tion of a third turbine would add a rated capacity of 1.67 MWh per year, see Appendix E.
Figure 20: Unused flow rate over time (2001-2015).
TCO
[image:33.595.103.491.575.704.2]project cost (TCO), the power of the site and the head. The relation is based on 50 real life small hydro plants and matches the empirical data suprisingly close, illustrated in Figure 21. This relation is described by Equation 17.
Cproject = 25000·(P/H0.35)0.65 (17)
Where: Cproject is total project cost in £.
P is the power in kW H is the head in m.
For Sluis Sambeek the TCO equals 25000·(2.5438950.35)0.65 = £5.24 mln which equals e5.84
[image:34.595.186.410.242.388.2]mln.
Figure 21: Empirical relation between the total project cost, power and head of micro hydro plants.
Impact
The design of hydro power in Sluis Sambeek is matched to the actual flow rate. The discharge needed for the turbine is guided through a pipe on the eastern shore and re-turned to the river at approximately 30 m after extraction at the weir. The total water balance is therefore unaffected. The local water balance is not entirely unaffected due to the increased velocity of discharge from the turbine. This will cause erosion of the embankment at the discharge point which has to be avoided. To accomplish this a stilling chamber could be constructed at the outlet or the outlet could be made to reach further into the flow of the river. With enough space between the embankment, river bed and outlet, the impact on the local water balance will also be negligible. A stilling chamber would be less fragile to outer forces like navigation, animals or currents but would involve more costs, for an extension of the outlet vice versa.
5.2 Waaiersluis
The design properties of hydro power will be discussed regarding lock culverts as opera-tional techniques and a small flow rate and head for the Netherlands. All properties on the current situation of the Waaiersluis discussed below originate from Hoogheemraadschap De Stichtse Rijnlanden (2017) and personal communication with Rijkswaterstaat (2017) unless otherwise indicated.
Power
The available head for the Waaiersluis can be calculated by subtracting the level of the discharge point (at the middle of the diameter of the lock culverts) from the mean water level at the channel. This equals 0.55−(−0.5) = 1.05 m. The value of the flow rate of 10.1 m3/s is set and the lock culverts are approximately level with the water height in the channel. From that is deduced that the head between the channel and the discharge point is 12d = 0.3 m. The relation 0.051v2 = h between potential and kinetic energy for the Waaiersluis then equals 0.051v2 = 0.3. The minimum velocity to match the potential energy is 2.4 m/s. Discharge is currently done using the scouring lock next to the Waaiersluis. When scouring through the lock culverts of the wing doors of the Waaiersluis, the discharge velocity at 10.1 m3/s equals 10.1
π·0.62 = 8.9 m/s. This is almost
four times as high as the minimum velocity, so a flee flow turbine will be implemented. The required flow rate of 10.1 m3/s cannot constantly be discharged due to the tidal
differences at the western side of the lock. This means that the flow rate is higher at low tide and zero at high tide. For each tidal cycle of 12 hours and 25 minutes, the average discharge is 10.1 m3/s. The flow rate during low tide is subsequently 10.1·2 = 20.2 m3/s,
resulting in a velocity of 17.9 m/s. The potential power without energy losses is then P = 12ρQv2 = 3.22 MW.
The best place for a turbine is at the beginning of the lock culvert at the channel. Theoretically it could also be placed at the end of the lock culvert from the channel to the wing gate, but then the whole wing gate chamber should be redesigned increasing the installation cost sharply. Even if that would not be an issue, the cultural and architectural value of the monument prevent that possibility (Rijksdienst voor het Cultureel Erfgoed, 2000). It is also unnecessary, because whether the turbine is at the end of the pipe or at the beginning, the friction losses and subsequently power loss is equal.
The friction losses can be calculated using Equation 16, expressed in the equivalent head loss. The length of the lock culvert from the channel to the wing gate chamber is 15.898 m (see blueprint in Appendix D.2). The equivalent head loss is thenhl =fD
Lp
D· v2 2g =
4.4·10−4 m. This can be translated to velocity loss with the relation 0.051v2 =h/. The
reduction in velocity is 0.093 m/s resulting in a nett velocity of 17.8 m/s. Knowing the nett velocity the rated power can be estimated by: P = 12 ·1000·20.2·17.8·η = 3.20η MW.
Using the multi criteria analysis of Elbatran, Yaakob, Ahmed, and Shabara (see Section 5.1) the choice of turbine is set to the Archimedes screw. From Figure 18 an efficiency of 0.9 is deduced (the impulse turbine curve).
With all static conditions available the final power and capacity can be calculated: P = 12ρQv2η= 12·1000·20.2·17.82·0.9 = 2.9 MW and the capacity is P ·t= 6.3 GWh.
TCO
The economic analysis of (Aggidis et al., 2010) is also used for the situation in the Waaiersluis. The equivalent head at a velocity of 17.8 m/s is 18.7 m. The equation Cproject = 25000·(P/H0.35)0.65 then equals 25000·(2.9·10
6
e225 mln.
Impact
The impact on the global flow rate is zero. This is obligatory since the water level in the channel needs to be at a constant level of 0.55 m+NAP at all times. When deviating from this level the sweet water supply will be too low (resulting in salinization of the environment) or the water level in the surrounding polders will be too high causing agricultural water damage and damage to basements of houses and other buildings. The impact on the local flow rate is higher since the velocity is sharply increased, but since this is in a controlled environment (within the wing gate chamber) the damage to the river bed will be negligible.