Numerical analysis of spontaneous mid-infrared light emission from terbium ion doped multimode chalcogenide fibers
Slawomir Sujecki1*, Lukasz Sojka1, Elzbieta Pawlik1, Krzysztof Anders2, Ryszard Piramidowicz2, Zhuoqi Tang3, David Furniss3, Emma Barney3, Trevor Benson3 and Angela Seddon3,
1 Wroclaw University of Science and Technology, Wroclaw, Poland;
2 Warsaw University of Technology, Warsaw, Poland;
3 The University of Nottingham, Nottingham, UK;
* Correspondence: [email protected]; Tel.: +48-71-3204588
Academic Editor: name
Received: date; Accepted: date; Published: date
Abstract: In this contribution we use a numerical model to study the
photoluminescence emitted by Tb3+ doped chalcogenide-selenide glass fibers
pumped by laser light at approximately 3 m. The model consists of the set of ordinary differential equations (ODEs), which describe the spatial evolution of the pump laser and MIR photoluminescence light within the fiber. The ODEs are coupled with the rate equations that describe the energy level populations. A self-consistent solution of the equation system yields the pump light, MIR photoluminescence and level population distribution within the fiber. Using the developed model we numerically calculate results and discuss the dependence of the output photoluminescence MIR power on the fiber optical loss, fiber length and pump wavelength.
Keywords: chalcogenide glass fibers ; lanthanide doped fibers; optical fiber
modelling
1. Introduction
emission sources have been successfully implemented in chemical sensor applications [3, 6]. The key to success of this technology is the availability of lanthanide ion doped chalcogenide glass fibers with good optical properties within the mid infrared wavelength range. High quality chalcogenide fibers for mid infrared applications have been demonstrated by several laboratories independently [8-14]. Thus further stressing the potential for a commercial success of this technology. An important element of the development of MIR spontaneous emission fiber sources is modelling and design. In this contribution we derive a numerical model for the analysis of the MIR photoluminescence emitted by Tb3+ doped chalcogenide-selenide glass fibers
pumped by laser light at approximately 3 m. The modelling parameters have been extracted directly from fiber and bulk glass sample measurements, which were fabricated in house [15]. The model consists of the set of ordinary differential equations (ODEs), which describe the spatial evolution of the pump laser and MIR photoluminescence light within the fiber. The ODEs are coupled with the rate equations that describe the energy level populations. A self-consistent solution of the equation system yields the pump light, MIR photoluminescence and level population distribution within the fiber. Using the developed model we numerically calculate results and discuss the dependence of the output photoluminescence MIR power on the fiber optical loss, fiber length and pump wavelength.
2. Methods and Materials
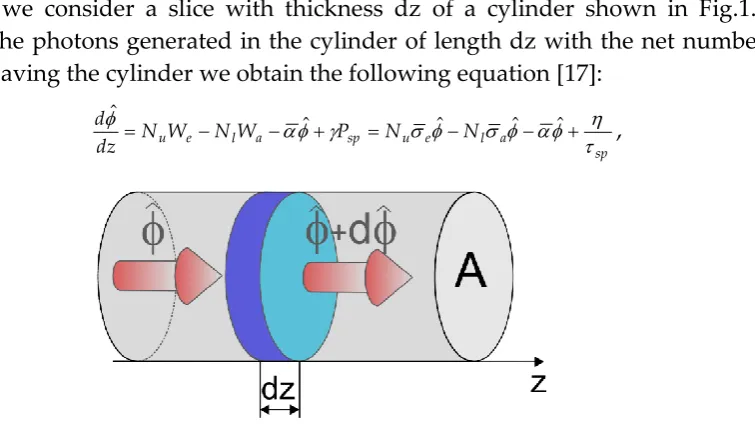
In this section we outline first the derivation of the main equations used in the next section for calculating the numerical results. This outline allows for stating all assumptions that limit the accuracy of the applied model and explain the role of the experimental measurements in obtaining the results. The methodology followed here is phenomenological, based in essence on the simplified quantum electrodynamic approach presented in [16]. We consider an optical field interacting with a two level system. Figure 1 shows a photon flux incident upon a disc of thickness dz and cross sectional surface A. As a result of stimulated emission and absorption processes and also spontaneous emission generation the flux leaving the disc is + d Following [16] we can provide the following estimates of the total stimulated emission, absorption and spontaneous emission rates generated within the disc, in the presence of broadband light, respectively:
0
df f f
We e , (1a)
0
df f f
Wa a , (1b)
sp sp
where e,a are the emission ‘e’ and absorption ‘a’ cross sections, (f) is the spectral
density of the photon density flux and sp is the photoluminescence lifetime. We recast
the equations (1a) and (1b) in the following way:
ˆ 0 0 0 e ee f f df f df f df
W
, (2a)
ˆ 0 0 0 a aa f f df f df f df
W
, (2b)
where We and Wa are the weighted values of the emission and absorption cross
section:
0 0 ,,a ea f f df f df
e
and ˆ is the photon flux density integrated over all spectral components:
0
ˆ f df
Now we consider a slice with thickness dz of a cylinder shown in Fig.1. By equating the photons generated in the cylinder of length dz with the net number of photons leaving the cylinder we obtain the following equation [17]:
sp a l e u sp a l e
uW NW P N N
N dz d
ˆ ˆ ˆ ˆ ˆ
[image:3.595.126.504.344.557.2], (3)
Figure 1. Photon flux amplification via a stimulated emission process
which describes the process of light amplification and attenuation within a longitudinally (z-axis) invariant structure, e.g. a fiber. In (3) stands for the spontaneous emission coupling coefficient, which follows from the fact that spontaneous emission couples to all modes while the photon flux density considered in (3) includes only the guided modes. Nu and Nl are the upper and lower level
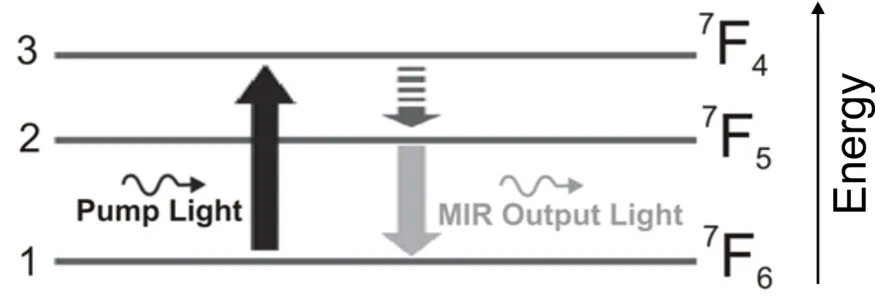
We consider selenide chalcogenide glass doped with trivalent terbium ions. Figure 2 shows the energy level diagram for terbium ions doped into a selenide chalcogenide glass. In mid infrared (MIR) applications level 3 is used for pumping. MIR light is generated through the interaction of the photon field with the electronic transition 2-1. It was shown experimentally by a number of independent research teams that for selenide-chalcogenide glass host both the transition 2-1 is radiative, unlike the transition 3-2, which is marked with a dotted line arrow in Fig.2, which is predominantly non-radiative.
Figure 2. Energy level diagram for a terbium ion doped into selenide
chalcogenide glass
Using the rate equations approach [16] the following 3 linear algebraic equations are obtained for the 3-level system shown in Fig.2:
1
21 22 23 2
31 33 3
1 1 1
* 0
0 0
N N
a a a N
a a N
, (4)
where N is the total terbium concentration and the matrix elements are:
21 21
21 22
21 21
32
23 31 31 33 31
3 32 3 32
1 1
; ;
1 1 1
; ; ;
a s e s
r nr
a p e p
r nr r nr
a a
a a a
, (5)
In equation (5) 31a and 31e are the relevant values of absorption and emission cross
sections, respectively. 32 give the value of the branching ratio for 3-2 radiative
transition. 2r and 3r are radiative lifetimes of levels 2 and 3, respectively while 3nr and
2nr give the relevant life times for phonon assisted transitions.
[image:4.595.75.517.206.354.2]with the z axis of Cartesian coordinate system the spatial evolution for the pump and signal photon flux can be written using the equation (3) and substituting consistently the relevant energy level indexes:
31 1 31 3
p
a e p p p
d
N N
dz
, (6)
21 1 21 2 2/ 2
s
a e s s s
d
N N N
dz
, (7)
where ‘+’ and ‘-‘ refer to forward and backward travelling waves, respectively while xxa,e are the relevant values of emission ‘e’ and absorption ‘a’ cross sections, x
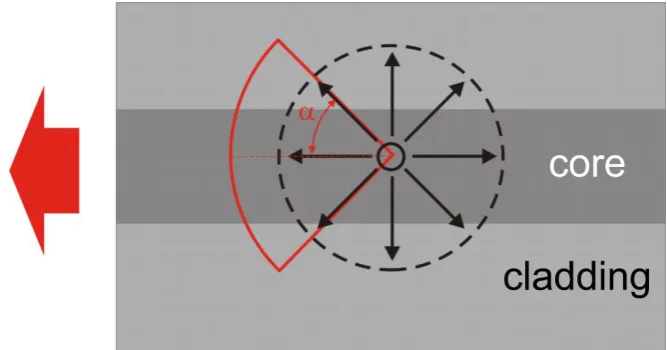
gives the attenuation coefficient, which for the signal wave is weighed with respect to the signal spectrum [4]. The weighting operation is marked with an overstrike symbol and was also applied consistently to the signal emission and absorption cross-section following formula (2). is the spontaneous emission coupling factor, which was calculated following the method outlined in [4]. The approach presented in [4] operates within the ray optics approximation paradigm, which is justified since the fiber cross sectional dimensions are much larger than the operating wavelength of the guided light. It consists in assuming that the probability distribution of emitting a photon in any direction is isotropic and only the rays that impinge upon the boundary between the core and cladding at an angle exceeding the critical one couple to the fiber (Fig.4). The pump and signal flux p and s are related to the respective power values
via: Pp = p*h*p*A and Ps =s*h*s*A where A is the fiber cross sectional area, h –
[image:5.595.75.511.467.579.2]Planck’s constant, p and s pump and signal frequency, respectively.
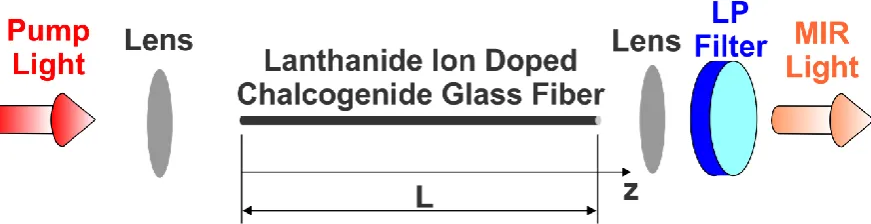
Figure 3. Schematic diagram of a chalcogenide fiber pumped at one end with
a laser diode and emitting MIR light at the other end; LP Filter – long pass filter
Figure 4. Schematic diagram illustrating the process of spontaneously emitted
light coupling into the multimode fiber.
3. Results and Discussion
The modelling parameters were extracted from experimental measurements described in [15]. As described in [15] the experimental results were collected using standard equipment for absorption and photoluminescence measurements. Emission spectra were recorded at 300 K from bulk glass and fiber samples, pumped at 2.013 μm and 1.940 μm using a monochromator, lock-in amplifier, a chopper and an MCT photodetector. The photluminescence lifetime at 4.7 μm in the Tb3+ -doped
Ge-As-Ga-Se bulk glasses was measured using the direct modulation of the pump laser and by applying a single exponential fit to the observed waveform. The absorption spectra were collected using FTIR equipment and subsequent extraction of the base line. Further, we extracted the she absorption peaks due to HSe and OH contamination to obtain the true absorption spectrum due to the lanthanide ion only. Thus obtained absorption spectrum was then used to obtain the values of the relevant lifetimes, and branching ratios for the lanthanide ion by applying the Judd-Ofelt theory. In particular , using this method we obtained the lifetimes 3 and 2 and the branching ratio 32¬
needed for performing the calculations. The refractive index was measured using the Swanepoel method whilst the multiphonon transition lifetimes were extracted from the experimental data by making a least squares fit under an assumption that the maximum intrinsic phonon energy of Tb3+ -doped Ge-As-Ga-Se is ~ 300 cm-1.The Tb3+
ions concentration is 0.95x1025/m3. The attenuation coefficient, unless otherwise stated,
at the pump wavelength is 2 m-1, and the weighted attenuation coefficient for the signal
wave is 2.7 m-1. The weighted signal emission and absorption cross sections are 6.3 x
10-25 m2 and 6.7 x 10⁻²⁵ m2, respectively. The reflectivity at the fiber end for chalcogenide
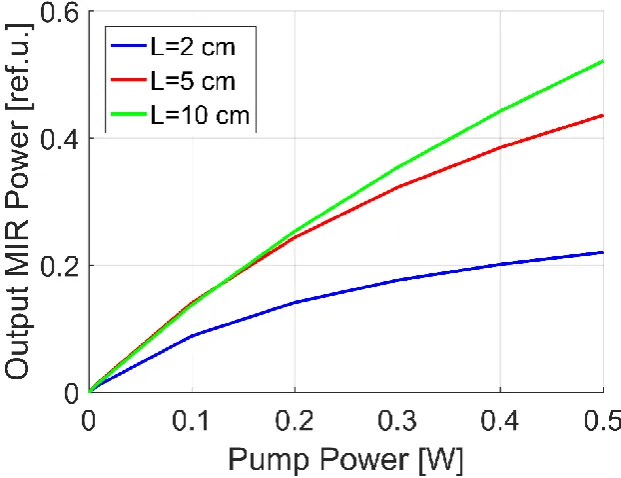
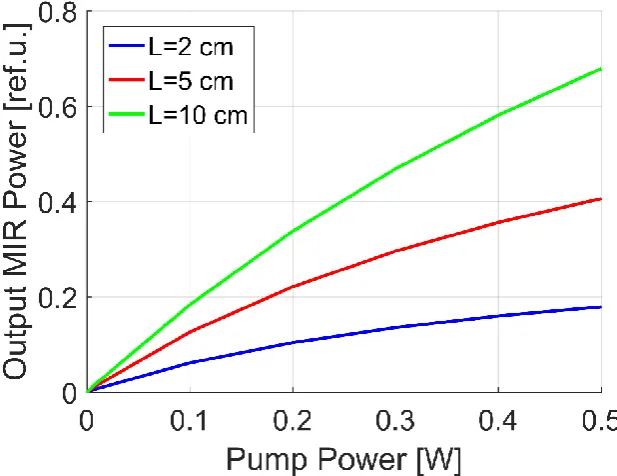
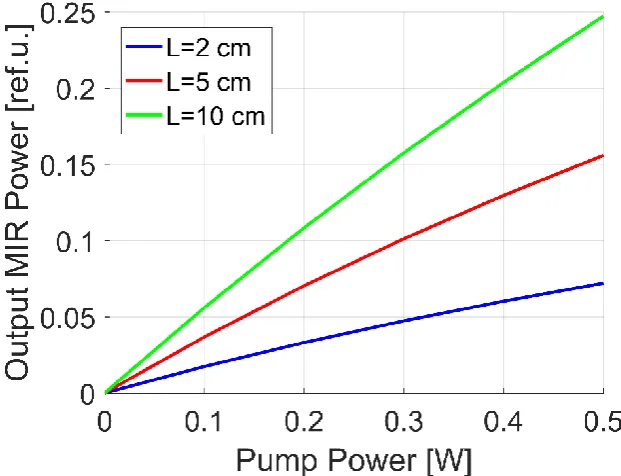
The fiber was unstructured, of 200 m outside diameter. Unless otherwise stated, the pump wavelength is 2.95 m, which approximately corresponds to maximum value of the absorption cross section. Figs.5-8 show the dependence of the output MIR power on the pump power for selected values of fiber length and several values of the fiber attenuation at the MIR and pump wavelength. The MIR output power is integrated over all spectral components consistently with formulae (2). The values of the pump power have been limited to values, which have been shown feasible experimentally in our lab. Output MIR power is normalized with respect to output MIR power obtained at 500 mW of pump power for the 10 cm fiber (c.f. green line in Fig.5) to make easier the comparison of results obtained with different set of parameters. At low values of fiber loss the benefit of using longer fibers is evident. However, when the loss is large using longer fibers may turn counterproductive as observed especially in Fig.8. The results shown in Fig.6 and Fig.7 indicate that with a sufficiently large pump power larger MIR output power is eventually obtained. However, in practice such high values of pump power might not be feasible due to possible fiber damage.
Figs.9 and 10 show the dependence of the output MIR power on the pump power for selected values of fiber length and two selected values of the pump wavelength. As expected the output power is significantly reduced when the pump is detuned from the wavelength corresponding to maximum of the absorption cross section. Thus stressing the importance of selecting precisely the pumping wavelength so that it matches the wavelength corresponding to the maximum value of the absorption cross section.
Figure 5. Calculated dependence of MIR output power on pump power at
Figure 6. Calculated dependence of MIR output power on pump power at
selected values of fiber length for signal and pump attenuation respectively of 27/m and 2/m. The pump wavelength is 2950 nm.
Figure 7. Calculated dependence of MIR output power on pump power at
[image:8.595.122.433.84.323.2] [image:8.595.121.432.409.648.2]Figure 8. Calculated dependence of MIR output power on pump power at
selected values of fiber length for signal and pump attenuation respectively of: 27/m and 20/m. The pump wavelength is 2950 nm.
Figure 9. Calculated dependence of MIR output power on pump power at
[image:9.595.121.432.84.322.2] [image:9.595.122.431.409.647.2]Figure 10. Calculated dependence of MIR output power on pump power at
selected values of fibre length at pump wavelength of 2750 nm.
4. Conclusions
In summary we observe that at moderate values of the fiber loss longer fibers allow achieving higher output powers. When fiber loss is large using long fibers may turn out counterproductive whilst trying to maximize the output power. However, the reduction of output power for fibers with large losses may be overcome by applying a stronger pump. We note though that the effectiveness of such solution is subject to not exceeding the maximum light intensity at a given wavelength since too large pump powers may result in a fiber damage. Finally, our results show that in order to achieve the maximum output power the pump wavelength should match the wavelength of the absorption cross section maximum.
Acknowledgments: This Project has received funding from the European Union’s
Horizon 2020 research and innovation programme under the Marie Skłodowska-Curie grant agreement No. 665778 (National Science Centre, Poland, Polonez Fellowship 2016/21/P/ST7/03666).
References
Using Fourier transform IR spectroscopy to analyze biological materials, Nature Protocols, 9 (2014) 1771-1791.
[2] M. Kokalj, K. Stih, S. Kreft, Herbal Tea Identification Using Mid-Infrared Spectroscopy, Planta Medica, 80 (2014) 1023-1028.
[3] F. Starecki, S. Morais, R. Chahal, C. Boussard-Pledel, B. Bureau, F. Palencia, C. Lecoutre, Y. Garrabos, S. Marre, V. Nazabal, IR emitting Dy3+ doped chalcogenide fibers for in situ CO2 monitoring in high pressure microsystems, International Journal of Greenhouse Gas Control, 55 (2016) 36-41.
[4] A.L. Pele, A. Braud, J.L. Doualan, F. Starecki, V. Nazabal, R. Chahal, C. Boussard-Pledel, B. Bureau, R. Moncorge, P. Camy, Dy3+ doped GeGaSbS fluorescent fiber at 4.4 mu m for optical gas sensing: Comparison of simulation and experiment, Optical Materials, 61 (2016) 37-44.
[5] A.L. Pele, A. Braud, J.L. Doualan, R. Chahal, V. Nazabal, C. Boussard-Pledel, B. Bureau, R. Moncorge, P. Camy, Wavelength conversion in Er3+ doped chalcogenide fibers for optical gas sensors, Optics Express, 23 (2015) 4163-4172.
[6] F. Starecki, F. Charpentier, J.L. Doualan, L. Quetel, K. Michel, R. Chahal, J. Troles, B. Bureau, A. Braud, P. Camy, V. Moizan, V. Nazabal, Mid-IR optical sensor for CO2 detection based on fluorescence absorbance of Dy3+:Ga5Ge20Sb10S65 fibers, Sensors and Actuators B-Chemical, 207 (2015) 518-525.
[7] M.C. Falconi, G. Palma, F. Starecki, V. Nazabal, J. Troles, J.L. Adam, S. Taccheo, M. Ferrari, F. Prudenzano, Dysprosium-Doped Chalcogenide Master Oscillator Power Amplifier (MOPA) for Mid-IR Emission, Journal of Lightwave Technology, 35 (2017) 265-273.
[8] G.E. Snopatin, M.F. Churbanov, A.A. Pushkin, V.V. Gerasimenko, E.M. Dianov, V.G. Plotnichenko, High purity arsenic-sulfide glasses and fibers with minimum attenuation of 12 dB/km, Optoelectronics and Advanced Materials-Rapid Communications, 3 (2009) 669-671. [9] Z.Q. Tang, V.S. Shiryaev, D. Furniss, L. Sojka, S. Sujecki, T.M. Benson, A.B. Seddon, M.F. Churbanov, Low loss Ge-As-Se chalcogenide glass fiber, fabricated using extruded preform, for mid-infrared photonics, Optical Materials Express, 5 (2015) 1722-1737.
[10] M. El-Amraoui, G. Gadret, J.C. Jules, J. Fatome, C. Fortier, F. Desevedavy, I. Skripatchev, Y. Messaddeq, J. Troles, L. Brilland, W. Gao, T. Suzuki, Y. Ohishi, F. Smektala, Microstructured chalcogenide optical fibers from As2S3 glass: towards new IR broadband sources, Optics Express, 18 (2010) 26655-26665.
[11] M. Bernier, M. El-Amraoui, J.F. Couillard, Y. Messaddeq, R. Vallee, Writing of Bragg gratings through the polymer jacket of low-loss As2S3 fibers using femtosecond pulses at 800 nm, Optics Letters, 37 (2012) 3900-3902.
[12] M.F. Churbanov, I.V. Scripachev, V.S. Shiryaev, V.G. Plotnichenko, S.V. Smetanin, E.B. Kryukova, Y.N. Pyrkov, B.I. Galagan, Chalcogenide glasses doped with Tb, Dy and Pr ions, Journal of Non-Crystalline Solids, 326 (2003) 301-305.
[13] V.Q. Nguyen, J.S. Sanghera, P. Pureza, F.H. Kung, I.D. Aggarwal, Fabrication of arsenic selenide optical fiber with low hydrogen impurities, Journal of the American Ceramic Society, 85 (2002) 2849-2851.
[14] L. Sojka, Z. Tang, D. Furniss, H. Sakr, A. Oladeji, E. Beres-Pawlik, H. Dantanarayana, E. Faber, A.B. Seddon, T.M. Benson, S. Sujecki, Broadband, mid-infrared emission from Pr(3+) doped GeAsGaSe chalcogenide fiber, optically clad, Optical Materials, 36 (2014) 1076-1082. [15] L. Sojka, Z. Tang, D. Furniss, H. Sakr, Y. Fang, E. Beres-Pawlik, T.M. Benson, A.B. Seddon, S. Sujecki, Mid-infrared emission in Tb3+-doped selenide glass fiber, Journal of the Optical Society of America B-Optical Physics, 34 (2017) A70-A79.
[16] B.E.A. Saleh, M.C. Teich, Fundamentals of Photonics, Johm Wiley and Sons Inc., New York, 1991.
[18] S. Sujecki, L. Sojka, E. Beres-Pawlik, Z. Tang, D. Furniss, A.B. Seddon, T.M. Benson, Modelling of a simple Dy3+ doped chalcogenide glass fibre laser for mid-infrared light generation, Optical and Quantum Electronics, 42 (2010) 69-79.