Crude oil price: demand, supply,
economic activity, economic
policy uncertainty and wars –
from the perspective of
Structural Equation Modelling
Qingfeng Wanga , Xu Sunb
a. Nottingham University Business School China, University of Nottingham, Ningbo, Chinab b. Department of Mechanical,
Materials and Manufacturing Engineering, University of Nottingham, Ningbo, China
Abstract
We studied the relationship between the change in the price of oil and some of its determinants, using the structural equation model. The demand for oil is confirmed to be inelastic to the change in oil price during our sampling period. Economic activity is found to be the most significant factor in explaining the dynamics of oil price. Wars and political tension, among the largest oil producing countries and neighbouring countries, are found to have a significant indirect effect on the price of oil through their effect on oil supply, but no significant direct effect was confirmed by the SEM.
Keywords: crude oil, wars, economic policy uncertainty, Killian economic index, structural equation modelling
1. Introduction
The price of oil can be determined by many factors in addition to(?) the demand and supply of oil, such as the global
2009) and have made the demand for oil even more inelastic.
2. The empirical model
2.1 Data
In this study, we use both the West Texas Intermediate (WTI) crude oil price in Chicago and the Brent Europe crude oil price to measure the price of oil. Commonly, in previous empirical studies, only one of the two crude oil prices has been used to measure the price of oil. The differences between the two prices range from 0.01 to 27.31 dollars per barrel during our sampling period, hence the use of the two crude oil prices may capture different aspects of the dynamics of the price of oil. Data for the two crude oil prices are taken from the Federal Reserve Bank of St. Louis. As the price of oil data is a nonstationary, based on the Dick Fuller test, we have used the change in the price of oil as our dependent variable for this study.
We measure economic policy uncertainty using the economic policy uncertainty (EPU) index recently developed by Baker et al. (2013). This measure is a news-based measure of economic policy uncertainty. We measure global economic activity using the US equity market uncertainty index, also developed by Baker et al. (2013), the FTSE 100, the Shanghai Stock Exchange (SSE) Composite Index, as well as the Killian Economic Index. The US equity market uncertainty index is constructed through an analysis of news articles containing terms related to equity market uncertainty, which aims to measure equity market-related economic uncertainty. The Killian Economic Index is a monthly data measure of global economic activity; the data has been taken from Killian’s official website. Monthly data for both the FTSE 100 and the SSE Composite Index have been extracted from Yahoo Finance. The global demand for
crude oil is measured by the monthly oil consumption in China, India, Germany, Japan and the US, as identified in the factor analysis among the countries with the highest levels of oil consumption. The global supply of crude oil is measured by the monthly oil supply from Algeria, Iran, Nigeria, Kuwait, Saudi Arabia, Russia, Venezuela and the United Arab Emirates, as identified in the factor analysis among the countries with the largest oil supply. Both data for oil demand and oil supply are taken from the US Energy Information Administration. Wars and political tension are measured by the interstate, societal, and communal warfare magnitude scores1 which are taken from the Centre for Systemic Peace.
Hamilton (2013) classifies 1973 to 1996 as “the age of OPEC” and 1997 to the present as “a new industrial age.” Our sample begins in Jan 1997 coinciding with this “new industrial age” but it was limited by the availability of some of our data series. All data series are at monthly frequencies except the data for wars (and political tension) which is annual data2. All data have been normalized; that is we have divided the data for each factor by the highest value from that factor. For example, every single piece of oil consumption data from the US is divided by the highest monthly quantity consumed during the sampling period for the US There are at least two advantages of implementing this normalization. Firstly,
1Magnitude scores are with scale from 1 to 10: 1
(lowest) to 10 (highest) and 0 denotes no episodes of political violence.
2Annual frequency data on magnitude score is
the normalized dataset inherits exactly same pattern of the original data.
Secondly, we can compare the magnitudes of effects made by different variables on the price of oil as all data have been scaled to the same interval of (0, 1].
2.2Factor analysis
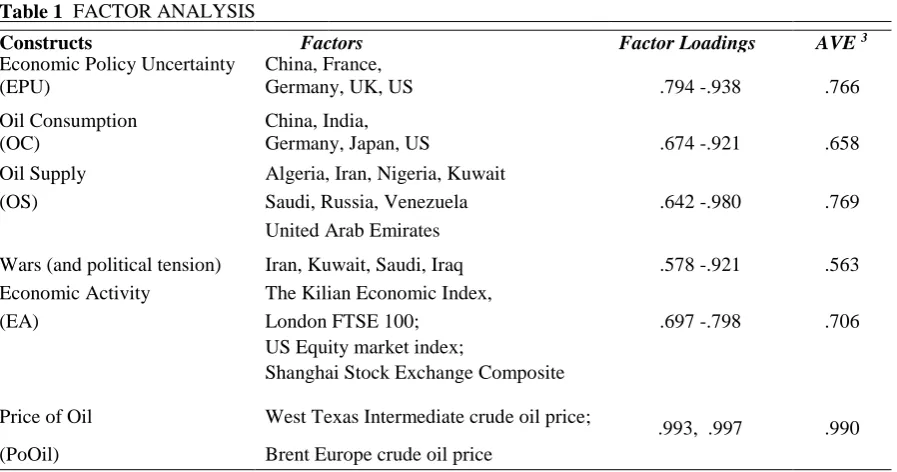
[image:3.595.76.525.112.348.2]Factor analysis with varimax rotation is used to confirm the factors to be used to measure each construct. Only factors with a factor loading >0.5 are used to measure their corresponding construct. The average variance extracted (AVE) of each construct was used to confirm the measurement model. Convergent validity is achieved if the AVE for each construct is greater than 0.50 (Fornell and Larcker 1981). The AVE for each of the constructs is well above 0.50 and, therefore, convergent validity is supported. Those factors which have been selected to measure each construct are presented in Table 1.
2.3 Structural equation modelling
In structural equation modelling, multiple factors are used to measure each latent construct. For example, economic policy
uncertainty at a global level can be difficult to measure and is prone to error if
measured directly, but it can be measured more accurately by using country level data from countries which have been confirmed to be significant in measuring the overall economic policy uncertainty based on the factor analysis. A sample size of approximately 200 cases (cf. Hoogland and Boomsma 1997) is needed to provide a reasonably good estimate of parameters in the SEM
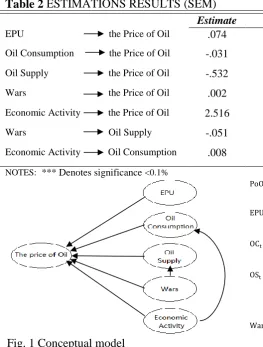
. The sample size of our dataset is equal to 191 as the price of oil in 1997:1 is used to compute the first change in the price of oil. Based on the previous studies mentioned in the introduction section, our conceptual model is depicted in Fig. 1.
3AVE was calculated based on the formula given by
Fornell and Larcker(1981), AVE =∑𝑛𝑖=1𝜆𝑖2
𝑛 where λ is the factor loading, and n is the number of factors.
Table 1 FACTOR ANALYSIS
Constructs Factors Factor Loadings
AVE 3
Economic Policy Uncertainty China, France,
(EPU) Germany, UK, US .794 -.938 .766
Oil Consumption
China, India,
(OC) Germany, Japan, US .674 -.921 .658
Oil Supply
Algeria, Iran, Nigeria, Kuwait
(OS) Saudi, Russia, Venezuela .642 -.980 .769
United Arab Emirates
Wars (and political tension) Iran, Kuwait, Saudi, Iraq .578 -.921 .563
Economic Activity The Kilian Economic Index,
(EA) London FTSE 100; .697 -.798 .706
US Equity market index;
Shanghai Stock Exchange Composite
Index
Price of Oil West Texas Intermediate crude oil price;
.993, .997 .990
Fig. 1 Conceptual model
With SEM, we are able to examine the direct effect of the demand for oil, the supply of oil, and wars, economic activity and economic policies on the price of oil at an aggregate level, utilizing a measurement model that measures each construct with several factors (i.e., a time series of(?) data from several countries), and then structure a model that estimates simultaneously the parameters of interest. Estimated parameters in the SEM minimize the difference between the estimated covariance matrices of the best fitting model and the actual covariance matrices representing the relationships between variables. The structural equations for this model are
PoOilt= 𝜔1∗ 𝑊𝑇𝐼𝑜𝑖𝑙𝑡+ 𝜔2∗ 𝐵𝑅𝐸𝑁𝑇𝐸𝑈𝑅𝑂𝑃𝐸𝑜𝑖𝑙𝑡+ 𝜁7,
PoOilt= 𝛼1∗ 𝐸𝑃𝑈𝑡+ 𝛼2∗ 𝑂𝐶𝑡+ 𝛼3∗ 𝑂𝑆𝑡+ 𝛼4∗ 𝑊𝑎𝑟𝑠𝑡+ 𝛼5 ∗ 𝐸𝐴𝑡+ 𝜁1
EPUt= 𝛾1∗ 𝐶𝑁𝐸𝑃𝑈𝑡+ 𝛾2∗ 𝐹𝑅𝐸𝑃𝑈𝑡+ 𝛾3∗ 𝐺𝐸𝐸𝑃𝑈𝑡+ 𝛾4
∗ 𝑈𝐾𝐸𝑃𝑈𝑡 + 𝛾5∗ 𝑈𝑆𝐸𝑃𝑈𝑡+ 𝜁2
OCt= 𝛾1∗ 𝐶𝑁𝑂𝐶𝑡+ 𝛾2∗ 𝐼𝑁𝐷𝑂𝐶𝑡+ 𝛾3∗ 𝐺𝐸𝐸𝑃𝑈𝑡+ 𝛾4∗ 𝑈𝐾𝑂𝐶𝑡 + 𝛾5∗ 𝑈𝑆𝑂𝐶𝑡+ 𝛾6∗ 𝐸𝐴𝑡+ 𝜁3
OSt= β1∗ 𝐴𝐿𝐺𝑂𝑆𝑡 + 𝛽2∗ 𝐼𝑅𝐴𝑂𝑆𝑡+ 𝛽3∗ 𝑁𝐼𝐺𝑂𝑆𝑡+ 𝛽4
∗ 𝐾𝑈𝑊𝑂𝑆𝑡+ 𝛽5∗ 𝑆𝐴𝑈𝑂𝑆𝑡+ 𝛽6∗ 𝑅𝑈𝑆𝑂𝑆𝑡
+ 𝛽7∗ 𝑉𝐸𝑁𝑂𝑆𝑡+ 𝛽8∗ 𝑈𝐴𝐸𝑂𝑆𝑡+ 𝛽9 ∗ 𝑊𝑎𝑟𝑠 + 𝜁4
Warst= 𝜆1∗ IRAWarst+ 𝛾2∗ 𝐾𝑈𝑊𝑊𝑎𝑟𝑠𝑡+ 𝛾3∗ 𝑆𝐴𝑈𝑊𝑎𝑟𝑠𝑡+ 𝛾4
∗ 𝐼𝑅𝑄𝑊𝑎𝑟𝑠𝑡+ 𝜁5
EAt= 𝜐1∗ 𝐾𝑖𝑙𝑖𝑎𝑛𝑡+ 𝜐2∗ 𝐹𝑇𝑆𝐸𝑡+ 𝜐3∗ 𝑈𝑆𝐸𝑞𝐼𝑛𝑑𝑥𝑡+ 𝜐4 ∗ 𝑆𝐻𝑆𝐸𝐶𝐼𝑛𝑑𝑒𝑥𝑡+ 𝜁6
where, for example, CN is the abbreviation for China, FR is for France.
The estimation results are presented in Table 2. Our principle results show that economic activity, measured by the Killian economic index and equity market indices4, had the largest positive and significant effect on the price of oil. Boosts in economic growth and positive economic outlooks contribute to higher oil prices, while sluggish economic growth and negative economic outlooks put pressure on the price of oil. Oil supply has been identified as the second most influential factor in explaining the changes in the
4The equity (stock) markets have traditionally been
viewed as an indicator of the performance of economies. Table 2 ESTIMATIONS RESULTS (SEM)
Estimate S.E. C.R. P-value
EPU the Price of Oil .074 .042 1.767 .077
Oil Consumption the Price of Oil -.031 .633 .049 .961
Oil Supply the Price of Oil -.532 .073 -7.248 ***
Wars the Price of Oil .002 .001 1.131 .258
Economic Activity the Price of Oil 2.516 .789 3.190 ***
Wars Oil Supply -.051 .007 7.136 ***
Economic Activity Oil Consumption .008 .193 .042 .966
NOTES: *** Denotes significance <0.1%
price of oil, next to economic activity. For example, a 1% increase in the global supply of oil could lead to a decrease in the price of oil of approximately 5.3%. Economic policy uncertainty is only found to have some mild explanatory power on the change in the price of oil. Wars is not confirmed to have a direct effect on the price of oil during the sampling time periods, but is confirmed to have a highly significantly negative direct effect on the oil supply. Wars (and political tension) can affect the price of oil indirectly through their effects on the supply of oil. Oil consumption is found to be insignificant in explaining the dynamics of the price of oil during the sampled time periods, which is probably due to the fact that the demand for oil is strongly price inelastic during these time periods (Cooper 2003).
3. Conclusion
Crude oil is considered to be strategically important to the global economic system (Hamilton 1983). Most previous research on the study of the price of oil has used either GARCH, initially proposed in Bollerslev (1986), or the VAR model (cf. Park and Ratti 2008; Cunado and Perez de Gracia 2013), which was initially proposed by Sims (1980). We believe there is merit in using SEM in the study of the relationship between the price of oil and its determinants, as well as other economic and social science research. The use of SEM can raise the explanatory power of our regression on explaining changes in the price of oil and, at the same time, can avoid potential multicollinearity when all variables are simultaneously included in a regression directly. It can be difficult to measure the effects of oil consumption on the price of oil at the aggregate level by using the GARCH and VAR models, but this can be done easily by using the measurement model in SEM. In determining the effect of oil consumption on the price of oil, one may simply add together the oil consumption of large oil
importing countries to measure the aggregate oil consumption at a global level. This method may have ignored the valuable idiosyncratic patterns of the oil consumption observed in these countries, while SEM can both measure the aggregate oil consumption and distinguish the importance of the oil consumption in different countries in determining the price of oil, as different weights are assigned to the oil consumption in different countries in the measuring of the aggregate oil consumption at a global level. Furthermore, our findings suggest that the effect of wars on the price of oil between Feb 1997 and Dec 2012 is mainly through their impact on the supply of oil. This indirect effect can also be difficult to identify with the GARCH and VAR models, but is feasible with SEM.
[1] Cooper JCB. Price elasticity of demand for crude oil: estimates for 23 countries. OPEC Rev 2003;27(1):1e8.
[2] Lieber RJ. Oil and power after the Gulf war. Int Secur 1992;17(1):155e76. [3] Yergin D. The prize: the epic quest for oil,
money and power. London: Simon & Schuster; 2012.
[4] Tignor R, Adelman J, Brown P, Elman B, Kotkin S, Prakash G, et al. Worlds together, worlds apart: a history of the world:
from 1000 CE to the present.
fourth ed. W. W. Norton & Company; 2013. [5] Kilian L. Oil price volatility: origins and
effects. Staff working paper ERSD- 2010-02. Background Paper Prepared for the
WTO's World Trade Report 2010. 2010.
[6] Kilian L. Not all oil price shocks are alike: disentangling demand and supply
shocks in the crude oil market. Am Econ Rev 2009;99(3):1053e69.
[7] Hamilton JD. Historical oil shocks. In: Parker RE, Whaples RM, editors. The routledge handbook of major events in
economic history. New York: Rout- ledge Taylor and Francis Group; 2013. p.
239e65.
Horsnell P, van der Linde C, et al. The first oil war: implications of the Gulf crisis in
the oil market. 1990. https://
www.oxfordenergy.org/wpcms/wp-content/uploads/2010/11/SP1-
TheFirstOil-arImplicationsoftheGulfCrisisintheOilMa rket-LArcheretal-1990.
pdf (Accessed on 08 May 2017).
[10] Rahman S, Serletis A. The asymmetric effects of oil price shocks. Macroecon Dyn 2011;15(S3):437e71.
[11] Hamilton JD. Oil and the macroeconomy since world war II. J Political Econ 1983;91(2):228e48.
[12] Bernanke BS. Irreversibility, uncertainty and cyclical investment. Q J Econ
1983;98(1):85e106.
[13] Gelb AH. Oil windfalls: blessing or curse?. Oxford University Press; 1988. [14] Saporta V, Trott M, Tudela M. What can
be said about the rise and fall in oil prices? Bank Engl Q Bull 2009;49(3):215e25. [15] Bollerslev T. Generalized-autoregressive
conditional heteroscedasticity. J Econ 1986;31:307e26.
[16] Park J, Ratti RA. Oil price shocks and stock markets in the US and 13 European countries. Energy Econ 2008;30:2587e608. [17] Cunado J, Perez de Gracia F. Oil price
shocks and stock market returns: evi- dence for some European countries. Energy
Econ 2013;42:365e77.
[18] Sims CA. Macroeconomics and reality. Econometrica 1980;48:1
e48.
[19] Kilian L. Oil price volatility: origins and effects. WTO Staff Working Paper, No. ERSD-2010-02. 2010.
[20] Wright S. The relative importance of heredity 2nd environment in deter- mining the piebald pattern of Guinea-pigs.
Proc Nation Acad Sci 1920;6: 320e32.
[21] Niles HE. Correlation, causation and Wright's theory of “path coefficients”. Genetics 1922;7:258e73.
[22] Pearl J. Causality: models, reasoning, and inference. Cambridge University
Press; 2000.
[23] Wright S. The theory of path coefficients: a reply to Niles' criticism. Genetics 1923;8:239e55.
[24] Wang QF, Sun X, Cobb S, Lawson G, Sharples S. 3D printing system: an
innovation for small-scale manufacturing in home settings? e Early adopters
of 3D printing systems in China. Int J Prod Res 2016;54(20):6017e32.
[25] Wang QF, Sun X. Investigating gameplay intention of the elderly using an
extended technology acceptance model