Modelling and optimisation of sound absorption in replicated
microcellular metals
Otaru, A.Ja., Morvan, H.Pa, Kennedy, A.R b*
aGas Turbine & Transmissions Research Centre, Faculty of Engineering, University of
Nottingham, NG7 2RD, UK
b* Engineering Department, Lancaster University, Lancaster, LA1 4YW
Abstract
Wilson’s poroacoustic model has been shown to be an accurate predictor of sound absorption
in porous metals with bottleneck type structures. When used to optimise pore structures, using
porosity and permeability as variables, the most broadband absorption is predicted for the
highest porosity achievable (approximately 70%) and for a permeability of the order 10-10 m2.
Although performance close to that for glass wool is not possible, with these porosities, specific
strength and stiffness exceeding those for many polymers is obtained, making these materials
viable for load bearing components with credible soundproofing.
Keywords:
Porous material; simulation; modelling, acoustic, permeability
Noise reduction is of importance for both safety and comfort, across a wide range of industries
and is often tackled by using porous in-fill layers of materials, such as foams or wadding, to
dissipate sound energy. Open celled metal foams (or more correctly, porous metals) are
capable of absorbing sound, but also offer multi-functional performance (e.g. high specific
stiffness, good energy absorption and fire resistance) in a self-supporting 3-dimensional form.
This uniqueness makes porous metals suitable for a wide range of applications for noise
control, where they are candidates to replace complex multi-component structures.
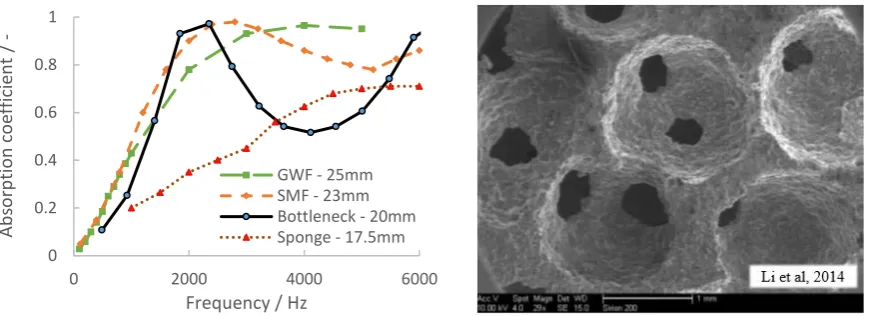
Figure 1 compares the normal incidence absorption coefficient (the fraction of energy from the
bottleneck [1] and sponge-type [2] porous metals and compares this with non-structural glass
wool (GWF [3]) and sintered metal fibre (SMF [4]) materials. Although this property is
dependent upon thickness, and the samples presented range in thickness from roughly 17-25
mm, the figure shows that sound absorption in porous metal structures does not compare
favourably with those for established soundproofing materials. Of those presented, absorption
is best in porous metals with medium levels of porosity (60-65%) that have so-called
“bottleneck” structures, where pores are connected to their neighbours via narrow pore openings or “windows” [1]. The typical structure of such a porous material (also from [1]) is
shown in Figure 1. These materials, made by the creation of porosity through pressure-assisted
infiltration of a packed bed of a sacrificial “space holder” or “porogen” such as salt, have
well-documented relationships between pore and window size and the number of windows per pore
[5]. Good sound absorption in these types of structures is attributed to effective energy
dissipation via friction with the pore surface, as the air increases in velocity when it travels
from the large pores through the much smaller pore openings [6]. With lower porosities than
typical porous metals, these porous materials have credible structural performance, particularly
if “hard-backed” with an Al sheet on the external surface.
[image:2.595.86.521.425.583.2]
Figure 1 Plots (left) of normal incidence absorption coefficient (Ac) against frequency for
hard-backed porous materials [1-4] and (right) an example of porous Al with a bottleneck
type structure [1].
The potential to narrow the performance gap between current soundproofing materials and
novel, self-supporting sound absorbing structures can be determined through optimisation of
the structure of the porous body and its geometry. With numerous combinations of porosity,
pore size, window size and absorber thickness being possible, a simulation-based approach
0 0.2 0.4 0.6 0.8 1
0 2000 4000 6000
Ab
so
rp
tio
n
co
ef
fici
en
t
/
-Frequency / Hz
provides the most convenient route to determining the capacity for these materials to absorb
sound.
Whilst modelling of sound absorption in more traditional porous structures, and even porous
metals, is commonplace, there has been rather limited effort to model sound absorption in
bottleneck type structures. It is generally considered, though seldom demonstrated, that
established models, such as those by Delaney–Bazley [7], Johnson, Champoux and Allard [8]
and Wilson [9] are inappropriate for these types of structures, since these models mostly deal
with porous materials where the pores do not abruptly change in cross section. In response to
this, Lu et al [10], developed an analytical model to describe sound absorption in semi-open
cellular (bottleneck) structures, finding (as did [6,11,12] who compared this model to their
experimental measurements for sound absorption in porous metals with bottleneck structures)
reasonably good agreement between predictions and experimental measurements, especially at
lower frequencies. This model was then used to study the individual effects of porosity, pore
size and window size, finding absorption behaviour improving initially as the pore size and
window size were decreased (with little influence of porosity), but that with further decreases,
the foam became a poorer absorber [10].
Software such as Comsol Multiphysics 5.2TM, enables the extension of simple sound absorption
modelling to complex 3D structures and non-incident sound wave scenarios, yielding accurate
absorption predictions for conventional soundproofing materials. The empirical poroacoustic
models of Delany-Bazley-Mikki (DBM), Johnson-Champoux-Allard (JCA) and Wilson (W)
are embedded within this software. Despite their questioned applicability for bottleneck
structures, they are convenient to use. In addition to inputs for the properties of the fluid, values
for parameters such as the permeability, tortuosity, thermal and viscous length are required,
which can be determined from directly measurable structural parameters such as the porosity,
pore size and window size (for greater detail of the context of these parameters refer to [13]).
Figure 2 plots simulations for sound absorption coefficient against frequency, using a model
of a 20 mm thick, hard-backed porous structure within a two-dimensional representation of a
standing wave tube (the 2D solution varying insignificantly from the 3D) for key poroacoustic
models within Comsol Multiphysics 5.2 TM software. Simulations were performed using only
the data given in [1,6,10] for porosity, pore size and window size, in combination with
equations 1 and 2) and thermal and viscous length [17] for porous materials with bottleneck
type structures. The permeability for bottleneck structures was developed from models in [14,
15] by expanding the coordination number, Nc, in terms of key structural parameters (shown
in equation 2). This was performed by fitting Nc to measurements and modelling in [5], and
fitting the permeability through correlation with CFD simulations presented in [18], for the
case where the ratio of the window to pore size is in the range of 0.15 to 0.4. The viscous and
thermal lengths were approximated to half the window diameter and half the pore diameter
respectively [17].
𝜏 = 2 + 2 cos [4𝜋3 + 13cos−1(2∅ − 1)] 1
𝑘
0=
1.03 𝑁𝑐 ∅ 𝑟𝑤36𝜋 𝑟𝑝 where 𝑁𝑐 = 17 ∅ (
𝑟𝑤 𝑟𝑝)
0.27
2
It can be seen that both the DBM (best suited to fibre structures such as glass wool) and the
JCA model fail to describe the sound absorption accurately over any portion of the frequency
range for the data in [1]. Despite the reported shortcomings, the Wilson model predicts the
sound absorption response very accurately for both this sample, those in [1,6] for different pore
and window sizes and for samples with different morphologies in [10] (also shown in Figure
2), matching more closely than the model presented therein. The reason for this close fitting
is not discussed in detail in this brief paper, but similarities in the model developed and the
Wilson model are noted in [10] for structures and frequencies explored in this study.
0 0.2 0.4 0.6 0.8 1
0 2000 4000 6000
Abs orp tion coe ff ic ie n t /
-Frequency / Hz
DBM JCA Wilson Li et al
0.0 0.2 0.4 0.6 0.8 1.0
0 500 1000 1500 2000
A b so rp tio n co ef ficien t /
-Frequency / Hz
Figure 2. Plots of measured and modelled normal incidence absorption coefficient against
frequency for hard-backed 20 mm thick structures (left) for [1] compared with several models
and (right) for [10] compared with the Wilson model [9].
With confidence in the Wilson model, optimisation of the acoustic response, to achieve
performance more like glass wool, was performed, within the realistic constraints of the
materials being modelled and the applicability of the structural models being used. Simulation
using the Wilson model only requires specification of the porosity and the permeability to
determine the structural parameters needed. Since these porous structures (and the models to
describe the permeability) are derived from packed beds of spherical beads, realistic lower and
upper limits to the porosity are 0.55 and 0.68 [5]. The realistic permeability range (considering
the range in porosity, pore and window size) is much broader, from approximately 10-12 to 10
-7m2.
Figure 3 shows results for 30+ simulations, plotting the noise reduction coefficient (NRC, the
arithmetic mean of the sound absorption coefficient at frequencies of 250, 500, 1000 and 2000
Hz) and the peak absorption coefficient (Ac max) for a comprehensive array of combinations
of permeability, for 20 mm thick samples, across the whole interval of porosities. Ac max and
NRC values derived from experimental data from [1,6] are also plotted (as triangles) which
overlie the simulation data. Whilst not all the data fall on single curves for each property, there
are clear maxima, indicating improved sound absorption in the permeability range of
approximately 10-10 to 10-9m2. It is interesting to note that the experimental data from [1, 6]
lie close to the maxima and the best performing samples in [1] and [10] have permeabilities (as
calculated using Eq 2) of 5.1 x10⁻¹⁰ and 4.1 x10⁻¹⁰m2respectively. Maxima occur since if the
permeability is too high, the velocity of air flow will change little when passing through the
pores and the resulting energy dissipation from friction will be low. If the permeability is too
low, most of the sound waves will be reflected from the specimen surface, also leading to poor
sound absorption [6]. Figure 3 also presents a more focussed study of the effect of the sample
thickness on Ac max, for samples with the same pore fraction (0.68). As might be expected,
decreasing the sample thickness shifts the maxima to slightly lower permeability. For
permeability in the range of approximately 7 to 9 x10⁻¹⁰ m2, Ac max is close to unity over the
thickness increases, the reverse is true for lower permeability. This insight helps clarify the
variable dependence upon thickness observed in the literature, in particular in [19].
Figure 3. Plots of sound absorption behaviour against permeability for (left) 20 mm thick
samples with a range of porosities and (right) for samples with different thickness and a
constant porosity (0.68).
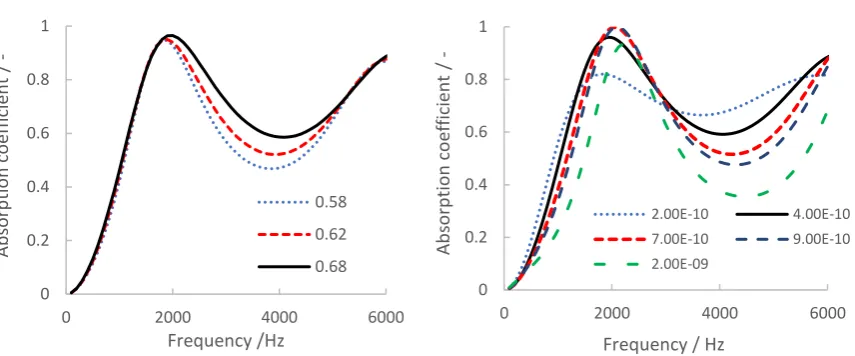
Neither the NRC nor Ac max values describe the absorption response across the whole range
of frequencies of interest. More complete optimisation requires minimising the characteristic
dip in absorption in the mid-range of frequencies, as was evident for the bottleneck structure
in Figure 1. Figure 4 plots the effect of pore fraction, for a 20 mm thick sample with the highest
NRC value (with a permeability of 4 x10⁻¹⁰ m2), showing that the highest porosity gives the
highest peak, shifting it to slightly higher frequency, and the lowest dip (an effect which is
similar to that observed in [6], but more pronounced than in the model in [10]). For this
maximum pore fraction (0.68), a wide range of permeability is plotted, showing that despite it
being possible to increase the peak absorption by increasing the permeability from 4 x10⁻¹⁰ m2
to 7 x10⁻¹⁰ m2 (as was evident in Figure 3), this comes with the penalty of a greatly increased
dip in absorption at frequencies close to 4000 Hz. Specific applications will drive the balance
between the need for maximum or more broadband absorption behaviour and the final choice
that is made, but the maxima in Ac max and NRC appear to bound the optimum search area.
To achieve the target permeability, for a given pore size and fraction, equation 2 can be
rearranged to define the target window size, which can be achieved by varying the pressure
difference used to affect infiltration [5]. Unlike as suggested by [10], this process suggests
there is not a unique optimum pore opening size or optimum ratio of pore to opening diameter.
0.0 0.2 0.4 0.6 0.8 1.0
1.0E-12 1.0E-10 1.0E-08 1.0E-06
Pro
p
erty
/
-Permeability / m2
0.0 0.2 0.4 0.6 0.8 1.0
1E-11 1E-10 1E-09 1E-08
Ac max
/
-Permeability / m2 10mm 20mm 40mm
NRC
In the context of other studies with pore diameters in the range of 0.5 - 2.0 mm, the target ratio
varies from roughly 0.3 to 0.1, consistent with suggested “optimum” pore openings of the order
[image:7.595.80.508.156.334.2]of 0.1 mm [10,20].
Figure 4 Plots of modelled normal incidence absorption coefficient against frequency for 20
mm thick structures (a) as a function of pore fraction and constant permeability (4x10⁻¹⁰ m2)
and (b) as a function of permeability and constant pore fraction (0.68).
The Wilson model has been seen to be reliable for simulating sound absorption in porous metals
with bottleneck structures and can be used as a tool to optimise porous structures using their
porosity and permeability as variables. Optimisation predicts that it is possible to increase peak
absorption and reduce the dip, compared with the performance of the bottleneck type porous
metal presented in [1] in Figure 1, by decreasing the permeability. Optimum permeability is,
however a (weak) function of sample thickness. Despite modelling indicating higher porosity
is favourable (and indeed that further improved broadband absorption would be realised if the
porosity could be increased further), achieving soundproofing performance close to that for
glass wool is not possible. However, with porosities of 68%, strengths and densities similar to
those for many polymers is achieved in these materials [21] with a stiffness which (even
without a backing material) is at least twice that for most polymers, making these materials
viable for load bearing components with credible soundproofing.
Acknowledgments
OAJ would like to acknowledge funding from the Dean’s Award made by the University of
Nottingham. 0 0.2 0.4 0.6 0.8 1
0 2000 4000 6000
Ab so rp tio n co ef fici en t / -Frequency /Hz 0.58 0.62 0.68 0 0.2 0.4 0.6 0.8 1
0 2000 4000 6000
Ab so rp tio n co ef fici en t /
-Frequency / Hz
References
1. Y, Li, L. Zhendong, F. Han, Procedia Materials Science, 4 (2014) 187-190.
2. B. Hinze, J. Rösler, Advanced Engineering Materials, 16 (2014) 284–288.
3. N. Kino, T Ueno, J. App. Acoustics, 69 (2008) 325-331.
4. Z. Bo, C. Tianning, Applied Acoustics, 70 (2009) 337-346.
5. P. Langston, A.R. Kennedy, Powder Technology, 268 (2014) 210-218.
6. Y. Li, X. Wang, X. Wang, Y. Ren, F. Han, C. Wen, Journal of Applied Physics, 110,
(2011) 113525.
7. M. E. Delany, E. N. Bazley, Appl. Acoust., 3 (1969) 105-116.
8. J. F. Allard, Y. Champoux, J. Acoust. Soc. Am., 91 (1992) 3346-3353.
9. D. K. Wilson, J. Acoust. Soc. Am., 94 (1993) 1136-1145.
10. T.J. Lu, F. Chen, D. He, J. Acoust. Soc. Am., 108 (2000) 1697-1708.
11. M Hakamada, T Kuromura, Y Chen, H Kusuda, M Mabuchi, Applied Physics Letts., 88
(2006) 254106.
12. M Hakamada, T Kuromura, Y Chen, H Kusuda, M Mabuchi, J. Applied Physics, 100
(2006) 114908.
13. http://apmr.matelys.com/index.html (accessed 21/02/2018)
14. J. Despois, A Mortensen, Acta Materialia 53 (2005) 1381-1388.
15. E.L. Furman, A.B. Finkelstein, M.L. Cherny, Metals, 3 (2013) 49-57.
16. G. J. F. Smit, J. P. Du Plessis, Chemical Engineering Science, 54 (1999) 645-654.
17. R Panneton, X Olny, J. Acoust. Soc. Am., 119 (2006) 2027.
18. A.J. Otaru, A.R. Kennedy, Scripta Materialia, 124 (2016) 30-33.
19. F. Han, G. Seiffert, Y. Zhao, B. Gibbs, J. Phys. D: Appl. Phys. 36 (2003) 294-302.
20. X. W. Wang, T. J. Lu, J. Acoust. Soc. Am., 106, (1999) 756-765.