The Effect of Basis Set and Exchange-Correlation Functional on Time-Dependent Density Functional Theory Calculations within the Tamm-Dancoff Approximation of the X-Ray Emission Spectroscopy of Transition Metal Complexes
Ian P. E. Roper1 and Nicholas A. Besley1,a)
School of Chemistry, University of Nottingham, University Park, Nottingham,
NG7 2RD, UK.
(Dated: 2 March 2016)
The simulation of X-ray emission spectra of transition metal complexes with
time-dependent density functional theory (TDDFT) is investigated. X-ray emission
spec-tra can be computed within TDDFT in conjunction with the Tamm-Dancoff
ap-proximation by using a reference determinant with a vacancy in the relevant core
orbital, and these calculations can be performed using the frozen orbital
approxi-mation or with the relaxation of the orbitals of the intermediate core-ionised state
included. Both standard exchange-correlation functionals and functionals
specifi-cally designed for X-ray emission spectroscopy are studied, and it is shown that the
computed spectral band profiles are sensitive to the exchange-correlation functional
used. The computed intensities of the spectral bands can be rationalised by
consid-ering the metal p orbital character of the valence molecular orbitals. To compute
X-ray emission spectra with the correct energy scale allowing a direct comparison
with experiment requires the relaxation of the core-ionised state to be included and
the use of specifically designed functionals with increased amounts of Hartree-Fock
exchange in conjunction with high quality basis sets. A range-corrected functional
with increased Hartree-Fock exchange in the short range provides transition energies
close to experiment and spectral band profiles that have a similar accuracy to those
from standard functionals.
I. INTRODUCTION
X-ray emission spectroscopy (XES) arises from the decay of valence electrons to fill
va-cant core orbitals following ionisation of core electrons. XES probes the occupied molecular
orbitals and is complementary to X-ray absorption spectroscopy (XAS) which is sensitive
to the unoccupied orbitals. Owing to the nature of core orbitals, these techniques provide
an element specific, local probe of geometric and electronic structure. XES is becoming an
increasingly important technique due to improved X-ray sources and the development of
X-ray free-electron lasers that can deliver short femtosecond pulses of hard X-rays which
hold the promise of resolving ultrafast chemical processes at an atomic level.1,2
Recent work has demonstrated the value of XES for the study of transition metal
complexes, and experimental spectra for Fe, Cr, Ti and Mn based complexes have been
reported.3–11 XES is sensitive to the nature of the bonding in transition metal complexes,
giving information on the coordination environment and the potential to identify
coordi-nated ligands. For example, XES measurements showed there to be a central carbon in the
nitrogenase iron-molybdenum cofactor.12 For transition metal complexes, XES is usually
studied following the ionisation of a metal 1s electron. The most prominent features in the
corresponding spectra are the Kβ1,3 emission lines which are associated with electric dipole
allowed metal 3p→1s transitions. Much of the experimental work has focused on higher
energy transitions that have significantly lower intensity. This region is referred to as the
valence to core region and comprises transitions from orbitals associated with the ligands.
There are two groups of features in this region, the Kβ00 lines that arise from ligand-valence
s→metal 1s transitions and the Kβ2,5 lines corresponding to ligand-valence p→metal 1s
transitions.4
Calculations of XES have an important role in interpreting experimental spectra and
assigning the observed bands. Several approaches to computing XES have been adopted, in
ligand field multiplet theory a single ion is considered and the chemical environment is then
incorporated empirically by introducing the crystal field splittings and the orbital mixing.13
The energy and matrix elements of the electric dipole moment operator for the various
using a variety of methods including semi-empirical, Hartree-Fock (HF),14 configuration
interaction (CI),15 multi-configurational self-consistent field (MCSCF) wave functions,16,17
Monte Carlo configuration interaction,18 as well as Kohn-Sham density functional theory
(DFT).4 Following ionisation of a core electron there is some relaxation of the electronic
structure, and various approaches to describing the orbitals of the core-excited state have
been adopted. These range from a frozen orbital (FO) approximation where the ground
state orbitals are used,4,19–21 Z+1 approximation where an increased nuclear charge is used
for the absorbing atom,3 the transition potential approach where a half filled core orbital is
used providing a balance between final and initial states19,22,23 and a fully relaxed approach
where the orbitals of the core-hole state are optimised in separate self-consistent field (SCF)
calculations.24,25 This latter approach has the limitations that individual SCF calculations
are necessary for all of the relevant states and the resulting wave functions are not
orthog-onal. X-ray emission spectroscopy has been computed using a real-space-grid projector
augmented wave framework which can be used to study large systems26 and recent work
has shown how to include vibrational interference effects in the simulation of the spectra.27
Within the context of transition metal complexes, the simulation of spectra has been
predominantly based upon DFT calculations. Smolentsev et al.3 computed X-ray emission
spectra of Mn complexes with DFT and the core-hole described using the Z+1
approxima-tion. The generalised gradient approximation Perdew-Wang exchange-correlation functional
was used and the predicted spectra was shifted to align with experiment. The calculations
allowed features in the valence to core region could be assigned to orbitals mainly localised
on the ligands. More recent DFT calculations on Fe complexes used the FO approximation
with the transition energies given by the difference in the corresponding orbital energies and
the intensities evaluated from the matrix elements of the electric dipole, electric quadrupole
and magnetic dipole operators.4 These calculations demonstrated good agreement with
the experimental data, reproducing the shape of the spectral bands in the valence to core
region. Similar protocols have been applied to study manganese complexes,6,10 chromium
complexes11 and substituted ferrocenes.8
Recently it was shown that X-ray emission spectra can be computed with equation of
density functional theory (TDDFT) methods by using a reference determinant for the ionised
state that has a core-hole.28–30 With this reference determinant the transitions to the vacant
core orbital appear as negative eigenvalues. EOM-CCSD provides accurate transition
ener-gies (within about 0.5 eV) for transitions at the K-edge of first and second row elements.
However, converging the CCSD equations with a core-hole reference wave function can be
problematic and the computational cost of this method makes it unsuitable for application
to transition metal complexes.30,31 Provided that the Tamm-Dancoff approximation (TDA)
is imposed,32 TDDFT can be applied to a reference determinant with a core-hole. TDDFT
has the advantage that all of the necessary states are computed in the same calculation
making it easy to use and also avoiding issues with the non-orthogonalilty of the states,
and TDDFT calculations of XES can be performed within the FO or Z+1 approximations.
TDDFT has a significantly lower computational cost and can be readily applied to study the
XES of large transition metal complexes. Recently Zhang et al. extended TDDFT
calcula-tions of XES to consider transition metal complexes.33 These calculations studied a range
of chromium, manganese and iron based complexes with the B3LYP exchange-correlation
functional in conjunction with the Sapporo-TZP-201234basis set for the metal and 6-311G**
basis set for the ligands with the spectral bands shifted to align with experiment. Overall,
the computed spectral profiles provided a reliable description of the experimental data.
In this paper we explore the application of TDDFT/TDA to compute X-ray emission
spectra of transition metal complexes, focusing on the dependence of the computed spectra
to the frozen orbital approximation, choice of exchange-correlation functional and basis set
in an effort to compute spectra with the correct energy scale. This can provide greater
confi-dence in the assignment of bands in complex spectra and also be important when comparing
small shifts in peak positions between different systems where the magnitude of the shift can
be of the order of the error in the constant shift applied. To achieve this requires the
relax-ation of the molecular orbitals in the presence of the core-hole to be included, high quality
basis sets, relativistic effects and also specifically designed exchange-correlation functionals
to be considered. Standard exchange-correlation functionals give excitation energies that
are significantly too large compared with experimental data.28,30 This is complementary
to TDDFT calculations of XAS, where the predicted excitations energies are too low.35,36
calculations of XAS based upon tailoring the fraction of exact Hartree-Fock (HF) exchange
in the functional.35–38 In particular, the introduction of HF exchange in the short range is
important.38We also develop a quantitative relationship between the nature of the occupied
orbitals and the intensity of the spectral bands.
II. COMPUTATIONAL METHODS
Within TDDFT X-ray emission transitions energies and oscillator strengths can be
com-puted with the following process:30
1. Perform an unrestricted Kohn-Sham DFT calculation for the ground state of the
system (with appropriate charge and spin state).
2. Use the resulting molecular orbitals as the starting point for a further Kohn-Sham
DFT calculation with a core hole in the relevant orbital, using an overlap criterion39,40
to prevent the collapse of the core hole during the SCF process. The FO approximation
can be invoked by by-passing this second SCF calculation.
3. Perform a standard TDDFT/TDA calculation and the X-ray emission transitions
ap-pear as negative eigenvalues with the associated oscillator strengths.
In TDDFT with the TDA32 the transition energies correspond to solutions of the following
eigenvalue equation
AX =ωX (1)
The matrix A is given by
Aiaσ,jbτ =δijδabδστ(aσ−iτ) + (iaσ|jbτ) + (iaσ|fXC|jbτ) (2)
where
(iaσ|jbτ) =
Z Z
ψ∗iσ(r1)ψ∗aσ(r1) 1
r12
ψjτ(r2)ψbτ(r2)dr1dr2 (3)
(iaσ|fXC|jbτ) = Z
ψ∗iσ(r1)ψaσ(r1)
∂2E XC
∂ρσ(r1)∂ρτ(r2)
and i are the orbital energies andEXC is the exchange correlation functional. We note that
use of the TDA is necessary for these calculations since full TDDFT calculations are not
possible for the reference determinant with a core-hole and all of the TDDFT calculations
presented have used the TDA. The TDA approximation only has a small effect on the
com-puted transition energies but can have a more significant effect on the comcom-puted intensities.
As the nuclear charge of the absorbing atom increases, scalar relativistic effects become
increasingly important in calculations of X-ray spectroscopies at the K-edge. Relativistic
effects result in a lowering of the energy of the 1s core orbital, and for transition metals this
effect cannot be neglected. These effects are incorporated into the calculations by modifying
the diagonal elements of A as follows
Aiaσ,jbτ =δijδabδστ(aσ−iτ −∆R) + (iaσ|jbτ) + (iaσ|fXC|jbτ) (5)
where ∆Ris the magnitude of the energy change in the core orbital energy due to relativistic
effects. This has been computed as the difference in the 1s orbital energy between
rela-tivistic and non-relarela-tivistic HF/cc-pCVTZ for the relevant atom with the relarela-tivistic effects
modelled using the Douglas-Kroll-Hess Hamiltonian, and a similar approach has been used
to correct X-ray absorption transition energies.41 The values of ∆
R show an increase with
increasing nuclear charge with values of 38.41 and 44.68 eV for chromium and manganese,
respectively. In this approach the lowering in energy owing to relativistic effects for the
valence orbitals is neglected. These effects are much smaller than for the core orbitals and
lie between 0.1 eV and 0.2 eV.
The B3LYP,42,43 BP8644,45 and modified hybrid and short-range corrected (SRC)
func-tionals have been used to compute transition energies and spectra. For the K-edge of first
and second row elements the following hybrid functional was shown to the accurate for XES
where the fraction of HF exchange was optimised to reproduce accurate transition energies30
B66LYP = 0.66 HF + 0.26 B + 0.08 S + 0.19 VWN + 0.81 LYP (6)
where HF, B and S are Hartree-Fock, Becke and Slater exchange functionals, and VWN
and LYP are correlation functionals.44,46–48 A SRC functional has also been optimised for
in the short range (low r12) which falls of quickly as r12 increases. This functional has the
following four parameters CSHF=0.71, CLHF=0.17, µSR=0.64 ao−1 and µLR=2.45 a−o1 which
represent the fractions of HF exchange at r12=0 and r12= ∞, while µSR and µLR are the
attenuation parameters in the error functions.
In addition to the exchange-correlation functional, another factor that has emerged as
important is the nature of the basis functions present in the basis set. For ionisation of core
electrons of heavier atoms, it is increasingly important to include additional basis functions
for the core orbitals.30 A range of basis sets have been studied including 6-31G*, 6-31G*
with uncontracted core basis functions (denoted u6-31G*), Ahlrichs VTZ, pVDZ,
cc-pVTZ and cc-pCVTZ.49–53 For the calculations denoted cc-pCVTZ, the cc-pwCVTZ basis
set was used for the metal atom with the cc-pVTZ basis set used for the remaining atoms.
All calculations were performed with the Q-Chem software package54 and the structures
were optimised at the B3LYP/6-31G* level. Spectra have been generated by convoluting
the computed transitions with gaussian functions with bandwidth of 1.5 eV. Calculations
are presented for the [MnO4]1−, [MnN(CN)4]2−, Cr(CO)6 and [Cr(NH3)6]3+ complexes since
they are relatively small to allow calculations with large basis sets and have high quality
experimental data available. Comparison of the calculated results with experiment for
these clusters allows the general trends in the accuracy of the calculations with respect
to the exchange-correlation functional and basis set to be established. In the calculations
presented, the effects of spin multiplet states are not included. Multiplet effects in X-ray
spectroscopy have been reviewed and found to be less important for K-edge transitions
compared to L-edge transitions.55
For the analysis of the results it is useful to quantify the metal p orbital character of the
molecular orbitals. The metal p orbital character in an orbitali is evaluated as
Pi = X
¯ µ
(cµi¯ )2 (7)
where ¯µ runs over the p orbital basis functions of the central metal atom and cµi¯ are the
molecular orbital coefficients. The metal p orbital character in a transition to give final state
λ is defined as
Tpλ =X i
(κic) 2
where κic is the TDDFT amplitude for the transition from molecular orbital i to the metal
core orbital for the state λ. In practice we include amplitudes with a magnitude greater
than 0.1. The p character of a band in the spectrum (Tp) is determined from summing the
Tpλ for the electronic transitions that contribute to the band. We note that this type of
analysis will become unreliable for basis sets which have extended (diffuse) p basis functions.
In these cases the summation can be limited to include only the compact basis functions in
the basis set, however, we have not explored this in detail in this work and all values of Pi
are computed with the 6-31G* basis set.
III. RESULTS AND DISCUSSION
Initially we consider the sensitivity of the computed transition energies to the basis set
and exchange-correlation functional. Table I shows the computed transition energies for
the Kβ1,3 line and the most intense transition in the Kβ2,5 region for [MnO4]1− with three
different exchange-correlation functionals and basis sets of varying quality. We consider first
the values for the B3LYP functional. For both transitions, the sensitivity of the computed
transition energies to the size of the basis set is evident. There is a lowering of about
40 eV in the computed transition energy between the smallest (6-31G*) and the largest
(cc-pCVTZ) basis sets used. However, with the cc-pCVTZ basis set the predicted transition
energies remain over 50 eV too high, and this remaining error can be largely associated
with the exchange-correlation functional. Table I also shows computed transition energies
for the B66LYP and SRC functionals that were parameterised based upon X-ray emission
transitions following the photoionisation of the 1s electrons of first and second row elements.
Both functionals demonstrate a similar dependence on the quality of the basis set. As
expected, the functionals predict transition energies closer to the experimental values. With
B66LYP the predicted transition energy for the valence to core region with the larger basis
set is 6544 eV compared to the experimental value of 6538 eV. The SRC functional gives the
closest agreement with the experimental value with a predicted transition energy of 6537
eV for the Kβ2,5 line.
Method Kβ1,3 Kβ2,5 ∆EKβ2,5
B3LYP/6-31G* 6587 6636 +98
B3LYP/u6-31G* 6581 6629 +91 B3LYP/cc-pVDZ 6584 6633 +95
B3LYP/Ahlrichs VTZ 6551 6600 +62 B3LYP/cc-pVTZ 6569 6620 +82
B3LYP/cc-pCVTZ 6549 6597 +59
B66LYP/6-31G* 6540 6582 +44 B66LYP/u6-31G* 6533 6573 +35
B66LYP/cc-pVDZ 6539 6580 +42 B66LYP/Ahlrichs VTZ 6505 6545 +7
B66LYP/cc-pVTZ 6525 6566 +28 B66LYP/cc-pCVTZ 6503 6544 +6
SRC/6-31G* 6535 6576 +38
SRC/u6-31G* 6529 6571 +33 SRC/cc-pVDZ 6532 6572 +34
SRC/Ahlrichs VTZ 6499 6539 +1 SRC/cc-pVTZ 6515 6566 +28
SRC/cc-pCVTZ 6498 6537 -1
Exp.a - 6538
-TABLE I. Variation in the computed emission energies with functional and basis set for [MnO4]1−.
∆EKβ2,5 is the deviation of the calculated emission energy from experiment for the Kβ2,5 line. aexperimental data10. The number of basis functions for manganese are 36, 41, 43, 43, 68 and 127
for the 6-31G*, u6-31G*, cc-pVDZ, Ahlrichs VTZ, cc-pVTZ and cc-pCVTZ basis sets, respectively,
and 15, 15, 14, 14, 30, 30 for oxygen.
fraction of HF exchange than 66% in a hybrid functional may be optimal. However, we do
not consider in detail increasing the fraction of HF exchange because, as is shown later,
increasing the component of HF exchange can have a detrimental effect on the predicted
[image:9.612.195.419.67.512.2]experiment suggesting that increasing the HF component would worsen the agreement with
experiment. This is similar to the case of XAS where exchange-correlation functionals
parameterised for second row elements perform reasonably well for the K-edge of first row
transition metals.56,57 The cc-pCVTZ basis set represents a quite extensive basis set that
cannot be readily applied to large transition metal complexes. The fact that a very large
basis sets is required to converge the transition energies is largely due to the basis sets not
being designed for core orbital properties. With appropriately designed basis sets it should
be possible to converge the energy with a much smaller number of basis functions. An
example of this are the IGLO basis sets58 which are designed for NMR calculations, these
work very well for the XES of first and second row elements but do not exist for transition
metal elements. Amongst the smaller basis sets studied, we note that the Ahlrichs VTZ
basis set also predict transition energies that are reasonably close to experiment.
We now consider how the different approximations and various exchange-correlation
functionals affect the computed band profiles. Predicting the band profile is key to
simu-lation of XES spectra. Since computed spectra can be shifted to align with experiment it
is important that exchange-correlation functionals designed to predict the transition
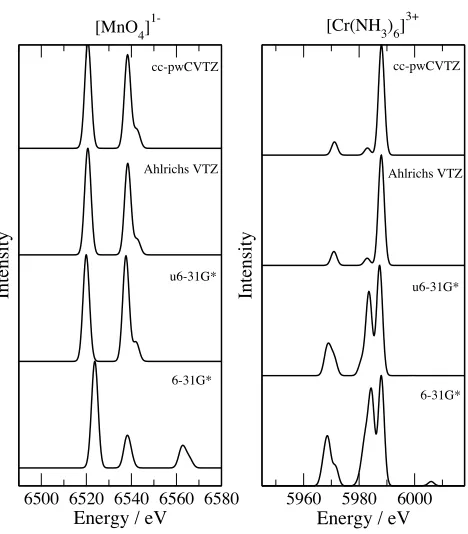
ener-gies correctly do not do so at the expense of the computed band profile. Figure 1 shows
the valence to core region computed with various exchange-correlation functionals and the
large cc-pCVTZ basis set with the spectra shifted to align with the experimental data for
the [MnO4]1− complex. Also shown are the valence molecular orbitals that contribute to
this region of the spectrum with their values for Pi evaluated using B3LYP/6-31G* (see
equation 7). The Pi values do not vary significantly between different exchange-correlation
functionals, for example the values for the two orbitals with the SRC functional are 0.045
and 0.032 compared to 0.049 and 0.034. The Pi values suggest that there are two orbitals
that have a significant (> 0.01) metal orbital character and it is indeed transitions from
these two orbitals that gives the two prominent bands observed in the spectrum.
The spectrum computed with B3LYP with the FO approximation, wherein the molecular
orbitals are not relaxed within the second SCF calculation, has an accurate band profile and
a relative energy spacing of the bands in good agreement with experiment. This is similar
6500 6520 6540 6560 Energy / eV
Intensity
6500 6520 6540
Energy / eV
Intensity
Experiment
SRC (+1.0 eV)
B66LYP (-5.4 eV)
BP86 (-98.6 eV)
B3LYP (-58.7 eV)
FO B3LYP (+89.5 eV)
Experiment
SRC (+0.4 eV)
B66LYP (-5.5 eV)
BP86 (-84.5 eV)
B3LYP (-59.5 eV)
FO B3LYP (+88.8 eV)
[MnO4]1- [MnN(CN)4]
2-Energy'
t1' 0.000't2' 0.049'
a1' 0.000'
t2' 0.008'
t2' 0.034' e' 0.000' 2"
[image:11.612.116.493.81.388.2]1" 1" 2"
FIG. 1. Experimental and computed X-ray emission spectra for [MnO4]1− with various
exchange-correlation functionals and the cc-pCVTZ basis set shown with the valence molecular orbitals and their associated Pi values. The computed spectra have been shifted to align with experiment with
the shifts applied shown in parenthesis. Experimental data adapted from reference10.
of the ground state, and reflects the general success of these approaches to simulating XES
spectra.4,6,8,10,11 Removing the FO approximation has no noticeable effect on the shape of
the spectral profile but it does result in a large shift in the transition energies. Removing a
core electron increases the effective nuclear charge, which leads to a lowering in the energies
of the molecular orbitals. This effect is greatest for the core orbitals resulting in an overall
increase in the transition energies. Optimising the molecular orbitals in the presence of
the core-hole also results in a lower oscillator strengths which correlates with a reduction
in the metal p orbital character in the orbitals. This effect is greatest for the t2 orbitals
contributing to the lower energy band which is consistent with the small reduction in the
Molecule Band Energy / eV Tp SRC f ×100 SRC Tp B3LYP f×100 B3LYP
[MnO4]1− 6543 0.048 0.033 0.012 0.000
6539 0.129 0.167 0.117 0.113
[image:12.612.114.499.72.161.2]6521 0.093 0.190 0.075 0.087
TABLE II. Calculated p orbital character in the observed bands and oscillator strengths for B3LYP and SRC exchange-correlation functionals.
removed. Using a different exchange-correlation functional BP86 results in a change in the
relative intensity of the two bands, with the relative intensity of the higher energy band
increasing.
The spectrum for B66LYP is much closer to the experiment in terms of the absolute
transition energies, but a distinct peak emerges on the high energy side of the band at
6538 eV. The closest to experiment in terms of absolute energies is the SRC functional,
and for this functional the resulting spectrum is in reasonable agreement with experiment.
However, for this functional there is also a small shoulder at the base of the band at high
energy. Closer inspection shows that this feature is also evident in an asymmetry in the
band from the calculation with BP86. The corresponding transitions are present in the
B3LYP calculation, but the band is not evident because the transitions have zero intensity.
This contradicts the analysis in terms of the metal p character of the molecular orbitals and
suggests that a band of significant intensity arises from a transition from an orbital with
d orbital character at the central metal atom. This can be rationalised by considering the
values of Tp for the spectral bands which are shown in Table II. This shows that there is a
significant value of Tp for the band at 6543 eV for the SRC functional which is not given
with the B3LYP functional. This demonstrates that this intensity arises from a mixing
of transitions from orbitals with metal p character into this transition within the TDDFT
calculation. The precise balance of ligand and metal character of the molecular orbitals and
the TDDFT amplitudes (κic) will be dependent on the exchange-correlation functional used
and can rationalise the observed sensitivity of the band profiles to the functionals.
experi-Energy'
e' 0.013'a1' 0.011'
a1' 0.046'
e' 0.028'
6500 6520 6540 6560
Energy / eV
Intensity
6500 6520 6540
Energy / eV
Intensity
Experiment
SRC (+1.0 eV)
B66LYP (-5.4 eV)
BP86 (-98.6 eV)
B3LYP (-58.7 eV)
FO B3LYP (+89.5 eV)
Experiment
SRC (+0.4 eV)
B66LYP (-5.5 eV)
BP86 (-84.5 eV)
B3LYP (-59.5 eV)
FO B3LYP (+88.8 eV)
[MnO4]1- [MnN(CN)
4]
2-e' 0.023'
5"
1" 4"
3"
2"
[image:13.612.110.505.83.383.2]1" 2" 3"
FIG. 2. Experimental and computed X-ray emission spectra for [MnN(CN)4]2− with various
exchange-correlation functionals and the cc-pCVTZ basis set shown with the valence molecular orbitals with Pi values >0.01. The computed spectra have been shifted to align with experiment
with the shifts applied shown in parenthesis. Experimental data adapted from reference10.
mental spectrum for this complex shows two distinct bands, the higher energy band is more
intense with two peaks of similar intensity. For this complex there are five orbitals with
significant metal p character that contribute to this region of the spectrum which are also
shown in Figure 2. The peak at low energy is arises from an orbital ofa1 symmetry that is
localised on the metal-nitrogen atom bond. The broader higher energy band has
contribu-tions from the other four orbitals, but with dominant contribucontribu-tions from two of these. The
accurate description of this band represents a challenge since it requires the balance between
these different contributions to be described correctly. The spectrum given by B3LYP with
the FO approximation correctly predicts the energy separation between the two bands but
Energy'
5960 5970 5980 5990
Energy / eV
Intensity
5960 5970 5980 5990 6000
Energy / eV
Intensity
Experiment
SRC (+3.2 eV)
B66LYP (-1.3 eV)
BP86 (-79.3 eV)
B3LYP (-55.2 eV)
FO B3LYP (+85.5 eV)
Experiment
SRC (+1.4 eV)
B66LYP (-4.7 eV)
BP86 (-75.4 eV)
B3LYP (-52.3 eV)
FO B3LYP (+86.1 eV)
[Cr(NH3)6]3+ Cr(CO)6
t1g' 0.074'
t1g' 0.026'
t1g' 0.015'
1" 3"
2"
[image:14.612.108.501.81.383.2]1" 2" 3"
FIG. 3. Experimental and computed X-ray emission spectra for Cr(CO)6 with various
exchange-correlation functionals and the cc-pCVTZ basis set shown with the valence molecular orbitals with
Pivalues>0.01. The computed spectra have been shifted to align with experiment with the shifts
applied shown in parenthesis. Experimental data adapted from reference11
.
Removing the FO approximation gives a spectrum for B3LYP where the relative intensities
of these two components is closer to the experimental data. For the remaining spectra
computed with different exchange-correlation functionals there is significant variation in the
relative intensities of these two peaks with the calculations showing one component to be
more intense. Most of the calculations predict the separation between the two bands well
with the exception of B66LYP functional which overestimates the separation. Overall for
the Mn based complexes the best agreement with experimental data is given by the B3LYP
functional without the FO approximation. The choice of exchange-correlation functional
Energy'
5960 5970 5980 5990
Energy / eV
Intensity
5960 5970 5980 5990 6000
Energy / eV
Intensity
Experiment
SRC (+3.2 eV)
B66LYP (-1.3 eV)
BP86 (-79.3 eV)
B3LYP (-55.2 eV)
FO B3LYP (+85.5 eV)
Experiment
SRC (+1.4 eV)
B66LYP (-4.7 eV)
BP86 (-75.4 eV)
B3LYP (-52.3 eV)
FO B3LYP (+86.1 eV)
[Cr(NH3)6]3+ Cr(CO)6
0.055'
0.004'
0.004'
1" 3"
2"
1" 2"
[image:15.612.103.503.78.379.2]3"
FIG. 4. Experimental and computed X-ray emission spectra for [Cr(NH3)6]3+ with various
exchange-correlation functionals and the cc-pCVTZ basis set shown with the relevant valence molecular orbitals. The computed spectra have been shifted to align with experiment with the
shifts applied shown in parenthesis. Experimental data adapted from reference11.
provide more accurate absolute energies but there is some worsening of the predicted band
profiles, particularly for B66LYP. This is likely due to the higher fraction of HF exchange
worsening the description of the valence orbitals. The SRC functional by its nature provides
a compromise since it corrects the transition energies with a smaller change in the band
profile compared with B3LYP.
Figures 3 and 4 show computed spectra for two chromium based complexes Cr(CO)6 and
[Cr(NH3)6]3+. The experimental spectrum of Cr(CO)6 shows an intense band at 5985 eV
with a shoulder on the low energy side with a weaker band about 5 eV lower in energy. The
Pi analysis gives threet1g orbitals with significant metal p orbital character with orbital with
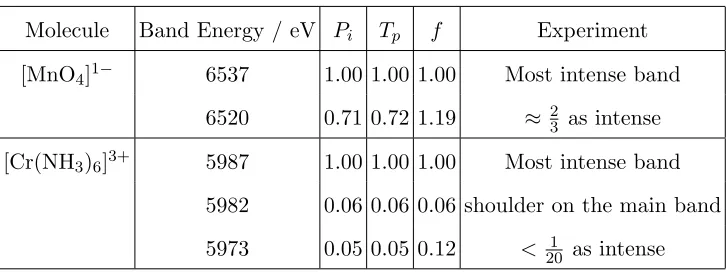
Molecule Band Energy / eV Pi Tp f Experiment
[MnO4]1− 6537 1.00 1.00 1.00 Most intense band
6520 0.71 0.72 1.19 ≈ 23 as intense
[Cr(NH3)6]3+ 5987 1.00 1.00 1.00 Most intense band
5982 0.06 0.06 0.06 shoulder on the main band
[image:16.612.124.487.69.205.2]5973 0.05 0.05 0.12 < 201 as intense
TABLE III. Relative intensities of the spectral bands computed with the SRC exchange-correlation
functional.
the three features in the computed spectra with the orbital with Pi = 0.074 associated with
the most intense band. Most of the calculations provide a good description of this spectrum.
The exceptions to this are the BP86 functional, where the low energy feature appears as a
large shoulder on the main band band, and the B66LYP functional where the lower energy
feature is too weak. In particular the spectrum computed with the SRC functional is close
to experiment.
The three complexes studied so far have a singlet ground state with doublet core-excited
state. [Cr(NH3)6]3+ is different in that it has a quartet ground state. For this system the
core-hole is introduced withαspin where there is a greater number ofαelectrons. Analogous
calculations with a core-hole of β spin can be performed, however, the resulting transitions
have lower energies and do not contribute to the spectrum presented. One further issue with
these calculations is that an unrestricted Kohn-Sham determinant for open-shell systems
will suffer from spin-contamination. Spin-contamination is also an issue for ∆SCF
calcula-tions that allow for the relaxation of the orbitals in the presence of the core-hole. This is
particularly the case for [Cr(NH3)6]3+ which has a triplet core-hole state. The results show
that the SRC functional also describes the spectrum for the [Cr(NH3)6]3+well. This suggests
that the effects of spin-contamination in the reference wavefunction are not apparent in the
resulting spectrum once that the line broadening has been applied or that the associated
error is less significant than other approximations made in the calculations. However, it is
clearly desirable to remove the spin-contamination from the calculations. A previous study
found there to be only small differences between the intensities of the bands, although in the
B3LYP spectra the bands were spread out more with a greater separation between the high
and low energy features.8 This is also evident in the TDDFT spectra shown here, although
a greater variation in the intensities is observed here. It is possible that intensities
com-puted with TDDFT are more sensitive to the exchange-correlation functional than spectra
computed based upon single electron transitions and the Kohn-Sham orbitals. Within a
TDDFT approach the transitions are no longer described as pure one electron transitions,
and the mixing between one electron transitions can affect the computed intensity. The
different functionals provide fairly consistent predictions of the spectrum for this complex,
with some variation in the energy separation between the bands. For this complex B3LYP
without the FO approximation shows the greatest deviation from experiment with the weak
feature on the low energy side of the intense band predicted to be too intense. The ratio
of the intensities of the bands in the spectra for [MnO4]1− and [Cr(NH3)6]3+ as predicted
by the different approaches are given in Table III. These show that the values given by Pi
and Tp are in close agreement with experiment and surprisingly closer to experiment than
the TDDFT oscillator strength. This may in part be associated with the use of the TDA
which is likely to lead to greater errors in the computed oscillator strengths or the dipole
approximation which may also play a role.59,60
The aim of the B66LYP and SRC functionals is to predict the absolute energies of the
transitions. Table IV summarises the computed positions of the prominent bands in the
spectra for these two functionals. We will focus on the results for the SRC functional
since this functional gives an overall better description of the spectral profiles. For the two
manganese based complexes, the computed transition energies are close to the
experimen-tal values and a shift of 1 eV or less is required to align the computed and experimenexperimen-tal
spectra. There is a small increase in the error in the computed transition energies for the
chromium based complexes. However considering other sources of error that are present in
the calculations, for example the treatment of relativistic effects and the remaining
incom-pleteness of the basis set, a reasonable level of accuracy is achieved. As discussed previously,
the computed transition energies are strongly dependent on the basis set and to approach
convergence with respect to the basis set requires large basis sets with tight basis functions
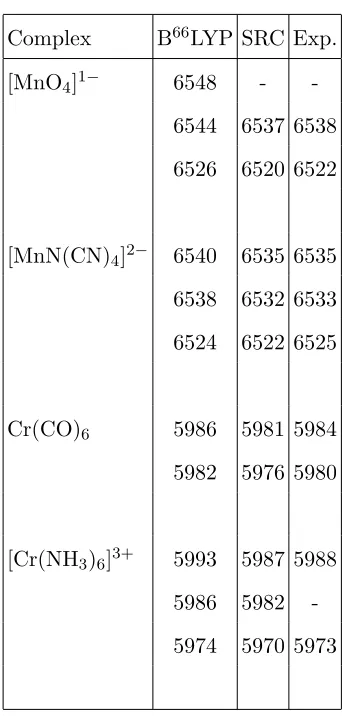
Complex B66LYP SRC Exp.
[MnO4]1− 6548 -
-6544 6537 6538 6526 6520 6522
[MnN(CN)4]2− 6540 6535 6535
6538 6532 6533 6524 6522 6525
Cr(CO)6 5986 5981 5984
5982 5976 5980
[Cr(NH3)6]3+ 5993 5987 5988
5986 5982
[image:18.612.219.390.65.423.2]-5974 5970 5973
TABLE IV. Computed B66LYP and SRC emission energies for the complexes studied. Experimen-tal data from references10,11.
band profiles to the quality of the basis set. There is a clear improvement in the computed
spectra when basis sets larger than 6-31G* and u6-31G* are used. However, the band
pro-files computed with the Ahlrichs VTZ basis set are very similar to those of the considerably
larger cc-pCVTZ basis set. The Ahlrichs VTZ basis set is a moderately sized basis set that
can be applied to study much larger systems.
IV. CONCLUSION
TDDFT with the TDA has been applied to the calculation of X-ray emission spectra of
transition metal complexes by using a reference determinant with a core hole in the metal
6500 6520 6540 6560 6580
Energy / eV
Intensity
5960 5980 6000
Energy / eV
Intensity
7080 7100 7120
Energy / eV
Intensity
[MnO4]
1-cc-pwCVTZ
Ahlrichs VTZ
u6-31G*
6-31G*
[Cr(NH3)6]3+
cc-pwCVTZ
Ahlrichs VTZ
u6-31G*
6-31G*
[Fe(CN)6]
4-cc-pwCVTZ
Ahlrichs VTZ
u6-31G*
[image:19.612.188.422.71.338.2]6-31G*
FIG. 5. Variation of the band profiles computed with the SRC exchange-correlation functional
with basis set. Spectra have been shifted to align with the cc-pCVTZ spectra.
[Cr(NH3)6]3+ complexes. This a relatively straightforward computational method to use
and in conjunction with the FO approximation, where there is no relaxation of the orbitals
of the intermediate state, it gives spectra that are similar to existing approaches to simulate
XES of systems of this type. The computed transition energies show a large dependence on
the quality of the basis set used, and to achieve close agreement with experimental
spec-tra it is necessary to use high quality basis with additional basis functions to describe the
core orbitals. To compute X-ray emission spectra with the correct energy scale allowing a
direct comparison of experiment and theory without the need to shift the computed
spec-tra to match experiment requires the relaxation of the core ionised state to be included
and the use of specifically designed functionals with increased amounts of HF exchange.
The FO approximation has a smaller effect on the computed spectral band profiles than
changes in the exchange-correlation functional, and variations in the spectra between
differ-ent functional are presdiffer-ent whether the FO approximation is applied or not. Two types of
exchange-correlation functional parameterised for the XES of molecules involving elements
hybrid functional with 66% HF exchange and the second a range-separated functional with
an increased component of HF exchange in the short range only. While the computed
tran-sition energies are a lot closer to experiment, the hybrid functional gives band profiles that
show a poorer agreement with experiment than standard functionals. The SRC functional
represents a compromise giving transition energies close to experiment and spectral band
profiles that are nearly as accurate as those from standard functionals such as B3LYP. The
bands observed in the valence to core region have been correlated with the degree of metal
p character in the molecular orbitals comprising the constituent transitions, and it is shown
that some of the deviation from experiment in the computed band profiles can be
associ-ated with incorrect mixing of transitions introduced by the TDDFT eigenvector. Further
improvements in the calculations such as a more accurate treatment of relativistic effects,
going beyond the dipole approximation in the calculation of the intensities and inclusion of
transition metal complex XES data in the functional parameterisation should improve the
agreement with experiment further.
V. ACKNOWLEDGMENTS
NAB gratefully acknowledges the Leverhulme Trust for a Research Fellowship (Reference
RF-2014-231).
REFERENCES
1J. van Bokhoven, Phys. Chem. Chem. Phys. 12, 5502-5502 (2010).
2B.D. Patterson and R. Abela, Phys. Chem. Chem. Phys. 12, 5647-5652 (2010).
3G. Smolentsev, A.V. Soldatov, J. Messinger, K. Merz, T. Weyherm¨uller, U. Bergmann, Y.
Pushkar, J. Yano, V.K. Yachandra and P. Glatzel, J. Am. Chem. Soc. 131, 13161-13167
(2009).
4N. Lee, T. Petrenko, U. Bergmann, F. Neese and S. DeBeer, J. Am. Chem. Soc. 132,
9715-9727 (2010).
5J.C. Swarbrick, Y. Kvashnin, K. Schulte, K. Seenivasan, C. Lamberti and P. Glatzel, P.
6M.A. Beckwith, M. Roemelt, M.-N. Collomb, C. DuBoc, T.-C. Weng, U. Bergmann, P.
Glatzel, F. Neese, and S. DeBeer, Inorg. Chem. 50, 8397-8409 (2011).
7C.J. Pollock and S. DeBeer, J. Am. Chem. Soc. 133, 5594-5601 (2011).
8A.J. Atkins, M. Bauer and C. R. Jacob, Phys. Chem. Chem. Phys. 15, 8095-8105 (2013).
9M.U. Delgado-Jaime, S. DeBeer and M. Bauer, Chem. Eur. J.19, 15888-15897 (2013).
10E.R. Hall, C.J. Pollock, J. Bendix, T.J. Collins, P. Glatzel and S. DeBeer, J. Am. Chem.
Soc. 136, 10076-10084 (2014).
11S.N. MacMillan, R.C. Walroth, D.M. Perry, T.J. Morsing and K.M. Lancaster, Inorg.
Chem. 54, 205-214 (2015).
12K.M. Lancaster, M. Roemelt, P. Ettenhuber, Y. Hu, M.W. Ribbe, F. Neese, U. Bergmann
and S. DeBeer, Science 334, 974-977 (2011).
13F. de Groot, Coord. Chem. Rev. 249, 31-63 (2005).
14H. ˚Agren and J. Nordgren, Theoret. Chim. Acta 58, 111-119 (1981).
15H. ˚Agren, R. Arneberg, J. M¨uller, and R. Manne,Chem. Phys. 83, 53-67 (1984).
16˚Agren, H.; Flores-Riveros, A.; Jørgen, H.; Aa Jensen, H.J. Physica Scripta 1989, 40,
745-750.
17A. Flores-Riveros and H. ˚Agren, Physica Scripta 44, 442-445 (1991).
18J.P. Coe and M.J. Paterson, Theor. Chem. Acc. 134, 58 (2015).
19L. Triguero, L. G.M. Pettersson and H. ˚Agren,J. Phys. Chem. A102, 10599-10607 (1998).
20A. F¨ohlisch, J. Hasselstr¨om, P. Bennich, N. Wassdahl, O. Karis, A. Nilsson, L. Triguero,
M. Nyberg and L.G.M. Pettersson, Phys. Rev. B 61, 16229-16240 (2000).
21J. Gladh, H. ¨Oberg, J. Li, M.P. Ljungberg, A. Matsuda, H. Ogasawara, A. Nilsson, L.G.M.
Pettersson and H. ¨Ostr¨om J. Chem. Phys. 136, 034702 (2012).
22M. Leetmaa, M.P. Ljungberg, A. Lyubartsev, A. Nilsson and L.G.M. Pettersson, J.
Elec-tron Spectrosc. Relat. Phenom. 177, 135-157 (2010).
23T. Tokushima, Y. Harada, Y. Horikawa, O. Takahashi, Y. Senba, H. Ohashif, L.G.M.
Pettersson, A. Nilsson, A. and S. Shin, J. Electron Spectrosc. Relat. Phenom. 177,
192-205 (2010).
24T.E. Meehan, J. McColl and F.P. Larkins, J. Electron Spectrosc. Relat. Phenom. 73,
283-292 (1995).
25T.R. Walsh, T.E. Meehan and F.P. Larkins, J. Phys. B.: At. Mol. Opt. Phys.29, 207-220
26M.P. Ljungberg, J.J. Mortensen and L.G.M. Pettersson,J. Electron Spectrosc. Relat.
Phe-nom. 184, 427-439 (2011).
27M.P. Ljungberg, L.G.M. Pettersson and A. Nilsson, J. Chem. Phys. 134, 044513 (2011).
28N.A. Besley and F. Asmuruf, Phys. Chem. Chem. Phys. 12, 12024-12039 (2010).
29N.A. Besley, Chem. Phys. Lett. 542, 42-46 (2012).
30J.D. Wadey and N.A. Besley, J. Chem. Theory Comput. 10, 4557-4564 (2014).
31O.V. Ershova and N.A. Besley, Chem. Phys. Lett. 513, 179-183 (2011).
32S. Hirata and M. Head-Gordon, Chem. Phys. Lett. 314, 291-299 (1999).
33Y. Zhang, S. Mukamel, M. Khalil and N. Govind, J. Chem. Theory Comput.11, 5804-5809
(2015).
34T.Noro, M. Sekiya and T. Koga, Theor. Chem. Acc. 131, 1124 (2012).
35A. Nakata, Y. Imamura, T. Ostuka and H. Nakai, J. Chem. Phys. 124, 094105 (2006).
36A. Nakata, Y. Imamura and H. Nakai, J. Chem. Theory Comput. 3, 1295-1305 (2007).
37N.A. Besley and A. Noble, J. Phys. Chem. C 111, 3333-3400 (2007).
38N.A. Besley, M.J.G. Peach and D.J. Tozer, Phys. Chem. Chem. Phys. 11, 10350-10358
(2009).
39A.T.B. Gilbert, N.A. Besley and P.M.W. Gill,J. Phys. Chem. A112, 13164-13171 (2008).
40N.A. Besley, A.T.B. Gilbert and P.M.W. Gill, J. Chem. Phys. 130, 124308 (2009).
41F.A. Asmuruf and N.A. Besley, Chem. Phys. Lett. 463, 267-271 (2008).
42A.D. Becke, J. Chem. Phys. 98, 5648-5652 (1993).
43P.J. Stephens, F.J. Devlin, C.F. Chabalowski and M.J. Frisch, J. Phys. Chem.98,
11623-11627 (1994).
44A.D. Becke, Phys. Rev. A 38, 3098-3100 (1988).
45J.P. Perdew, Phys. Rev. B 37, 785 (1986).
46C.T. Lee, W.T. Yang and R.G. Parr, Phys. Rev. B 37, 785-789 (1988).
47P.A.M. Dirac, Proc. Cam. Phil. Soc. 26, 376-385 (1930).
48S.H. Vosko, L. Wilk and M. Nusair, Can. J. Phys. 58, 1200-1211 (1980).
49R. Krishan, J.S. Binkley, R. Seeger and J.A. Pople, J. Chem. Phys. 72, 650-654 (1980).
50T.H. Dunning Jr., J. Chem. Phys. 90, 1007-1023 (1989).
51A. Schafer, H. Horn and R. Ahlrichs, J. Chem. Phys. 97, 2571-2577 (1992).
52D.E. Woon and T.H. Dunning Jr., J. Chem. Phys. 98, 1358-1371 (1993).
54Y. Shao, Z. Gan, E. Epifanovsky, A.T.B. Gilbert, M. Wormit, J. Kussmann, A.W. Lange,
A. Behn, J. Deng, X. Feng, et al. Mol. Phys. 113, 184-215 (2005).
55F. deGroot, Coord. Chem. Rev. 249, 31-63 (2005).
56D. Robinson and N.A. Besley, Phys. Chem. Chem. Phys. 12, 9667-9676 (2010).
57N.A. Besley and D. Robinson, Faraday Discussions 148, 55-70 (2011).
58M. Schindler and W. Kutzelnigg, J. Chem. Phys. 76, 1919-1933 (1982).
59S. Bernadotte, A.J. Atkins and C.R. Jacob, J. Chem. Phys. 137, 204106 (2012).
60G. Capano, T.J. Penfold, N.A. Besley, C.J. Milne, M. Reinhard, H. Rittmann-Frank, P.
Glatzel, R. Abela, U. Rothlisberger, M. Chergui and I. Tavernelli, Chem. Phys. Lett.580,
![TABLE I. Variation in the computed emission energies with functional and basis set for [MnO4]1−.](https://thumb-us.123doks.com/thumbv2/123dok_us/8657621.374653/9.612.195.419.67.512/table-variation-computed-emission-energies-functional-basis-mno.webp)
![FIG. 1. Experimental and computed X-ray emission spectra for [MnO4]1− with various exchange-](https://thumb-us.123doks.com/thumbv2/123dok_us/8657621.374653/11.612.116.493.81.388/fig-experimental-computed-emission-spectra-mno-various-exchange.webp)

![FIG. 2.Experimental and computed X-ray emission spectra for [MnN(CN)4]2− with various](https://thumb-us.123doks.com/thumbv2/123dok_us/8657621.374653/13.612.110.505.83.383/fig-experimental-computed-ray-emission-spectra-mnn-various.webp)
![FIG. 4.Experimental and computed X-ray emission spectra for [Cr(NH3)6]3+ with various](https://thumb-us.123doks.com/thumbv2/123dok_us/8657621.374653/15.612.103.503.78.379/fig-experimental-computed-ray-emission-spectra-cr-various.webp)