Detecting and Explaining Crisis
Rohan Kshirsagar Columbia University [email protected]
Robert Morris Koko
Samuel R. Bowman Center for Data Science and Department of Linguistics
New York University [email protected]
Abstract
Individuals on social media may reveal themselves to be in various states of cri-sis (e.g. suicide, self-harm, abuse, or eat-ing disorders). Detecteat-ing crisis from social media text automatically and accurately can have profound consequences.
However, detecting a general state of cri-sis without explaining why has limited ap-plications. An explanation in this context is a coherent, concise subset of the text that rationalizes the crisis detection. We explore several methods to detect and ex-plain crisis using a combination of neu-ral and non-neuneu-ral techniques. We eval-uate these techniques on a unique data set obtained from Koko, an anonymous emo-tional support network available through various messaging applications. We anno-tate a small subset of the samples labeled with crisis with corresponding explana-tions. Our best technique significantly out-performs the baseline for detection and ex-planation.
1 Introduction
Approximately one person dies by suicide every 40 seconds (WHO,2016). It accounts for approxi-mately 1.5 % of all deaths, and is the second lead-ing cause of death among young adults (WHO, 2016). There are indications that for each adult who dies of suicide there may have been more than 20 others attempting suicide (WHO, 2016). Closely tied to suicide are self-harm, eating disor-ders, and physical abuse. 13 to 23% of adolescents engage in self-injury at some point (Jacobson and Gould,2007). In the United States, about 7 mil-lion females and 1 milmil-lion males suffer from eat-ing disorders annually (Simon,2013) and an
aver-age of 20 people are physically abused by intimate partners every minute (NCADV,2015). Self-harm victims are more likely to die by suicide by an or-der of magnitude (Anthony Bateman,2014). Ad-ditionally, eating disorders and physical abuse in-crease the risk of suicide (Simon,2013;NCADV, 2015).
We identify all of these phenomena (suicide, self-harm, eating disorders, physical abuse), with the term crisis. Someone who is in crisis is likely in need of some form of immediate support, be it intervention, therapy, or emergency. Roughly a third of people who think about suicide make a plan; 72% of those who report making a sui-cide plan actually make an attempt (Kessler et al., 1999).
Accurate, automatic detection of someone in crisis in social media, messaging applications, and voice assistants has profound consequences. A crisis classifier can enable positive outcomes by enabling human outreach at earlier stages, and res-cues at later stages.
In many ways, however, it can still fall short of a human detector, by way of lacking an explanation or rationale of why classifier detected crisis. The factors that explain why someone is in crisis can range from suicidal ideation to eating disorders, from self-harm to sexual abuse.
In crisis situations, triage can improve if the de-tection system can explain why the person is cri-sis. Someone who is about to die by suicide via overdose should receive a different response than someone who is considering anorexia
due to self-image issues. Population level surveillance, diagnostics, and statistics are much improved due to factor based explanation. Fi-nally, in human-in-the-loop crisis systems, the hu-man responder can better sift through information if the factors of crisis were visually highlighted through automated means (Dinakar et al., 2014).
With the rise of complex neural models in clas-sification tasks, we’ve seen gains in accuracy at the cost of transparency and interpretability (Kuhn and Johnson,2013). In this work, we present mod-els that we validate both for their raw accuracy and for the quality of their explanations. Validating a model’s explanations, in addition to its detection performance, can improve interpretability in the model. In summation, automatically generating explanations for crisis detection scales and pays off in many ways.
While we evaluate our models’ explanations against human reference explanations, it is not practical to collect enough explanations to train these models on such data. Collecting an expla-nation requires an annotator to write free text or to highlight text for every case of crisis, sometimes more than once for a post (e.g. for a sexual abuse victim considering suicide), while merely identi-fying crisis is a simple binary decision task that can be performed much more quickly and cheaply. In this paper, we explore the problem of gener-ating explanations for crisis without explicit super-vision using modern representation learning tech-niques. We demonstrate our success comparing our proposed models with a variety of explana-tory methods and models on a rationale-labeled test set. We evaluate the generated explanations through ROUGE metrics against human-produced references. In addition, we show detection perfor-mance that outperforms prior methods.
2 Related Work
Detecting Crisis Wood et al. (2016) identify 125 Twitter users who publicly state their suicide attempt online on a specific date and have tweets preceding the suicide attempt. They artificially balance these tweets using data from random users who are assumed to be neurotypical, acknowledg-ing that this data will be contaminated with users who also ideate and attempt suicide. They train simple, linear classifiers that show promise in de-tecting these suicidal users and discuss the diffi-culties of realizing this technology, highlighting privacy and intervention concerns. In our work, we attempt detection and explanation on phenom-ena that includes but is not limited to suicide on a dataset that is significantly larger and not artifi-cially balanced. However, we do not incorporate the record of suicide attempt as signal when label-ing.
Gkotsis et al. (2016) operate on a filtered sub-set of mental health records to determine whether a mention of suicide is affirmed or negated. They do classification on mental health records, which are filtered by thesuicid*keyword. The goal of their work was the development of improved information retrieval systems for clinicians and re-searchers, with a specific focus on suicide risk as-sessment. Thus, the domain is constrained. Their work also differs from ours significantly in its technical execution. Rather than use neural net-work classifiers, they use probabilistic context free grammars to execute negation detection. This task is quite different than ours, both in dataset and ap-proach, and is most likely not applicable to open-domain social media text. They also do not aim to or need to provide explainable detections, as men-tions of suicide are clearly present in all of their data and negation detection is sufficient ’rationale’ for affirming or negating that mention.
Tong et al. (2014) annotate Twitter data for suicide-risk with the level of distress as the label and achieve high inter-annotator agreement. They use a combination of specialized keyword search and LIWC sadness scores (Pennebaker et al., 2001) to filter 2.5 million tweets down to 2000 in order to make the annotation task tractable. Our source dataset, which we introduce in the next sec-tion, has a significantly higher base rate of crisis; thus, no filtering is necessary. They train SVM classifiers on bag of n-grams to detect distress on different subsets of annotations, but do not explore neural classifiers, nor unsupervised explanations of detections.
Lehrman et al. (2012) and O’Dea et al.(2015) also detect distress on small datasets using sim-ple classifiers.Lehrman et al.(2012) annotate 200 samples for distress level and discretize counts re-lated to bag of word, part of speech, sentence com-plexity and sentiment word features to train a va-riety of multiclass classifiers. O’Dea et al.(2015) annotated nearly 2000 tweets for different levels of suicidality and used word counts as features, filtered by document frequency. In our work, we compare neural techniques against linear models trained on word frequency counts both for detec-tion and explanadetec-tion as a baseline. Due to the rel-atively large amount of data in our training set, we do not use any custom features for the baseline.
de-pression at all and 2) classify the specific depres-sive symptom if depression was detected. This is a kind of explanation in that it directly detects one of three symptoms of depression (fatigue, disturbed sleep, depressed mood). However, their data is explicitly annotated for these sub-factors, whereas our data is not. 1,656 tweets in their dataset were annotated with specific depressive symptoms.
Interpretable Neural Networks In the past few years, neural attention mechanisms over words (Bahdanau et al.,2014) have led to improvements in performance and interpretability in a range of tasks, such as translation (Bahdanau) and natu-ral language inference (Rockt¨aschel et al.,2015). These models induce a soft alignment between two sequences with the primary aim of using it to remove an information bottleneck, but this align-ment can be also be used quite effectively to visu-alize which inputs drive model behavior.
Lei et al. (2016) present a more direct method for training interpretable text classifiers. Their model is also trained end-to-end, but instead of in-ducing a soft weighting, it extracts a set of short subspans of each input text that are meant to serve as sufficient evidence for the final model decision. In another work with similar goals,Ribeiro et al. (2016) introduce a model agnostic framework for intepretability, LIME, that learns an interpretable model over a given sample input that is locally faithful to the original trained model.
3 Methods
Our training set consists of N examples
{Xi, Yi}N
i=1 where the input Xi is a sequence of tokens w1, w2, ..., wT, and the output Yi is a binary indicator of crisis.
3.1 Word Embeddings
Each token in the input is mapped to an embed-ding. We use reference GloVe embeddings trained on Twitter data (Pennington et al.,2014). We used the 200 dimensional embeddings for all our exper-iments, so each wordwtis mapped toxt ∈ R200. We denote the full embedded sequence asx1:T.
3.2 Recurrent Neural Networks
A recurrent neural network (RNN) extends on a traditional neural network to recursively encode a sequence of vectors,x1:T, into a sequence of hid-den states. The hidhid-den state of the RNN att−1is
fed back into the RNN for the next time step.
ht=f(xt, ht−1; Θ)
This allows the network to construct a representa-tion incrementally as it reads the input sequence. In particular, we encode the sequence using a gated recurrent unit (GRU;Cho et al.,2014) RNN. The GRU employs an update gateztand reset gate rtthat are used to compute the next hidden stateht
ht= (1−zt)ht−1+zt˜ht zt=σ(Wzxt+Uzht−1)
˜
ht=tanh(Wxt+U(rtht−1)) rt=σ(Wrxt+Urht−1)
We use a bidirectional RNN (running one model in each direction) and concatenate the hidden states of each model for each word to obtain a contextual word representationhbi
t.
3.3 Attention over Words
With attention, a scoring function scores the rele-vance of each contextual word representationhbi
t. We employ the unconditional attention mecha-nism used to do document classification employed byYang et al.(2016).
ut=tanh(Wwhbit +bw) αt= Pexput
t exput d=X
t αtht
The attention mechanism serves two purposes. d acts as a contextual document representation which can be fed into a downstream model com-ponent for detection. In addition, the score vec-toru1:N, can be utilized to seed our explanation, which will be expanded on in a following sec-tion. Optionally for detection, we encode the doc-ument by using the last hidden state of a single for-ward GRU, without the reverse GRU and attention mechanism. Both encoding schemes are evaluated in our experiments.
3.4 Training Objective
the probability of crisis. We minimize the logistic loss objective during training.
l(y, p) =−ylog(p)−(1−y)log(1−p)
whereyis the true value andpis the output of the logistic output layer.
3.5 Seeding the Explanations
Our next goal is to generate explanations given the inputs and outputs for our trained model. We do this by building a subset of words which ‘seed’ the explanation generation function. The explanation generation function is fixed while testing across all seeding techniques, thus allowing extensibility by modularizing the seed function using a relevant model. The seed function is meant to give a set of tokens from the input that most influenced the prediction, thus sewing the initial stitches of the explanation. For the task of detecting crisis, de-scriptive content words, such as adjectives, nouns, and verbs, are desirable compared to stop words or punctuation.
We test three techniques of seeding words for a given input: (1) Using the magnitudes of activated coefficients in a logistic regression model. This acts as our baseline. (2) Using the distribution of attention from our neural model. (3) Using LIME, which can generate words that led to a prediction for any model. Each seed function is passed in the number of seed words to return, k. This al-lows us to maintain similar output behavior for all three techniques; it also allows us to extend the seed functions to more complex models. We will now detail how seeding works for each of these mechanisms.
1. Logistic Coefficients: Logistic regression is a linear model that learns a vector of weights for a fixed set of features to detect in binary classification. As a baseline, we train a lo-gistic regression model on unigrams to learn a vector of weights for each word in the vo-cabulary. For our seed function, we find the kmost highly-weighted activated features ac-cording to the model. A feature is activated if the word occurs in the given input.
2. Neural Attention: In this setting, we select seeds by sorting the words by their atten-tion weightsu. In order to get human inter-pretable scores for attention, we introduced
a configurable dial to control how attention was distributed over the input by introducing an L2 penalty on the output of the attention.
3. LIME: The LIME API contains a
num features parameter in the
explain instance function. Each
explanation will then result in learning an interpretable model, which can be used to then seed the explanation. The LIME API is applied to both models, the baseline logistic and the neural model.
3.6 Explanation Generation Algorithm We use a novel algorithm for producing expla-nations that depends on seeds from a separately-developed seeding module. The algorithm acts on the input text and the kexplanation seeds. It works as follows. First, the sentence of impor-tance is identified by taking the sentence with the most seeds. The identified sentence is then parsed with a dependency parser (Honnibal and Johnson, 2015), and traversed from the root to find the high-est seed in the sentence. If the highhigh-est seed token is not a verb and not the head of the entire sen-tence, we then traverse to the seed’s head node. Subsequently, the subtree phrase of the highest seed is used for the explanation. Since the parse is projective, the subtree is necessarily a contigu-ous sequence of tokens.
4 Experiments 4.1 Training Data
Koko has an anonymous peer-to-peer therapy net-work based on an clinical trial at MIT (Morris et al., 2015), which is made available through chatbots on a variety of social media platforms in-cluding Facebook, Kik, and Tumblr. They pro-vided us with our training data through a research partnership. The posts on the platform gener-ally come from users who are experiencing neg-ative thoughts and need some form of emotional support. Each post is on average 3.1 sentences long with a standard deviation of 1.7 sentences. The training set is roughly 106,000 binary labeled posts (crisis or not).
iter-Figure 1: Visualizing Attention for crisis.
ations of small batches of data to improve inter-annotator agreement. Using a minimum of three labelers per sample, they achieve over 95% inter-annotator agreement.
Because the platform is a support network, the rates of depression and other mental disorders are high: the annotation task identified roughly 20% of the training data as crisis. This is in contrast to previous work using Twitter data, where multiple layers of filtering are required to get a reasonable sample of distress (Tong et al.,2014). Our dataset requires no filtering and estimates the natural dis-tribution of the platform.
4.2 Explanation data
We have select a set of 1242 labeled posts as our test set. Of these, 200 are labeled crisis. We anno-tate the 200 crisis samples with their correspond-ing explanations. An explanation is a phrase or clause in the post that most strongly identifies the rationale behind the crisis label. When selecting the explanation, we aim for them to be accurate, coherent, and concise.
4.3 Model Configuration and Training We tokenize the data using Spacy (Honnibal and Johnson,2015). We do not fine-tune the pretrained GloVe embeddings, but rather learn a simple em-bedding transformation matrix that intervenes be-tween the embeddings and the RNNs. We use 200 dimensional embeddings and 100 dimensional for-ward and backfor-ward GRUs (yielding 200 dimen-sional contextual representations). We apply an L2 penalty on the attention output usingλ = .0001. We pad each input to 150 words. We train us-ing RMSprop with a learnus-ing rate of .001 and a batch size of 256. We add dropout with a drop
rate of 0.1 in the final layer before detecting to re-duce overfitting. We determined the dropout rate, batch size, and input length empirically through random hyperparameter search and determinedλ for the attention penalty using human evaluation. We use the best model from 20 epochs of training selected using a validation sample of 10% of the source data (excluding the test data).
5 Results and Discussion 5.1 Detection Evaluation
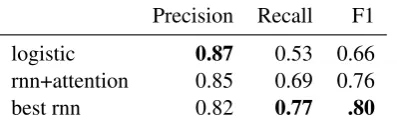
The neural models significantly outperform the lo-gistic model in detection accuracy (Table 1), with the best neural model achieving a .80 F1 on the crisis detections, compared to .66 for the logis-tic model. The neural attention model achieves a .76 F1 score, which is still significantly better than the linear baseline. The best model does not have an attention penultimate layer, bur rather a single feedforward GRU layer.
5.2 Attention Visualization
[image:5.595.75.523.63.200.2]Precision Recall F1 logistic 0.87 0.53 0.66 rnn+attention 0.85 0.69 0.76 best rnn 0.82 0.77 .80
Table 1: Crisis Detection Performance on Test Data
attention is focused around the final clause, and is not concentrated entirely on one word. As one would expect, “i cut myself” fetches the highest weight in the attention distribution. The second visualization shows singular attention on the word ‘suicide’, thus placing markedly less importance on the rest of the input. This differentiation be-tween background information and crisis signal provides a reassuring signal that the model is using reasonable features.
5.3 Qualitative Explanation Results
Interestingly, all of the techniques resulted in sev-eral high quality explanations. We surveyed about 20 samples and for each one, at least one of the seeding functions contained the correct explana-tion. Surprisingly, the logistic baseline performed quite well in this capacity. In Table 2, we show an example where all of the techniques got the identical result. This is likely due to the predic-tive power of the phrase ‘kill myself’. In many cases, the generated explanation contained more text than is necessary to accurately capture the gold explanation. The second example (Table 2) shows this in the neural+attention technique. This may suggest room for improvement in the expla-nation generation technique. The third example shows a difficult case in which the majority of the text is background information and only the last word of the input is included in the gold explana-tion. We see that both neural models and logis-tic+LIME are successful in capturing roughly the correct explanation.
5.4 Quantitative Explanation Results
We evaluate the generated explanations using ROUGE-1 and ROUGE-2 (Lin, 2004), which measure the overlapping units (unigrams and bi-grams respectively) of the generated text and refer-ence texts. In Table 3 and 4, the average ROUGE-1 and ROUGE-2 scores for the generated expla-nations are listed for each model and seed
strat-Text Im really lonely and i want someone who loves me cares for me and i love (ima guy) i want to kill myself because i cant get a girlfriend
Gold kill myself logistic+coef to kill myself logistic+LIME to kill myself neural+attentionto kill myself neural+LIME to kill myself
Text I have to face many changes in the next few months but I’m not ready. Instead I hide in fast food and tv shows. I’m scared that my depres-sion will come back and turn to suicidal thoughts.. Big changes ahead make me wor-ried about suicidal thoughts overwhelming me so I hide. Gold suicidal thoughts
logistic+coef Big changes ahead
logistic+LIME I have to face many changes in the next few months but I’m not ready.
neural+attentionabout suicidal thoughts over-whelming me so I hide neural+LIME suicidal thoughts
Text My parents want me to be a perfect child but I have de-pression and anxiety. Suicide Gold Suicide
logistic+coef me to be a perfect child logistic+LIME me to be a perfect child neural+attentionI have depression and
anxi-ety. Suicide
neural+LIME I have depression and anxi-ety.
Text Everyone at school is call-ing me a nerd,bitch,loser etc... The problem is that I’m starting to believe them and lately I’ve started cut-ting..I’m gonna go insane or lose myself
Gold I’ve started cutting
logistic+coef Everyone at school is calling me a nerd, bitch, loser etc.. logistic+LIME cutting
[image:6.595.304.525.69.782.2]Precision Recall F1 logistic+coef 0.358 0.590 0.396 logistic+LIME 0.409 0.610 0.432 neural+attention 0.360 0.605 0.406 neural+LIME 0.492 0.745 0.536
Table 3: ROUGE-1 Scores
Precision Recall F1 logistic+coef 0.267 0.475 0.289 logistic+LIME 0.301 0.478 0.311 neural+attention 0.286 0.485 0.309 neural+LIME 0.397 0.615 0.413
Table 4: ROUGE-2 Scores
egy. By a large margin, the neural classifier1 in conjunction with the LIME seed function outper-formed the rest of the models. In ROUGE-2 eval-uation, it beats the next best average F1 score by a margin of 10 points and in ROUGE-1 evalua-tion, it beats the next best average F1 by 12 points. Since LIME directly determines which input most influences the prediction, while attention does so only indirectly, this result makes sense. However, the LIME seeding function is the slowest approach we consider, taking up to a minute to generate a explanation. The neural attention seeding is neg-ligible in contrast to this. In Table 3, the ROUGE Metrics show similar performance for the baseline logistic model and the neural model. However, in Table 1, we see that detection output is much better for the neural models. This suggests that though the logistic regression is quite reasonable in ranking features by weights, it fails to capture subtleties and dependencies in a sequence that an RNN captures. Thus, neural+attention is a better choice between the two. The logistic+LIME out-performs the baseline by 5 points in precision for ROUGE-1 and around 3.5 points in precision for ROUGE-2. This exemplifies the efficacy of LIME, which is tuned for the individual example, rather than the model coefficients, which are tuned for the training data.
6 Conclusion
In this paper, we present and compare explanation-oriented methods for the detection of crisis in so-1We use the RNN with attention in this result. The for-ward RNN in conjunction with LIME showed nearly identi-cal ROUGE performance.
cial media text. We introduce a modular approach to generating explanations and make use of neural techniques that significantly outperform our base-line. The best models presented are both effec-tive at detection and produce explanations simi-lar to those produced by human annotators. We find this exciting for two reasons: Within the do-main of crisis identification, successes in explana-tion help to build the trust in trained models that is necessary to deploy them in such a sensitive con-text. Looking beyond this, we expect that our tech-niques may generalize to text classification more broadly. In the future experiments, we hope to ex-plore human evaluation of the generated explana-tions as an indicator of trust in the model, to in-vestigate compression-based approaches to expla-nation (Lei et al.,2016), and to consider richer ar-chitectures for text classification.
Acknowledgments
We thank the anonymous reviewers and Ka-reem Kouddous for their feedback. Bowman ac-knowledges support from a Google Faculty Re-search Award and gifts from Tencent Holdings and NVIDIA Corporation. We thank Koko for con-tributing a unique dataset for this research.
References
Philip Timms Jim Bolton Anthony Bateman. 2014. Self-harm: key facts. [Online; accessed 6-April-2017].
Dzmitry Bahdanau, Kyunghyun Cho, and Yoshua Ben-gio. 2014. Neural machine translation by jointly learning to align and translate. arXiv preprint
arXiv:1409.0473.
Kyunghyun Cho, Bart Van Merri¨enboer, Caglar Gul-cehre, Dzmitry Bahdanau, Fethi Bougares, Holger Schwenk, and Yoshua Bengio. 2014. Learning phrase representations using rnn encoder-decoder for statistical machine translation. arXiv preprint
arXiv:1406.1078.
Karthik Dinakar, Allison JB Chaney, Henry Lieber-man, and David M Blei. 2014. Real-time topic mod-els for crisis counseling. In Twentieth ACM Con-ference on Knowledge Discovery and Data Mining,
Data Science for the Social Good Workshop.
Matthew Honnibal and Mark Johnson. 2015. An improved non-monotonic transition system for de-pendency parsing. In Proceedings of the 2015 Conference on Empirical Methods in Natural
Lan-guage Processing. Association for Computational
Linguistics, Lisbon, Portugal, pages 1373–1378. https://aclweb.org/anthology/D/D15/D15-1162. Colleen M Jacobson and Madelyn Gould. 2007. The
epidemiology and phenomenology of non-suicidal self-injurious behavior among adolescents: A crit-ical review of the literature. Archives of Suicide
Re-search11(2):129–147.
Ronald C Kessler, Guilherme Borges, and Ellen E Wal-ters. 1999. Prevalence of and risk factors for lifetime suicide attempts in the national comorbidity survey.
Archives of general psychiatry56(7):617–626. Max Kuhn and Kjell Johnson. 2013. Applied predictive
modeling, volume 26. Springer.
Michael Thaul Lehrman, Cecilia Ovesdotter Alm, and Rub´en A Proano. 2012. Detecting distressed and non-distressed affect states in short forum texts. In
Proceedings of the Second Workshop on Language in Social Media. Association for Computational Lin-guistics, pages 9–18.
Tao Lei, Regina Barzilay, and Tommi Jaakkola. 2016. Rationalizing neural predictions. arXiv preprint
arXiv:1606.04155.
Chin-Yew Lin. 2004. Rouge: A package for auto-matic evaluation of summaries. InText summariza-tion branches out: Proceedings of the ACL-04 work-shop. Barcelona, Spain, volume 8.
Robert R Morris, Stephen M Schueller, and Ros-alind W Picard. 2015. Efficacy of a web-based, crowdsourced peer-to-peer cognitive reap-praisal platform for depression: Randomized con-trolled trial. Journal of medical Internet research
17(3):e72.
Danielle Mowery, Albert Park, Mike Conway, and Craig Bryan. 2016. Towards automatically classify-ing depressive symptoms from twitter data for pop-ulation health. In Proceedings of the Workshop on Computational Modeling of Peoples Opinions, Per-sonality, and Emotions in Social Media. pages 182– 191.
NCADV. 2015. Domestic violence national statistics. [Online; accessed 6-April-2017]. http://ncadv.org/images/Domestic Violence.pdf. Bridianne O’Dea, Stephen Wan, Philip J Batterham,
Alison L Calear, Cecile Paris, and Helen Chris-tensen. 2015. Detecting suicidality on twitter. In-ternet Interventions2(2):183–188.
James W Pennebaker, Martha E Francis, and Roger J Booth. 2001. Linguistic inquiry and word count: Liwc 2001. Mahway: Lawrence Erlbaum
Asso-ciates71(2001):2001.
Jeffrey Pennington, Richard Socher, and Christo-pher D. Manning. 2014. Glove: Global vectors for word representation. InEmpirical Methods in
Nat-ural Language Processing (EMNLP). pages 1532–
1543.http://www.aclweb.org/anthology/D14-1162. Marco Tulio Ribeiro, Sameer Singh, and Carlos
Guestrin. 2016. Why should i trust you?: Explain-ing the predictions of any classifier. InProceedings of the 22nd ACM SIGKDD International Conference
on Knowledge Discovery and Data Mining. ACM,
pages 1135–1144.
Tim Rockt¨aschel, Edward Grefenstette, Karl Moritz Hermann, Tom´aˇs Koˇcisk`y, and Phil Blunsom. 2015. Reasoning about entailment with neural attention.
arXiv preprint arXiv:1509.06664.
Harvey Simon. 2013. Eating
disor-ders. [Online; accessed 6-April-2017]. http://umm.edu/health/medical/reports/articles/eating-disorders.
Christopher M Homan1 Ravdeep Johar Tong, Liu1 Megan Lytle2 Vincent Silenzio Cecilia, and O Alm. 2014. Toward macro-insights for suicide preven-tion: Analyzing fine-grained distress at scale. ACL 2014page 107.
WHO. 2016. Mental health suicide data. [Online; ac-cessed 6-April-2017].
Anthony Wood, Jessica Shiffman, Ryan Leary, and Glen Coppersmith. 2016. Language signals pre-ceding suicide attempts. CHI 2016 Computing and Mental Health Workshop, San Jose, CA.
Zichao Yang, Diyi Yang, Chris Dyer, Xiaodong He, Alex Smola, and Eduard Hovy. 2016. Hierarchical attention networks for document classification. In