W
Abstract
The purpose Algorithm m tower is calc means of GA optimized.
Keywords:M
1. Introduc
The cost of wi of the total in mization of m crucial job fo turbines are i from the aspe tured in 20-3 bolted each ot are manufactu towers have a in general. Su material. The from the tow foundation. Th Dynamic load constantly by tower is base height. Additi fied with adeq not exceeded be prevented. evaluate as p tower is assu region in Turk tower hub hei and the base d
Wind Tu
Requ
Faculty of A E-m Receiv
of this study method (GA). ulated within A codes. The
Mass Optimiz
ction
ind turbine tow vestment cost mass of wind tu
for last two d installed with ect of aesthetic 30 meters lon ther on site [1] ured as the tap
conical shape uch designs inc tower of win wer head and
he main load ding is genera y blade tower ed on the tow
ional design re quate strength and for conica The existing per analysis a umed to be lo key with 52 m ight. The top diameter tower
rbine T
iremen
S Aeronautics and mail: serdar.yild ved February
y is to optim In accordanc n the highest e stifness alon
zation, Geneti
wers can amou for wind ener urbine tower ha decades. Most tubular conic cs. They are id ng welded sec ]. Steel tubular ered steel tow
with a wider b crease their stre
nd turbine ga transmits thes is the axial lo ated by wind
interaction. T er top weight equirements h since admissi al towers, shel pre-sized tow and design co ocated in Balı
m tower height diameter of to r is 4.3 m.
Tower O
nts by U
Serdar Yıldı
d Astronautics dirim-2@postg 24,2010; revis
mize the mass ce with ASCE
safety condit ng tower is e
ic Algorithm
unt nearly 20-2 rgy plant. Min as become mor t modern win cal steel tower deally manufac ctions and the r conical tower er namely thes base than the to ength and save athers net load se loads to th ad on the roto turbulence an The stiffness o
t and the towe have to be sati
ible stresses ar l buckling mu wer is tackled t
onditions. Ste
ıkesir-Bandırm and the 54.7 m ower is 2.56 m
Optimiz
Using Ge
ırım, İbrahim s, Istanbul Tec
grad.manches sed April 7,20
of 1.5 MW E 7-98, AISC tions against b ensured entir
, Wind Turbi
25% ni- re nd rs c- en rs se op es ds he or. nd of er s- re ust to el ma m m
2. Allo
The ste the AIS sign m steel tu for the ried ou bending which t is typic Fv is 0 represewhere
= 2 for the leng The ma
zation u
enetic A
m Özkol chnical Univers ter.ac.uk, ozko 010; accepted Awind turbine C-89 and IEC buckling stre rely while the
ine Tower
owable Stre
eel towers are p SC strength d method (ASD) ubular tower de service load ( ut with refere g stress Fb fo the yielding st cally 345 MPa 0.4 Fy. The a ented by the fo
5 3 Fa
(KL) r is the r the cantileve gth of the towe aterial coeffici
under V
Algorith
sity, Istanbul, [email protected]
April 11,2010
e steel tower C61400-1 , th
ngth of each e mass of tow
ess Design (
primarily desig design criteria.
is used in lie esign. The loa (characteristic ence to ASCE or noncompact tress Fy of the a (50 ksi). The
allowable com llowing formu 2 2 ( ) 1 2
3( ) (
8 8 c c L K r . .C L K K r C
e slenderness r
er type of stru er and radius o ent Cc is calc
2
2
c
.π .E C Fy
Various
hm
Turkey 0 performing e impact of l sections of to wer is mitiga(ASD)
gned and sized . Allowable st eu of AISC-89 d combination load) conditio E-7-98. The a t section is 0. steel tubular s
allowable she mpression stres ula [2]: 3 3 ) 8 c .Fy L K r C
ratio of steel t
cture, and L a of section, resp
culated by: Genetic loads on ower by ated and
d to meet tress de-9 for the n method on is
car-llowable 6 Fy, in structure ear stress ss Fa is
(1)
tower, K
and r are pectively.
where E is the steel modulus. When KL/r is greater than c
C , the allowable compression stress Fa shall be recal-culated by:
2 2
12
23 ( ) .π .E Fa
L . K
r
(3)
Typically, the ratio of the applied axial compression stress fa to the allowable compression stress Fa of the steel tower is less than 0.15. The combined stress for the applied bending stress fb acting on the steel tower shall be satisfied with interaction equation.
1 fa fb
FaFb (4)
The applied shear stress fv from the torsion and the shear force on the tower shall also be less than the al-lowable shear stress Fv [2].
3. Fatigue Load
The DEL (Damage Equivalent Load) method facilitates to determine the steel tower preliminary dimensions in any circumstances which fatigue load histogram data does not exist. The SN curve for the DEL method can be expressed in the following [2]:
80
2 106 n loglog σs n loglog MPam
(5)
The number of cycles corresponding to the withstand limit along the tower height z can be calculated by using DEL method.
m 0rmax
Mf z N z
σ S z . N
(6)
where:
( )
Mf z is the moment produced by the fatigue DEL thrust along steel tower. S z
is the section modulus that varies along the height of tower. σrmax is the maximum allowable stress range at N0 cycles(typi-cally 104) . m is the slope of the curve [2].
3.1. Damage Equivalent Load for Steel Tower
There are many fatigue calculation methods. One of which is DEL method in most cases where the full histo-gram of fatigue cycles is available but only a DEL speci-fied. The DEL is added by a value of SNslope (m = 4 used in this circumstance and a number of cycles (Ne)).
Total moment range along the tower is calculated as follows:
max max , max max , ,
max max ,
Mx yT Mx yB z
Mx y z
h Mx yB
(7) max(∆Mx,yT) = Maximum moment range at tower top x or y direction .
max(∆Mx,yB) = Maximum moment range at tower base x or y direction.
Safety Factor of DEL is 1.0.
Consequence failure factor and material factor: γsd.γm = 1.15 1.1 = 1.265
Number of cycles:5.29 10 for 1.5 MW turbine 8
This represents a 20 year lifetime.
4. Local Buckling Stress
The strength of the tubular steel tower in axial compres-sion is the lesser of the yield strength and the elastic crit-ical buckling stress σcr is calculated:
0.605
cr
t
σ E.
r
(8) where r is the cylinder radius and t is the wall thickness. However, the presence of imperfections, particularly those introduced by welding, will significantly reduce the tower wall resistance to buckling. As per steel tower design, the reduction coefficient α for axial load is found by:
0
0.83
1 0.01 212
0.70
212 0.1 0.01
r r
. if
t t
α
r if
t r .
t
(9)
The reduction coefficient αB for bending load is cal-culated as follows:
0.1887 0.8113
B o
α α (10) The buckling stress σu can be computed in terms of the yielding stress Fy:
0.6
1 0.4123 2
0.175 2
B cr
u B cr
B cr B cr
Fy Fy if α .σ Fy
a α .σ
Fy if α .σ .α .σ
(11)
The maximum applied stress σa combined with nor-mal stress and shear stress is calculated by σa :
2 3 2a
equa-tion is carried out in accordance with the AISC manual (ASD 9th Edition).
1 0.15 fa fb
fb Fb
FaFb (13)
where:
fa is the applied compression stress Fa is the allowable stress
fb is the applied bending stress Fb is the allowable bending stress.
5. Earthquake Load
This section is based on ASCE 7-98 Earthquake Load Specification. Even though earthquake load seems to be not much significant effect on design of steel tower be-cause of the fact that wind turbine towers are placed in low seismic areas, earthquake load should be taken into consideration so as to be more precise in designing of steel tubular tower (see Figure 1).
The maximum considered earthquake spectral re-sponse acceleration for short periods (SMS) and at 1 second adjusted for site class effects, should be determined by [3]:
1 1
;
MS M
S Fa.Ss S Fv.S (14) where :
Mapped maximum considered earthquake spec-tral response acceleration at a period of 1s as determined in accordance with Section 9.4.1 (ASCE 7-89).
s
S Mapped maximum considered earthquake spec-tral response acceleration at short periods as determined in accordance with Section 9.4.1 (ASCE 7-89).
a
F and Fv are defined in Tables 9.4.1.2.4a and b respectively in accordance with Section 9.4.1 (ASCE 7-89). According to the ASCE 7-89 9.4.1.2.5 design spectral response acceleration at short periods, SDS and at 1s period SD1 shall be determined from Equations 9.4.1.2.5-1 and 9.4.1.2.5-2 respectively:
1 1
2 2
;
3 3
DS MS D M
[image:3.595.318.539.318.429.2]S S S S (15)
Figure 1. Earthquake overturning moment.
From the earthquake geographic map, the maximum considered earthquake (MCE) ground motion for soil site Category B with 5% damping is 1.5 g (Ss) for structures with a short period of 0.2 s and 0.6 g (S1) for structures with a period of 1 s. The wind turbine towers are typi-cally located in open areas away from population centers with very low occupancy. Because, the occupancy im-portance factor (I) is equal to 1.0. Site Classification D is assumed for Balıkesir-Bandırma/ Marmara Region. Site Classification D is typified by stiff soils with shear ve-locity (Vs in soil) typically 600–1,200 fps (183–366 m/s).
2 2
1.0 ; 0.6
3 3
DS s S DI v I
S F S g S F S g (16)
a
F and Fv can be defined according to the ASCE 7-98 Table 9.4.1.2.4a-4b respectively. Fa is the site coefficient as a function of site class and short period MCE. Fv is the site coefficient as a function of site class and a 1 second period MCEg is the acceleration caused by gravity.
0 0
,
0.4 0.6 ,
DI
s
a DS
DS
S
if T T T
T S T S
if T T T
S Otherwise
(17)
/
S DI DS
T S S ;T0 0.2.Ts (18)
T is the structural period.
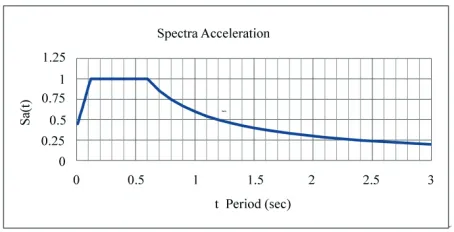
Spectral acceleration response can be found as in Fig-ure 2.
5.1. Design Earthquake Load
The earthquake lateral load affects the whole tower height h as per its weight distribution [2].
h
Head Mass z
W
w z dz W (19) [image:3.595.314.541.576.692.2]w(z) is weight distribution as a function of height. W is the total weight of steel tower with Turbine Head. Base
shear coefficient is,
s
I C T Sa t .
R
(20) I is the importance factor. R is the reduction factor equal to 1.
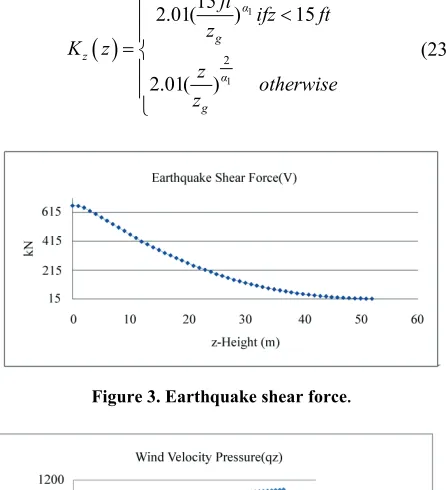
Base Shear is V C T Ws
(Figure 3) (21) The towers are assumed to be located in flat unob-structed area for direct wind exposure Category D where wind flows over the open water and flat terrain.Importance factor is 1.0 for low occupancy concerning the wind turbine erection and installation.
6. Wind Velocity Pressure
The velocity pressure: (Figure 4) 2
2
0.613
z z zt d
N
q K K K V
m
(22)
where:
The topographic factor Kzt is 1.0 for the flat area.
d
K is 0.95 for a round cylinder tower in accordance with Table 6-6in ASCE 7-98.
The terrain exposure coefficient is determined as per Table 6-5 of ASCE 7-98 or by the following formula [3]:
1
1
2
2
15
2.01( ) 15
2.01( )
α
g z
α
g
ft
ifz ft z
K z
z
otherwise z
[image:4.595.60.283.375.620.2](23)
Figure 3. Earthquake shear force.
Figure 4. Wind velocity pressure on tower.
where zg the nominal height of the atmospheric boun-dary layer is 213 m and α1 is 11.5 for exposure D
cat-egory in accordance with ASCE 7-98.
6.1. Direct Wind Load on Tower
The direct wind load on the tower is not only based on the direct wind pressure on the tower but also on the gust factor Gf and the force coefficient Cf .
f
G is calculated by the following equation [2] :
2 2 2 2
1 1.7 0.925
1 1.7
z Q R
f
v z
I g Q g R G
g I
(24)
where
The intensity factor of turbulence :
1/ 6 0.15(33 / )
z
I ft z (25) The background response Q and the resonant response are given in accordance with Eq.6.4 of ASCE 7-98.
0.63 1 1 0.63( )
z
Q
B h L
(26)
where B is the horizontal dimension of tower measured normal to wind direction, Lz is the integral length scale of the turbulence at the equivalent height given by
( / 33 )€ z
L l z ft . l and € are constants listed inTable 6.4 of ASCE 7-98.
R
g and gQ shall be taken as the constant value of 3.4 and gv is given by:
1
1 0.577 2 ln(3600 )
2 ln(3600 )
v
g n
n
(27)
R , the resonant response factor is given by:
1
0.53 0.47
n h B L
R R R R R
β
(28)
1 5/3 1 7.47 (1 10.3 )
n
N R
N
(29)
The force coefficient Cf is determined as per Tables 6-10 of ASCE 7-98. Lateral wind load along the tower is calculated by the direct pressure on the projected area which differs with respect to diameter distribution d(z) of tower . F zz( ) is determined in the following equation.
z z f f
F z q G C d z (Figure 5) (30)
h
z
z
Vz z
F x dx (Figure 6) (31)
( )h z z
Figure 5. Force distributions because of direct wind effect on tower.
Figure 6. Wind shear force along tower.
Figure 7. Wind effect moment along tower.
7. Dynamic Behavior of Steel Tower
Main key consideration in wind turbine design is the avoidance of resonant tower oscillations excited by rotor thrust fluctuations at rotational or blade passing fre-quency. Natural frequency of tower greater than the blade-passing frequency is said to be stiff on the other hand towers natural frequency between rotational fre-quency and blade passing frefre-quency are regarded as soft. If the natural frequency, the tower is said to be soft-soft [4].
3 1.75
0.25
t
t
EIg w
H W Wtow
(33)
where t
w is the estimated natural frequency of the tower is
the height of tower. E and I are elastic modulus and mo-ment of inertia of the tower. Wt and are the weight of head mass and tower mass respectively.The natural frequency in Hz is calculated by: ftwt / 2π
8. Genetic Algorithm Approach
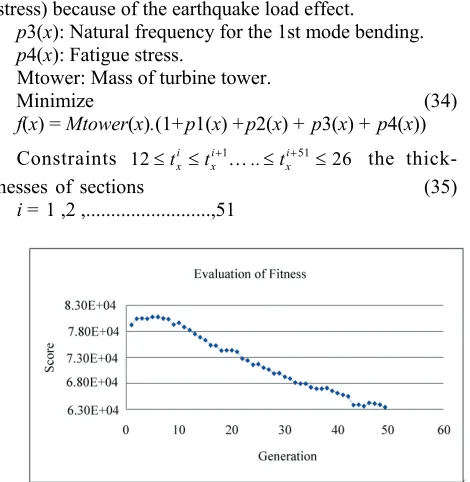
Genetic Algorithms is one of the methods used in opti-mization problems. Particularly, it is based on natural selection. Genetic Algorithms is dependent on that the best generation has to live in nature. Although many ge-netic algorithms have been said with different structures, all of them comprises of three basic operations. Genetic Algorithm uses reproduction, crossover and mutation operators to define fitness and to create new solutions. Reproduction is simply a process to make decision which strings should remain and how many copies of them should be produced in the pool. The decision is made by comparing the fitness of each string. The fitness indicates survival potential and reproduction efficiency of the string in the next generations. For an Optimization prob-lem, the fitness function is the objective function of op-timization problem as shown in Figure 8.
9. Optimization Problem
Optimization problems are generally expressed as given in the following:
p1(x): Margins of safety combined stress (bending stress and shear stress for torsion) because of the wind load effect.
p2(x): Combined stress (bending stress and shear stress) because of the earthquake load effect.
p3(x): Natural frequency for the 1st mode bending. p4(x):Fatigue stress.
Mtower: Mass of turbine tower.
Minimize (34) f(x) = Mtower(x).(1+p1(x) +p2(x) + p3(x) + p4(x)) Constraints 12 i i 1 i 51 26
x x x
t t .. t
the thick- nesses of sections (35)
i = 1 ,2 ,...,51
[image:5.595.61.288.375.504.2] [image:5.595.310.545.456.697.2]( ) ( )
U_C_WL x DCRsw x (Figure 9).
Unity check of critical combined buckling stress ratio due to wind effect load against combined stress ratio:
( ) ( )
[image:6.595.311.541.133.250.2]U_C_EQ x DCRsq x (Figure 10).
Figure 9. Buckling unity check for wind turbine effect and direct wind load.
Unity check of critical combined buckling stress ratio
( )
[image:6.595.58.290.144.254.2]U_C_EQ x due to earthquake effect load against combined stress ratio DCRsq x( ).wt w wr, t Natural
Figure 10. Buckling unity check for earthquake load (EQ).
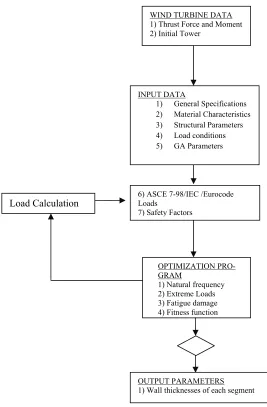
Figure 11. Design flow.
INPUT DATA
1) General Specifications 2) Material Characteristics 3) Structural Parameters 4) Load conditions 5) GA Parameters
6) ASCE 7-98/IEC /Eurocode Loads
7) Safety Factors
OPTIMIZATION PRO-GRAM
1) Natural frequency 2) Extreme Loads 3) Fatigue damage 4) Fitness function
OUTPUT PARAMETERS 1) Wall thicknesses of each segment
Load Calculation
[image:6.595.124.391.289.696.2]frequency of tower1st mode wr Operation frequency of turbine.
Design flow is shown as follows. This GA structure minimizes tower mass subject to general dimensions, design loads and some design restrictions. Load calcula-tion depends on wind turbine design requirements of the standard IEC61400-1 and ASCE 7-98. All extreme loads of tower sections are calculated by the load combination [5] as shown in Figure 11.
10. Optimization Results
Score in figure above represents mass of steel tower in kg. After 40th generation of GA, value of mass levels out. In
other words, optimization result has been reached at this point.
11. Conclusions
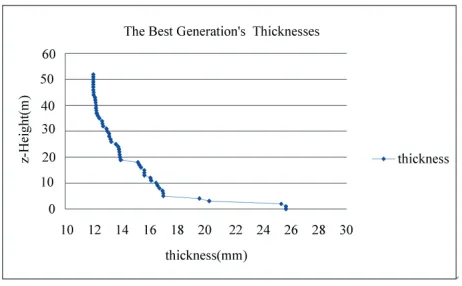
[image:7.595.311.542.84.227.2]Each 1 m section along tower represented a chromosome in GA. Each section has been evaluated step by step on the basis of buckling strength in GA. An objective function has been produced by using a genetic algorithm. This optimizes the thickness of steel tower ranging from top 12 mm to base 26 mm in the distribution of pattern. All in all, the thicknesses of tower have been evaluated separately in each 1 m section along the height of the tower. Within the best solution of current conditions, the weight of tower has been obtained 63000 kg with a type of S355J0 material quality. Andit gives results for the best solution as indicated above in Figure 12. Moreover, the upcoming studies can be carried out and developed-
Figure 12. Thickness distribution.
further as longas stiffness is obtained.
12. References
[1] R. Y. Redlinger, P. D. Andersen and P. E. Morthorst, “Wind Energy in the 21st Century,” Economics, Policy, Technology and the Cahnging Electricity Industry, 2002. [2] “LWST Phase 1. Project Conceptual Design Study:
Evaluation of Design and Construction Approaches for Economical Hybrid Steel/Concrete Wind Turbine Tow-ers,” 28 June 2002-31 July 2004, NREL Subcontractor Report, January 2005 NREL/SR-500-36777.
[3] ASCE 7-98, “Minimum Design Loads for Buildings and Other Structures,” 1998.
[4] R. Harrison, E. Hau and H. Snel, “Large Wind Turbines,” Design and Economics, 2000.
![Address [on trade relations] by the Honorable Maurice H Stans United States Secretary of Commerce before the British American Commerce Grand Ballroom, Delmonico's Hotel New York, 1 December 1970](data:image/gif;base64,R0lGODlhAQABAIAAAP///wAAACH5BAEAAAAALAAAAAABAAEAAAICRAEAOw==)