J. Water Resource and Protection, 2009, 1, 391-399
doi:10.4236/jwarp.2009.16047 Published Online December 2009 (http://www.scirp.org/journal/jwarp)
A Diffusion Wave Based Integrated FEM-GIS Model for
Runoff Simulation of Small Watersheds
Reddy K. VENKATA1, T. I. ELDHO2, E. P. RAO2
1NIT Warangal, Andhra Pradesh, India
2Department of Civil Engineering, Indian Institute of Technology (IIT) Bombay, Mumbai, India E-mail: [email protected]
Received June 20, 2009; revised July 16, 2009; accepted July 24, 2009
Abstract
In this paper, an integrated model based on Finite Element Method (FEM) and Geographical Information Systems (GIS) has been presented for the runoff simulation of small watersheds. Interception is estimated by an exponential model based on Leaf Area Index (LAI). Philip two term model has been used for the estima-tion of infiltraestima-tion in the watershed. For runoff estimaestima-tion, diffusion wave equaestima-tions solved by FEM are used. Interflow has been simulated using FEM based model. The developed integrated model has been applied to Peacheater Creek watershed in USA. Sensitivity analysis of the model has been carried out for various pa-rameters. From the results, it is seen that the model is able to simulate the hydrographs with reasonable ac-curacy. The presented model is useful for runoff estimation in small watersheds.
Keywords:Diffusion Wave Model, GIS, Interception, Interflow, Philip Infiltration Model, Runoff Simulation
1. Introduction
Watershed is the fundamental geographical unit for the planning and management of water resources. Various hydrological processes occurring in the watershed are very complex in nature. A careful representation of the hydrological processes is necessary for the hydrologic modeling as it promises better estimates of hydrologic variables for management decisions [1]. Recent advan- cements in computing and database management tech-nologies offer better physically based hydrological mod-eling which in turn provide better estimates of hydro-logic variables such as infiltration, runoff etc.
Usually interception can be deducted as some per-centage of rainfall. If required data is available for esti-mation of interception, it is better to incorporate it in the rainfall-runoff model. Aston [2] developed an exponen-tial model for calculation of interception loss based on Leaf Area Index (LAI). Jetten [3] has used LAI and cover fraction based interception method in LISEM (LImburg Sediment Erosion Model). Kang et al. [4] ob-served good agreement between the measured intercep-tion and intercepintercep-tion obtained from linear regression model based on plant height and LAI.
Infiltration is an important hydrologic process, which must be carefully considered in the hydrologic models. Philip model is one of the commonly used approximate infiltration model. Luce and Cundy [5] used Philip
infil-tration model to calculate rainfall excess in their over-land flow model. Jain et al. [6] used the Philip two term infiltration model, to compute the infiltration in their model.
In steep humid catchments, interflow (through flow) is more likely to be the main form of drainage. Interflow travels laterally through the upper soil layers until it reaches a conveyance system. Jayawardena and White [7, 8] developed a finite element model suitable for catch-ments where through flow is dominant and applied to two experimental catchments. Sunada and Hong [9] pre-sented a numerical runoff model describing interflow and overland flow on hill slopes.
discussed the limitations of kinematic wave modeling and advantages of diffusion wave modeling over kine-matic wave modeling.
The Finite Element Method (FEM) is an efficient way to transform partial differential equations in space and time into ordinary differential equations in time. Finite difference schemes may then be used to solve for the time dependent solution of the system [14]. Blandford and Ormsbee [15] used diffusion wave equations to de-velop a finite element model for dendritic channel net-work with trapezoidal and rectangular channel geome-tries.
The physical parameters, which influence runoff routing, such as slope and Manning’s roughness vary spatially over the watershed. Spatial variation of these properties can be better incorporated into the model by using Geographical Information Systems (GIS). Sui and Maggio [16], Gar-brecht et al. [17] and Vieux [14] discussed the use of GIS in watershed modeling. Jaber and Mohtar [18] developed a GIS interface for the overland flow model by using the ArcView 3.2. In this paper an integrated hydrologic model based on FEM and GIS is presented for the runoff simulation and to analyze its application to a small wa-tershed.
2. Model Formulation
In this paper, finite element based rainfall-runoff model using GIS is described for the simulation of event based surface runoff. Diffusion wave equations are used in the model development. Galerkin FEM technique has been used in the solution of the governing equations. Intercep-tion has been estimated by an exponential model based on Leaf Area Index (LAI). Philip two term infiltration model has been used for the estimation of infiltration. Interflow has been estimated using FEM based model. Finite element grid has been prepared for the watershed by using GIS. Spatially distributed information for model inputs such as slope and Manning’s roughness are pro-vided for each node of FEM grid using GIS.
2.1. Interception Model
Interception is estimated based on the equations used in the LISEM model [3]. In this model, canopy of crops and vegetation is regarded as simple storage. The cumulative interception during an event is given as [2]:
m a x
. m a x
. 1
c u m v d
c
P c
S c p c
I c S e
LAI
(1)
where Ic is the cumulative interception, cpis the fraction
of vegetation cover, cvd is the correction factor for
vege-tation density and is given as cvd=0.046×LAI, Pcum is the
cumulative rainfall, Scmax is the canopy storage capacity
and LAI is the Leaf Area Index. Canopy storage capacity Scmax is calculated by equation developed by Von
Hoyn-ingen-Huene [3] as follows:
2 max 0.935 0.498 0.00575
c
S LAI (2)
The interception loss (I ) for every time step is calcu-lated as follows:
( )t t ( )t c c
I I I (3) where t is the time and Δt the time step. Interception rate from the interception loss has been calculated and is de-ducted from rainfall intensity to get the effective rainfall intensity which is used to calculate infiltration and sub-sequent runoff.
2.2. Philip Two-Term Infiltration Model
The Philip two term infiltration model is used for com-puting the infiltration. The rate of infiltration given by Philip in 1957 [19] is as follows:
1/2
1 2 i
f s t K (4)
where ƒ is the infiltration rate as a function of time, Si is
the infiltration sorptivity and K is the hydraulic conduc-tivity which is considered equal to the saturated hydrau-lic conductivity (Ks). Infiltration sorptivity si [20] can be
expressed as follows:
1/2
5 ( , )
2(1 )
3
s ini i ini
K d s
s s
(5)
where sini is the initial (uniform) soil saturation degree in
the surface boundary layer, is the saturated matrix po-tential of the soil,
) ( ,d sini
is the dimensionless surface sorption diffusivity of the soil, η is the effective porosity of the soil, λ is pore size distribution index and d is the diffusivity index.
Here ,( ,d sini) and d have been calculated based on the expressions given by Jain et al. [6]. Infiltration rate (ƒ) has been estimated based on the equations given by Chow et al. [19]. The soil parameter Si can be
calcu-lated using soil dependent parameters of η, λ, Ks and sini.
The standard values of η, λ, Ks are available in literature
for various soil types. These are used as a first approxi-mation in the model and optimum values can be esti-mated by calibration. The initial soil saturation degree
sini.has been assumed randomly for each rainfall event
and optimal value can be estimated by calibration.
2.3. Governing Equations for Surface Runoff
R. K. VENKATA ET AL. 393
are formulated based on diffusion wave equations to route the runoff to outlet of the watershed.
2.3.1. One Dimensional Diffusion Wave Equation for Overland Flow
The continuity and momentum equations for diffusion wave for overland flow are given as [21]:
e
q h
r
x t
(6)
o
h
S S
x
f (7)
where q is the flow per unit width, h is the depth of flow; re is the excess rainfall intensity after interception and
in-filtrations loss, x is the variable representing space, is the variable representing time, So is the slope of overland
flow plane and Sƒ is the friction slope of flow plane. The
flow per unit width is given as q=αhβ. α andβcan be
de-rived by using Manning’s equation and are given as
t
/
f o
S n
and , where is the overland flow Manning’s roughness coefficient.
5 / 3
no
The above governing equations are solved using initial and boundary conditions. Initial condition is of no flow condition and it is given as at time t=0; h=0 and q=0 at all nodal points. Upstream boundary condition is assumed as zero inflow and it is given as h=0 q=0 at all times t. Down-stream boundary condition is of zero depth gradient [22] and it is expressed as (əh/əx)=0 at all times t. This condi-tion can also be written with the end node M as hM=hM-1.
2.3.2. One Dimensional Diffusion Wave Equation for Channel Flow
Diffusion wave equation for channel flow consists of continuity and momentum equations as:
0 q t A x
Q (8)
c f h S S x
(9)
where is the discharge in the channel, A i the area of flow in the channel, S is th bed slope of channel and c
Q s
e
f
S is t friction slope of channel. Q in ua-tion (8) can be represented by the uniform flow equaua-tion such as Manning’s equation and is given as follows:
he Eq
(2/3) (1/2)
1
c
f c
Q R S
n
A (10)
where R is the hydraulic radius (A/P),P is the wetted pe-rimeter and nc is the channel flow Manning’s roughness
coefficient. By substituting for R in Equation (10) gives:
(2/3) (1/2) (5/3) 1 1 c f c Q S n P
A (11)
Initial condition is given as: at time = 0; t
, 0
Q A0 and q0. and it is giv
Upstream bound
ow en as and
ary condition is of zero infl Q0 A0.
D h
ent and it is si o ov
iscretization. Applying the Galerkin finite element
for-(12) where and are elemental matrices. The supe
ownstream boundary condition is of zero dept gradi-milar t erland flow.
2.3.3. Finite Element Formulation for Overland Flow
Here, one dimensional line elements are used for spatial d
mulation [23] to Equation (6) gives:
( ) ( ) ( )
( )
(1 )
(1 )( ) ( )
e t t e t e t t t
e t t t
e e
C h C h t B q q
t f r r
( )
[ ]C e , r scri
( )eB
pts
( )ef t and tt
and current tim
indicate the variabl e step.
es at the previous time step is the factor ines the e of finite difference scheme involved. Here -Nicolson scheme with
0.5
that determ typ Crank
is used. Equation (12) is applied to all elements in the domain and assembled to form a system of equa-tions. The system of equations is solved by Cholesky
after applying the boundary conditions for the unknown values of h. The solution of h requires it-eration due to non-linearity of the Equation (12). Itera-tion is continued until the convergence is reached to a specified tolerance value (
scheme
). After convergence on h, the time step is incremented and the solution proceeds in the same manner by updating the time matrices and evaluating the new h values. During calculation f friction slope, the following formulation has to be applied in explicit finite difference form for the Equation (7) [6].
o
(Sf i) ( )So i hk hi L
(13)
k
where and represent successive nodes in flow direction and L is the length of element.
m
-i
2.3.4. Finite Ele ent Formulation for Channel Flow
Here, continuity Equation (8) is approximated using alerkin FEM. The final form of the FEM equation G
which will be used in the channel flow model is as fol lows.
( ) ( ) ( )
(1 )
e t t e t e t t t
C A C A t B Q Q
t f
( )e
(1)qtqtt
odel has been formulated based on the iven by Jayawardena and White ]. The continuity equation for the interflow is as
fol-2.4. Interflow Model
Interflow m
through flow equations g [7
lows:
i i i
q h
I
x t
(15)
where qi is the interflow, hi is the saturated layer
thick-ness in which interflow passes, η i
interflow zone same as in the infiltration model
ite element formulation to quation (15), the final form of equation is as follows:
)
As in the case of overland flow, Equation
plied to all elements of overland flow plane and assem-bled to form a system of equations and solved.
model, rface runoff routing model based on diffusion wave
he developed integrated model has been evaluated on the in USA. The data required for eacheater Creek watershed is available in Distribut-
s the porosity of the and I is i
the lateral recharge rate due to infiltration per unit area. The interflow qi can be expressed by Darcy’s law for
flow in porous media, in a direction parallel to the over-land flow plane slope (S0) and is given as qi=K S0 hi Here
K is the hydraulic conductivity of the interflow zone, same as in infiltration model. Substituting qi in Equation
(15) gives the interflow as:
2.4.1. Finite Element Formulation
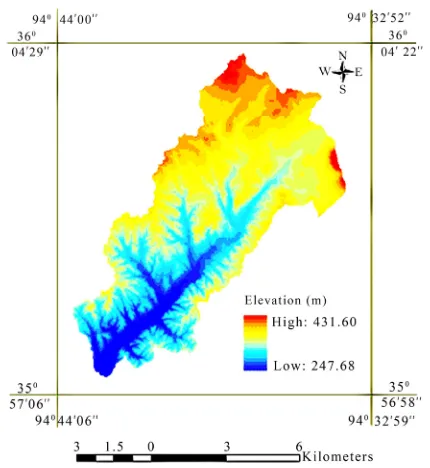
By applying Galerkin fin Figure 1. Digital Elevation Model of Peacheater Creek
wa-tershed.
(Michael B. Smith and Seann M. Reed, DMIP, ational Weather Service Office of Hydrologic
Develop-he PeacDevelop-heater creek watersDevelop-hed is one of tDevelop-he study wa-is a auged sub-watershed of Baron Fork catchment, Okla-E
( )e ( )e
0
( ) ( )
0
( [ ] [ ] ){ } ( [ ] (1 )[ ] ){ }
t t i
e e t
i
C B t KS h
C B tKS h
(16
( )
[ ]fi e t{ ( ) Ii t t (1 )( ) }Ii t
(16) is
ap-station information are obtained through personal commu-nication
N
ment, USA, 2005).
3.2. Study Area and Preparation of Database
T
3. Model Development and Evaluation
tersheds of DMIP. It has an area of 63.58 km2. Itg Based on the above formulation, computer models were
developed for interception model, Philip infiltration homa, USA. Gauging station for this watershed is lo-cated at Christie, Oklahoma. The watershed consists pri- marily of silt loam soils with forested (42%), grassy (57%) and urban (1%) areas [24]. ASCII files of DEM (1 arc-second), soil and land use map of the Baron Fork basin with 30 m grid resolution were converted into map format with appropriate projection information. Required DEM, soil and land use maps for Peacheater creek wa-tershed are clipped, based on the boundary of the water-shed. DEM of the watershed is shown in Figure 1. Drain-age map of the watershed is generated based on DEM using Hydrology tools of ArcMap. Percentage slope map is prepared from DEM by using the slope option of Spa-tial Analyst in ArcMap. The percentage slope is then converted in to slope values by Raster Calculator option in GIS. Hourly rainfall data in binary format were ob-tained from DMIP website (Stage 3 Next-Generation Weather Radar (NEXRAD) observations at 4x4 km resolution). Based on the procedure explained in the DMIP website, the hourly rainfall maps are prepared and clipped for the watershed.
su
formulation and interflow model, using C programming language. Further these models are integrated together for the prediction of runoff at any location for the given rain-fall conditions. Infiltration from the Philip model is the input to the interflow model assuming that some part of infiltration flows towards the stream through a saturated zone and contributes to the runoff. Finite element mesh and input data required for the integrated model has been prepared using the GIS.
3.1. Model Evaluation
T
Peacheater Creek watershed P
[image:4.595.316.531.81.315.2]395
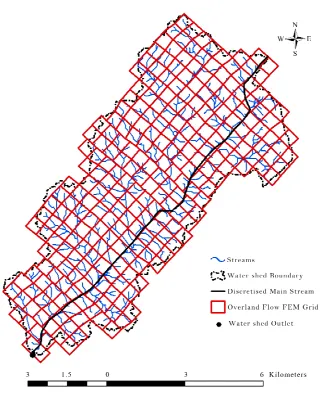
Figure 2. Peacheater creek watershed with FEM grid.
Event conductivitySatura
s ini
anning’s
oefficient Channel flow Manning’s roughness coefficient
Table 1. Calibrated parameters for rainfall events.
ted hydraulic
K (cm/hour) Initial degree of soil saturation (S )
Overland flow M roughness c
(no) (nc)
06 February1999 0.609 0.2 0.592 0.085
17 May1999 0.525 0.25
23 1
0.19 0.05
28 June 2000 0.55 0.2 0.52 0.18
February 200 0.25 0.28 0.25 0.05
FE he watershed is prepared with over-nd flow strips with element size of 500x500m., as shown in
obtained by taking average of adjacent element values.
del Simu
06, nd λ of 0.28 have been used in ents. In view of the non M grid map of t
la
Figure 2. The grid map has been overlaid on slope map. By using the Zonal Statistics option in the Spatial Analyst module of ArcMap, the mean value of slope has been cal-culated for each element of the grid. The attribute table of the grid containing the element number and mean value of slope has been exported as database file. The present model needs input data of slope at the nodal level. It is
The developed model has been applied to simulate the runoff in Peacheater Creek watershed for six rainfall events. A constant channel width of 45 m, slope 0.0
3.3. Mo lation
time step 30 s, η of 0.416 a e simulation of rainfall ev th
availability of data for the interception model, LAI of 1.5 and cp of 0.5 have been assumed.
[image:5.595.59.542.509.597.2]Peak
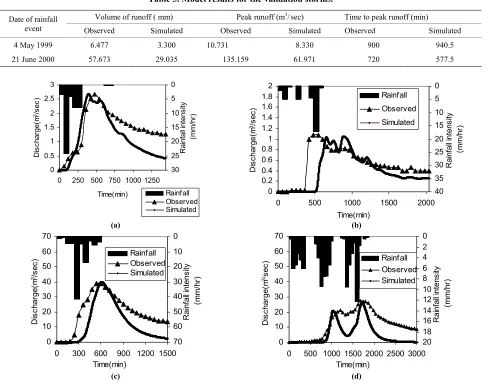
Table 2. Model results for the calibration storms.
Volume of runoff (mm) runoff (m3/ sec) Time to peak runoff (min)
Date of rainfall
event Observed Simulated Observed Simulated Observed Simulated
06 February 1999 2.025 1.590 2.668 2.679 480 395.5
17 May 1999 1. 1. 4
28 June 2000
001 0.764 071 1.05 540 652
[image:6.595.57.542.200.584.2]28.738 17.577 38.844 39.987 600 608 23 February 2001 35.033 15.299 27.431 25.982 1680 1723
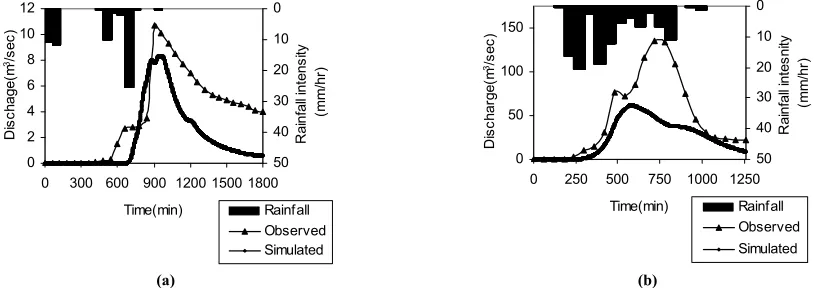
Table 3. el results for e validation s.
V f runoff ( m 3/sec Time to peak runoff (min)
Mod th storm
olume o m) Peak runoff (m ) Date of rainfall
event Observed Simulated Observed Simulated Observed Simulated
4 May 1999 6.477 3.300 10.731 8.330 900 940.5 21 June 2000 57.673 29.035 135.159 61.971 720 577.5
0 0.5 1 1.5 2 2.5 3
0 250 500 750 1000 1250
Time(min) D is ch ar ge (m 3/s ec ) 0 5 sit y 0 0.2 0.4 0.6 0.8 1 1.2 1.4 1.6 1.8 2
0 500 1000 1500 2000
Time(min) D isch ar ge (m 3/s ec ) 0 5 10 15 20 25 30 35 40 R ain fa ll in te ns ity (m m /h r) Rainfall Observed 10 15 20 25 30 R ai nf all in te n (mm/ hr ) Rainfall Observed Simulated Simulated (a) (b) 0 10 20 30 40 50 60 70
0 300 600 900 1200 1500 Time(min) D isch ar ge (m 3/s ec ) 0 10 20 30 40 50 60 70 R ain fa ll in te ns ity (mm/ hr ) Rainfall Observed Simulated 0 10 20 30 40 50 60 70
0 500 1000 1500 2000 2500 3000 Time(min) D is char ge( m 3/se c) 0 2 4 6 8 10 12 14 16 18 20 R ain fa ll in te ns ity (m m /h r) Rainfall Observed Simulated (c) (d)
Figure 3. Observed and simulated hydrographs for calibration events; (a) 06 February 1999; (b) 17 May 1999; (c) 28 June 2000; (d) 23 February 2001.
of Peacheater Creek waters n of model has been c
been p Ks and Sini by
ial and error based on the best visual fit of the
hydro-peak. Validation of two rainfall events of Peacheater of four calibrated rainfall events.
hed. Validatio
arried out with two rainfall events. Calibration has
erformed by altering the values of watershed is carried out by taking average parameters tr
graphs. The parameters no and nc have been calibrated in
the absence of data. Calibrated parameters for Peacheater Creek watershed are given in Table 1. The model fit was checked based on the difference between observed and computed volume of runoff, peak runoff and time to
4. Results and Discussions
R. K. VENKATA ET AL. 397
r calibrated events. From e simulation results, it is seen that volume of flow has of
56% and peakto peak within a simulated values of volume of runoff, peak runoff and time to peak runoff for the fou
th
been simulated within variation flow within variation of
6% and time variation of
21%.The observed and simulated hydrographs for the two validated events of Peacheater Creek watershed are shown in Figure 4. Table 3 shows the observed and simulated values of volume of runoff, peak runoff and time to peak runoff for the two validated events. From the validation of simulation results, it is seen that volume of flow has been simulated within a variation of
50% and peak flow within a variation of 54% a e to peo
width values are as-su
value of
pa
nd tim ak within a variation of
20%.Topographic complexity in the Peacheater Creek con-trols the catchment response to rainfall via interactions between the active shallow aquifer, stream network and land surface [24]. Even though the present model has been simulating interflow, it is unable to simulate perched return flow and ground water exfiltration which are important hydrological processes f this watershed. In addition, the channel slope and
med to be constant throughout the length of the chan-nel, because of lack of data, and weighted average rain-fall for the whole watershed has been used in the model. These factors might have contributed to the discrepancy between the observed and simulated flow.
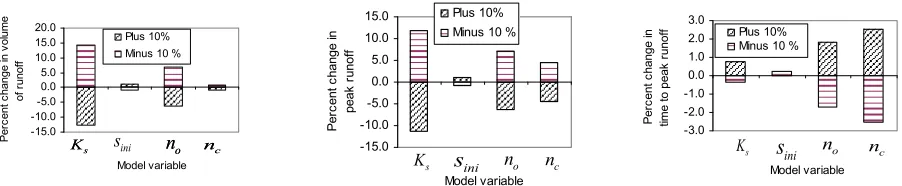
Also a sensitivity analysis of the model has been car-ried out by altering the parameters of Ks, Sini, no and nc by
10%. Effect of change in calibrated parameters on computed values of volume of runoff, peak runoff and time to peak runoff are shown for a rainfall event in Fig-ure 5. From the results, it is observed that the values of computed volume of runoff and peak runoff are most sensitive to Ks followed by no, nc and Sini. Thecomputed time to peak runoff is most sensitive to nc
fol-lowed by no, Ks and Sini The change of
10% in therameter Ks caused a variation of 12% in the volume of
runoff and peak runoff and 0.5% variation in the time to
peak. The change of
10% in the parameter no causeda variation of 6% in the volume of runoff and peak run-off and 1.7% variation in the time to peak. The change of
10% in the parameter nc caused a variation of 0.9% inthe volume of runoff and 4.4% in the peak runoff and 2.4% variation in the time to peak. It indicates that vol-ume of runoff is more sensitive to the infiltration pa-rameters than flow resistance papa-rameters and time to peak is more sensitive to the flow resistance parameters than infiltration parameters. It is also seen that peak run-off is sensitive to both infiltration and flow resistance parameters. The change of 10% in the parameter Sini
caused a variation of 1% in the volume of runoff and peak runoff and 0.1% variation in the time to peak. It indicates that volume of runoff, peak runoff and time to peak runoff are least sensitive to Sini. This may be true
since most of the rainfall events simulated are long dura-tion events where initial saturadura-tion condidura-tions may not have much influence on the flow parameters. However, it is observed from the sensitivity analysis that all the pa-rameters considered are important in the simulation of runoff and accuracy of these parameters control the ac-curacy of the simulation results.
5. Concluding Remarks
An integrated FEM and GIS based rainfall runoff model using diffusion wave equation is presented here. Inter-ception has been calculated by an empirical model based on Leaf Area Index (LAI). Philip two-term infiltration model is used for estimation of infiltration. Interflow model has been developed using FEM. The developed model has been calibrated and validated on Peacheater Creek watershed in USA.
The developed model has fairly simulated the hydro-graphs at the outlet of watershed. From the simulation results of watershed, it is seen that volume of runoff has been simulated within variation of 56%, peak runoff within variation of
6% and time to peak runoff within variation of
21% for calibrated rainfall events.0 2 4 6 8 10 12
D
is
cha
ge
(m
3/s
ec
)
0
10
20
30
40 Rainf
all
in
te
ns
ity
(m
m
/h
r)
0 50 100 150
0 250 500 750 1000 1250 Time(min)
D
is
cha
rge(
m
3/s
ec
)
0
10
20
30
40
50
R
ain
fa
ll in
te
sn
ity
(m
m
/h
r)
Rainfall Observed Simulated 0 300 600 900 1200 1500 1800
Time(min)
50
Rainfall Observed Simulated
(a)
[image:7.595.94.501.560.704.2](b)
Figure 5. Effect of change in calibrated model parameters on computed values of volume of runoff, peak runoff and time to peak runoff (28 June 2000).
Model performed well on some of the validation rainfall events. This may be primarily due to differences in characteristics between the calibration storms and the validation storms. Large variation in simulated volume of runoff for some of the rainfall events may be because of simulated interflow not representing the perched re-turn flow and ground water exfiltration which are impor-tant hydrological processes of this watershed. Further, sensitivity analysis for various parameters has been car-ried out. From the sensitivity analysis results, it is seen that volum
param p
so observed that all
7. References
[1] L. D. James and S. J. Burges, “Selection, calibration, and testing of hydrologic models,” Hydrologic Modeling of Small Watersheds (C. T. Haan, H. P. Johnson and D. L. Brakensiek (Eds.)), Monograph, ASAE, Michigan, USA, No. 5, pp. 437-472, 1982.
[2] A. R. Aston, “Rainfall interception by eight small trees,” Journal of Hydrology, Vol. 42, pp. 383-396, 1979. [3] V. Jetten, “LISEM Limburg Soil Erosion Model,” Win- dows
etherlands, for further
[4] Y. Kang, Q. G. Wang, and H. J. Liu, “Winter wheat
can-, Vol. 28can-, No. 4can-, pp. 1179-1186can-,
t model, II. Application to the real ournal of Hydrology, Vol. 42, pp. 231-249, 1979.
, Vol.
6.
e of runoff is more sensitive to the infiltration version 2.x, USER MANUAL, Utrecht University, N pp.7-7, 2002. See http://www.geog.uu.nl/lisem
eters than flow resistance parameters and time to eak is more sensitive to the flow resistance parameters
an infiltration parameters. It is al
details, Accessed 26/08/2005.
th
the infiltration and flow resistance parameters considered in the model are important in the simulation of runoff.
The model in its present form is not suitable during hiatus and prolonged interstorm periods because it doesn’t account for moisture balance and evapo-transpi-ration losses. In the present study calibrated values of infiltration and flow resistance parameters based on the observed hydrographs have been used in the simulation. The present study, demonstrated the application of GIS in simulation of runoff by integration of FEM based surface runoff and interflow models and conceptually established interception and infiltration models. The model presented here can be applied to agricultural and forested water-sheds since this model will take care of interflow and interception. The model can be applied to small to me-dium watersheds for the event based runoff simulation. Due to lack of availability of suitable data, the model ap-plicability for larger watersheds could not be carried out.
6. Acknowledgements
Authors are thankful to the ISRO-IITB cell for the finan-cial assistance to carryout this work through project No. 03IS007. Authors are also thankful to Michael B. Smith and Seann M. Reed, DMIP, National Weather Service, Office of Hydrologic Development, Sliver Spring, USA for providing the database of Peacheater Creek water-shed, Oklahoma, USA.
opy interception and its influence factors under sprinkler irrigation,” Agricultural Water Management, Vol. 74, pp. 189-199, 2005.
[5] C. H. Luce and T. W. Cundy, “Modification of the kine-matic wave-Philip infiltration overland flow model,” Water Resources Research
1992.
[6] M. K. Jain, U. C. Kothyari, and K. G. R. Raju, “A GIS based distributed rainfall-runoff model,” Journal of Hy-drology, Vol. 299, pp. 107-135, 2004.
[7] A. W. Jayawardena and J. K. White, “A finite element distributed catchment model, I. Analytical basis,” Journal of Hydrology, Vol. 34, pp. 269-286, 1977.
[8] A. W. Jayawardena and J. K. White, “A finite element tchmen
distributed ca catchments,” J
[9] K. Sunada and T. F. Hong, “Effects of slope conditions on direct runoff characteristics by the interflow and over-land flow model,” Journal of Hydrology, Vol. 102, pp. 323-334, 1988.
[10] E. M. Morris and D. A. Woolhiser, “Unsteady one- di-mensional flow over a plane: Partial equilibrium and re-cession hydrographs,” Water Resources Research 16, No. 2, pp. 355-360, 1980.
[11] T. V. Hromadka II and C. C. Yen, “A diffusion hydrody-namic model (DHM),’’ Advances in Water Resources, Vol. 9, No. 9, pp. 118-170, 198
-15.0 -10.0 -5.0 0.0 5.0 10.0 15.0 20.0
Model variable
P
er
cent
c
hange i
n v
ol
um
e
of
r
unof
f
Plus 10% Minus 10 %
s
Ks sini no nc
K no nc -15.0
-10.0 -5.0 0.0 5.0 10.0 15.0
Model variable
P
er
cent
c
hange
in
pea
k r
unof
f
Plus 10% Minus 10 %
s
K sini no nc
-3.0 -2.0 -1.0 0.0 1.0 2.0 3.0
Model variable
P
er
cent
c
hange i
n
time to p
eak
r
unoff
Plus 10% Minus 10 %
s
R. K. VENKATA ET AL. 399
l. 114, No. 2, pp. 207-217, 1988.
imla,India, 1992.
es in Water Resources, Vol. 26, No. 11, pp.
SA, 1988.
solutions of
Hill, New York, USA, 1993.
n dis-[12] T. V. Hromadka II and J. J. Devries, “Kinematic wave
routing and computational error,” Journal of Hydraulic Engineering, Vo
[13] V. M. Ponce, “Kinematic wave modeling: Where do we go from here?” in International Symposium on ogy of Mountainous Areas, National Institute of Hydrol-ogy, Sh
[14] B. E. Vieux, “Distributed Hydrologic Modeling Using GIS,” Kluwer Academic Publishers, Dordrecht, Nether-lands, 2001.
[15] J. E. Blandford and E. L. Ormsbee, “A diffusion wave finite element model for channel networks,” Journal of Hydrology, Vol. 142, pp. 99-120, 1993.
[16] D. Z. Sui and R. C. Maggio, “Integrating GIS with hy-drological modeling: practices, problems, and prospects,” Computers, Environment and Urban Systems, Vol. 23,
No. 1, pp. 33-51, 1999.
[17] J. Garbrecht, F. L. Ogden, P. A. Debarry, and D. R. Maidment, “GIS and distributed watershed models. I: Data coverages and sources,” Journal of Hydrologic En-gineering,Vol. 6, No. 6, pp. 506-514, 2001.
[18] F. H. Jaber and R. H. Mohtar, “Stability and accuracy of
two dimensional kinematic wave overland flow model-ing,” Advanc
1189-1198, 2003.
[19] V. T. Chow, D. R. Maidment, and L. W. Mays, “Applied hydrology,” McGraw-Hill, New York, U
[20] P. S. Eagleson, “Climate, soil and vegetation 3. A simpli-fied model of soil moisture movement in liquid phase,” Water Resources Research, Vol. 14, No. 5, pp. 722-730, 1978.
[21] V. P. Singh, “Kinematic wave modeling in water re-sources.” JohnWiley and Sons, New York, USA, 1996. [22] E. M. Morris, “The effect of the small slope
approxima-tion and lower boundary condiapproxima-tion on
Saint-Venant equations,” Journal of Hydrology, Vol. 40, pp. 31-47, 1979.
[23] J. N. Reddy, “An Introduction to the finite element method,” McGraw