warwick.ac.uk/lib-publications
Original citation:
Kitagawa, Atsuhide, Denissenko, Petr and Murai, Yuichi. (2017) Effect of wall surface wettability on collective behavior of hydrogen microbubbles rising along a wall. Experimental Thermal and Fluid Science, 80. pp. 126-138.
Permanent WRAP URL:
http://wrap.warwick.ac.uk/94363
Copyright and reuse:
The Warwick Research Archive Portal (WRAP) makes this work by researchers of the University of Warwick available open access under the following conditions. Copyright © and all moral rights to the version of the paper presented here belong to the individual author(s) and/or other copyright owners. To the extent reasonable and practicable the material made available in WRAP has been checked for eligibility before being made available.
Copies of full items can be used for personal research or study, educational, or not-for-profit purposes without prior permission or charge. Provided that the authors, title and full bibliographic details are credited, a hyperlink and/or URL is given for the original metadata page and the content is not changed in any way.
Publisher’s statement:
© 2017, Elsevier. Licensed under the Creative Commons Attribution-NonCommercial-NoDerivatives 4.0 International http://creativecommons.org/licenses/by-nc-nd/4.0/
A note on versions:
The version presented here may differ from the published version or, version of record, if you wish to cite this item you are advised to consult the publisher’s version. Please see the ‘permanent WRAP URL’ above for details on accessing the published version and note that access may require a subscription.
Effect of wall surface wettability on collective behavior of hydrogen microbubbles rising along a wall
Atsuhide Kitagawa a,*, Petr Denissenko b, and Yuichi Murai c
a
Department of Mechanical and System Engineering, Kyoto Institute of Technology, Goshokaido-cho, Matsugasaki, Sakyo-ku, Kyoto 606-8585 Japan
b
School of Engineering, University of Warwick, Gibbet Hill Road, Coventry CV4 7AL, UK
c Laboratory for Flow Control, Faculty of Engineering, Hokkaido University,
Kita-13, Nishi-8, Kita-ku, Sapporo 060-8628 Japan
* Corresponding author. Tel: +81 75 724 7327; Fax: +81 75 724 7300; E-mail: [email protected] (A. Kitagawa).
ABSTRACT
This paper presents an experimental study of the influence of wall surface wettability on the behavior of hydrogen microbubbles rising along a nearly vertical wall. Multiple optical diagnostics, including particle tracking velocimetry, have been employed for the study. The microbubble behavior observed along three different kinds of wall surfaces (hydrophobic, hydrophilic, and super-hydrophilic) was characterized by the microbubble-wall attachment, bubble size distribution, bubble coalescence, and microbubble layer formation. Microbubbles rising along the wall with poor wettability soon attach to the wall and grow to millimeters in size as a result of bubble coalescence. Such millimeter-sized bubbles detach from the wall because of their increased buoyancy, and eventually enhance transverse diffusion of microbubbles, which is known as the sweep-out effect. In contrast, in the case of very good wettability, almost no microbubbles attach to the wall and smoothly form a thin microbubble layer in the wall proximity. The observed phenomena contradict our intuitive expectation of the effect of surface wettability on gas bubbles, and hence may be regarded as a feature of microbubbles that distinguishes them from large bubbles.
Keywords: Microbubble, Wall surface wettability, Visualization, Particle tracking velocimetry
1. Introduction
Phenomena analogous to this effect are also expected to affect heat and mass transfer close to the wall. In contrast to high Reynolds number flows, when microbubbles move in the Stokes regime (Re<<1), their small slip velocity plays a significant role in two-way interaction between two phases (Mathai et al. [8]). In all applications, however, experimentalists often encounter optical difficulties in capturing flowing microbubbles. Lee and Kim [9] developed the X-ray particle tracking velocimetry (PTV) technique, which allows the simultaneous measurement of the sizes and velocity vectors of microbubbles. Makuta et al. [10] investigated the mechanism of microbubble generation using a high-speed camera through a microscope, and succeeded in the stable generation of microbubbles of uniform diameter from 4 to 15 micrometers. The microbubble-mixed channel flow experiment of Hara et al. [11] used a shallow depth-of-focus technique to carry out PTV for two phases. New findings on microbubbles, microbubble swarms, and a dense cloud of small spherical bubbles are being increasingly reported. Zimmerman et al. [12] studied the trade-off between heat transfer and evaporation at the microbubble interface both experimentally and by computational modeling, and found that the vapor temperature decreased with increasing contact time. The present authors’ group, Kitagawa and Murai [13], investigated the motion characteristics of microbubble swarms ascending close to a vertical wall, and clarified that under specific conditions of bubble size and bubble flow rate, a two-way interaction between the microbubbles and the liquid flow self-excites the pulsation during their co-current rise. As a model of microbubble cluster, Murai et al. [14] measured the rheology of liquid including spherical bubbles, and found that the effective viscosity jumped up by three orders of magnitude higher than the original carrier phase viscosity at a local volume fraction of bubbles of approximately 50 % (i.e., superficial freezing effect of microbubble clusters in shear flows).
droplet-surface collisions (Chaudhury and Whitesides [20]; Fukai et al. [21]; Daniel et al. [22]; Tatekura et al. [23]). In contrast, there are few comprehensive studies on the behavior of microbubbles along walls having different surface wettability even though engineers often experience serious difficulties in handling the behavior of microbubbles, such as microbubble-wall attachment, which eventually impacts the system’s performance.
The purpose of this paper is to clarify the effect of wall surface wettability on microbubble-wall attachment for a purposely simplified geometry. We also investigate the motion of microbubbles near a wall using laser-assisted visualization and PTV. In our experiments, hydrogen bubbles generated by water electrolysis are used as the microbubbles. The obtained experimental results reveal the influence of wettability across a wide phenomenological range, from stationary microbubble attachment to dynamic responses taking place within the boundary layer.
2. Experimental setup
2.1. Wall surface condition
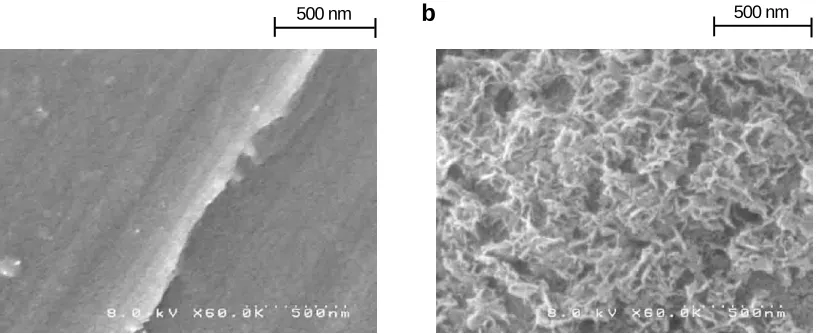
Three types of metal plate (Types A, B and C) are used in this study, each with a specific surface wettability. Type A is an aluminum plate (hereafter called "Al plate") with an applied hydrophobic surface coating (Fluoro Technology: FS−1060−TH−2.0). Type B is a simple stainless steel plate, because stainless steel surfaces are generally known to have hydrophilic properties. Type C is also Al plate, but with a hot water treatment (Tadanaga et al. [24]). When the Al plate is immersed into boiling water, the oxide film (Al2O3) on its surface reacts with the
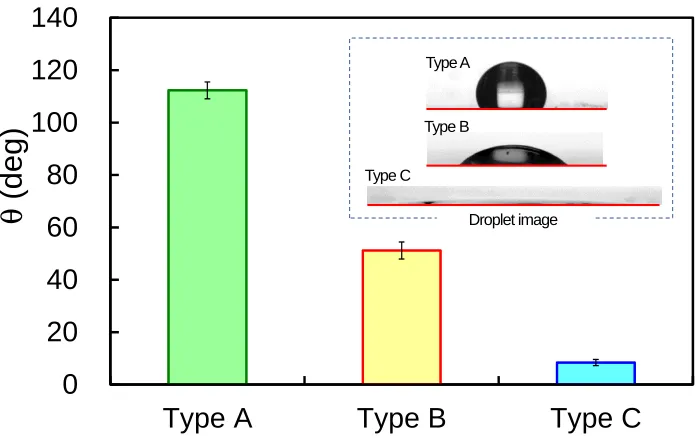
water. As a result, the boehmite (AlOOH) structure is formed on the surface of the place (Fig. 1) making it hydrophilic. Figure 2 shows the contact angle θ between a water droplet of 3 µL and the metal surface. The contact angles for the Type A, B, and C surfaces are approximately 110 ˚, 50 ˚, and 8 ˚, respectively. This result shows that the Type A, B, and C surfaces have hydrophobic, hydrophilic, and super-hydrophilic properties, respectively.
2.2. Experimental apparatus
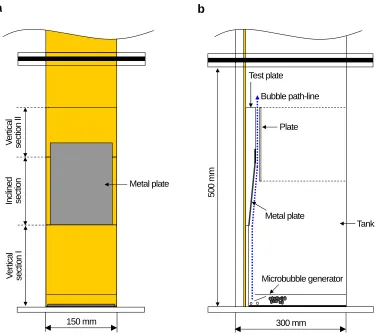
The experimental apparatus (Fig. 3) used in this work consists of a transparent acrylic tank (1500 mm high, 300 mm wide, and 150 mm deep), a test plate, and a microbubble generator. The test plate is set at the side wall of the tank, and the microbubble generator is set at the bottom of the tank. The test plate is made from acrylic plates, and has two vertical sections and an inclined section with an angle of 3 degrees. The metal plate (i.e., the Al plate or stainless steel plate) is fixed to the inclined section. The generated microbubbles rise along three sections, i.e., the vertical section I, the inclined section, and the vertical section II. The inclined section is set for observation of the bubble behavior along the wall with different wettability. The vertical section II is set for measuring the bubble size in a fully transparent environment. A thin acrylic plate is set in front of the section II at a fixed distance of 10 mm. This allows the diameter of all rising bubbles to be measured by a two-dimensionally restricted path. Without this guide plate, large bubbles easily tend to escape from a focal plane in the wall-normal direction. Tap water with a small amount of added salt and a temperature of 22 ˚C is used as the working liquid. The width of the tank at 300 mm is provided because in a long duration of microbubble generation the upper part of the tank would be occupied by cloudy microbubbles disturbing optical visualization in the test section.
wall is to avoid the influence of a very small gap between the metal plate and the guide plate from the microbubble generator on the behavior of rising microbubbles.
2.3. Microbubble generator
The microbubbles used in our experiments are hydrogen bubbles generated by water electrolysis. In the main experiment, NaCl has been added to the water as the electrolyte, with a mass concentration of 0.3 wt%. Although water salinity affects bubble coalescence (Del Castillo et al. [26]), its effect on the results shown in Section 5 is considered insignificant because the salt concentration is relatively low. A schematic of the microbubble generator is shown in Fig. 4. A platinum wire (0.2 mm in diameter and 120 mm long) is used as the cathode, while a platinum pipe (2 mm in diameter and 110 mm long) is used as the anode. Chlorine bubbles generated at the anode are eliminated using a charcoal absorber.
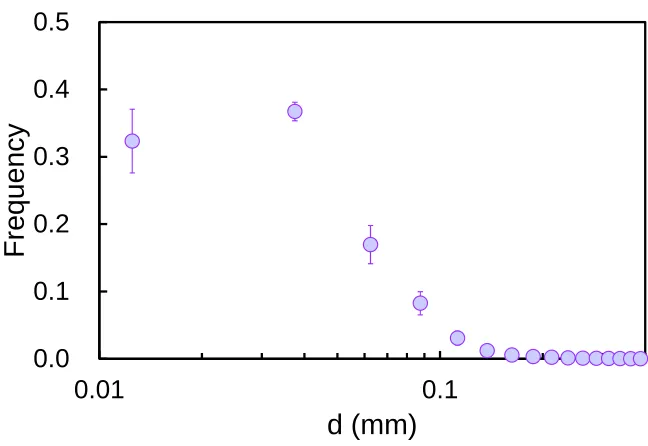
Figure 5 shows the histogram of bubble diameter d, measured near the cathode. Note that bubble diameter less than 10 µm could not be measured due to a resolution limit of the camera. The bubble flow rate Q is estimated to be 55 mm3/s using Faraday’s law and the gas equation of state. The observed bubble diameter ranges from 0.01 to 0.16 mm and the probability distribution has a peak at d=0.04 mm. The mean bubble diameter is approximately 0.04 mm. The terminal rise velocity of a single bubble in the stationary liquid uGT, the bubble Reynolds number
based on the terminal rise velocity ReG and the Weber number WeG are estimated using the following equations:
(1)
where g is the gravitational acceleration, µL is the liquid kinematic viscosity, ρL is the liquid density, and σ is the
surface tension. Under our experimental conditions, uGT ranges from 0.08 to 20.8 mm/s, ReG from 10−3 to 3.3, and WeG from 10−10 to 10−3. The above means that the shape of all bubbles generated at the cathode is nearly spherical,
and no unsteady wake forms behind rising bubbles.
3. Measurement techniques
3.1. Visualization of bubble-wall attachment
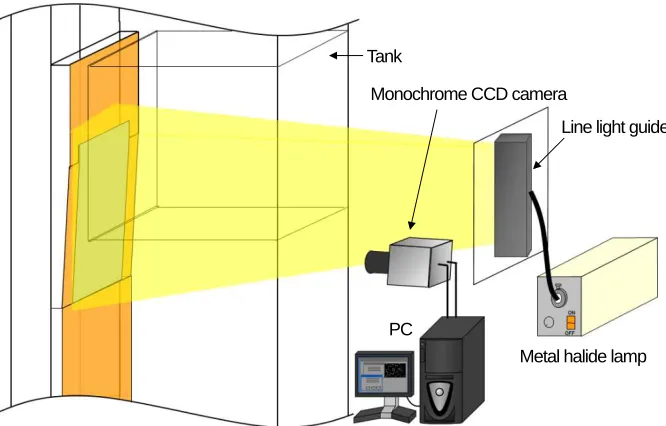
The system for visualizing the bubble-wall attachment is shown in Fig. 6. The system consists of a monochrome charge coupled device (CCD) camera (IMPERX: VGA210−L) with a resolution of 640×480 pixels, a metal halide lamp, a line light guide and a PC. Bubbles are illuminated with the metal halide lamp, which is set behind the camera. The inclination angle of the camera is the same as that of the inclined section of the test plate.
3.2. Bubble size measurement
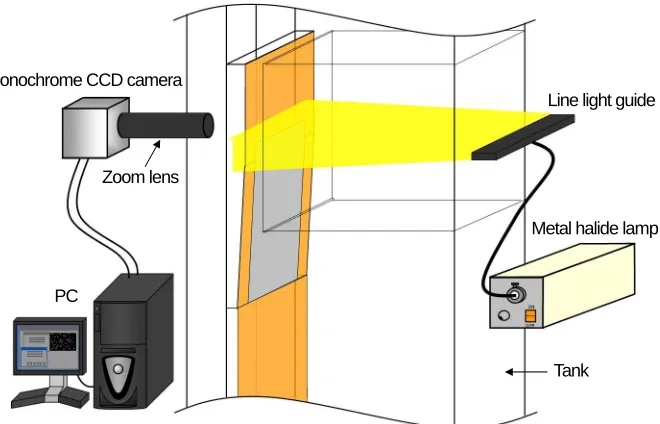
A schematic of the system for measuring the bubble diameter is given in Fig. 7. This system consists of a monochrome CCD camera with a resolution of 640×480 pixels, a zoom lens (MORITEX: ML−Z07545), a metal halide lamp, a line light guide, and a PC. Bubbles are illuminated by the metal halide lamp, which is set facing the camera, and hence, bubble images are obtained as projection images. Because the bubble diameter at the measurement area is likely to increase as a result of coalescence, the bubble size measurements are conducted at two different spatial resolutions. Arrangements with fields of view measuring 2.25×1.69 mm2 and 21.3×16.0 mm2 are used. The measurements are taken 180 s after the initiation of bubble generation. The bubble diameter is
, , , 12 2 GT L G L GT G L 2 GT σ ρ ν ν d u We d u Re d
calculated from the equivalent area of each bubble image.
3.3. Bubble velocity measurement
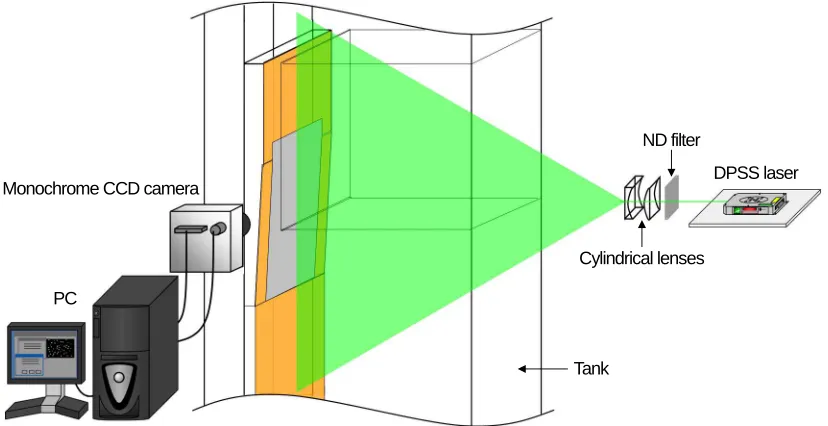
In this study, the velocity of each bubble is measured using the PTV technique. A schematic of the system for measuring the bubble velocity is given in Fig. 8. The system consists of a monochrome CCD camera, a diode-pumped solid state (DPSS) laser (Laser QUANTUM: excel mpc 6000), two cylindrical lenses, a neutral density (ND) filter, and a PC. Bubbles are illuminated by the 2-mm-thick laser sheet produced by the cylindrical lenses. The depth of field of the camera is almost the same as the thickness of the laser sheet. The frame rate and the shutter speed are 100 fps and 1/1000 s, respectively. The camera image format is the same as that used for visualization of bubble-wall attachment. Note that a similar system is also used for the visualization of bubble layer behavior described in Section 5.4. The bubble velocity measurements are taken in the streamwise-wall-normal plane, and the field of view is 24.6×18.5 mm2.
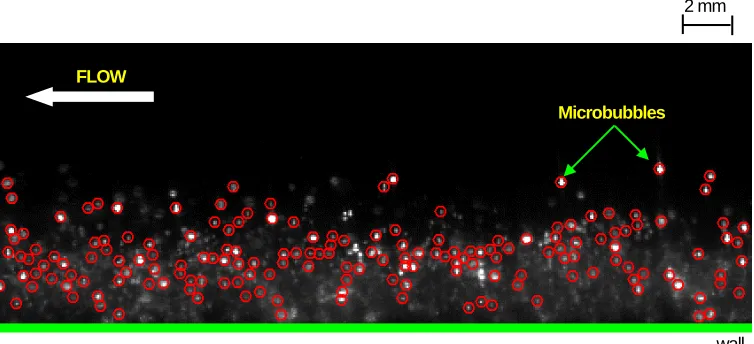
In this study, the particle mask correlation method (Takehara and Etoh [27]) is used to estimate the bubble centroid, considering that the laser light scattered at each bubble interface can be treated in the same way as the solid tracer particles commonly used in the PTV technique. Approximately 200 microbubbles in each instantaneous image are detected (Fig. 9). Then the bubble velocity vector is computed using the three-time-step tracking PTV algorithm (e.g., Kitagawa et al. [28]). The details of the procedure used to estimate the bubble velocity were previously given by Kitagawa and Murai [13]. The uncertainty in the bubble velocity associated with bubble centroid detection is estimated to be 1.1 mm/s, which corresponds to approximately 2 % of the mean rise velocity of microbubbles for the Type C surface.
4. Preliminary experiments
4.1. Dependency of surface wettability of metal plate on soaking time
As described in Sections 2.2 and 2.3, we use salt water as the working liquid. To quantify the stability of the contact angle over time, we measure the dependency of the surface wettability of each metal plate on soaking time in water containing a salt concentration of 0.3 wt%. Before measuring the contact angle, each metal plate was dried for 60 min in air at 50 ˚C. Figure 10 shows the relationship between the soaking time TS and the contact angle. A
relatively notable change in the contact angle is observed between 0 and 60 min, especially for the Type A surface. Moreover, for the Type C surface, the contact angle observed after 60 min is slightly greater than 10 degrees, so the metal surface loses its super-hydrophilicity. Considering the above, each experiment in Section 4.2 and Section 5 will be carried out for a maximum of 20 min.
4.2. Effect of EDL interaction on bubble-wall attachment and bubble size
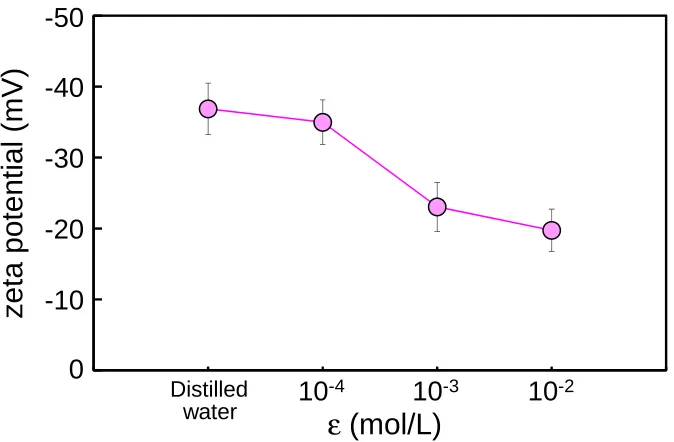
The zeta potential was adjusted by changing the salt concentration of the water, based on the relationship between salt concentration ε and the zeta potential (Fig. 11) obtained by Takahashi [29]. Because the rate of change in the zeta potential is the highest within the range 10−4<ε<10−3 (mol/L), the salt concentration was set to ε =2.0×10⁻⁴
and 1.0×10⁻³ mol/L (i.e., 1.2×10⁻³ and 5.9×10⁻³ wt%, respectively). The bubble flow rate was set to Q=11 and 16 mm3/s. Figure 12 shows images of microbubbles at the inclined section of the test plate for Q=16 mm3/s. The
images were captured 900 s after bubble generation was initiated. Observe that for Type A and C surfaces, there is no visual difference in bubble-wall attachment between the two salt concentrations. According to our analysis using obtained images, the mean bubble sizes observed at the two salt concentrations were similar to within a precision of 1 %. This means that the bubble size is independent of the zeta potential in the range selected. We hence speculate that under the present experimental conditions, the EDL interaction force is sufficiently low compared with the surface tension and viscous forces. Because ε and Q are even higher in the main series of experiments, the effect of the EDL interaction on all results shown in Section 5 is considered to be negligible.
5. Results and discussion
5.1. Bubble-wall attachment
Figures 13−15 show time-series images of bubbles at the inclined section of the test plate. In Section 5, the salt concentration and the bubble flow rate are 0.3 wt% and 55 mm3/s, respectively. Microbubble injection starts at t=0 s. For the Type A surface, many small bubbles attach to the wall at t=30 s (Fig. 13). This is closely linked to the fact that its surface has a poor wettability. While attached to the wall, these bubbles coalesce with other bubbles and hence grow with time. When the bubbles reach a certain size, buoyancy becomes dominant compared with adhesion resulting from surface tension, and the grown bubbles then detach from the wall after sliding along the wall (e.g., Sateesh et al. [32]). When compared with the Type A surface, total number of bubbles attached to the wall for the Type B surface is not only significantly lower, but the size of the bubbles is also smaller (Fig. 14). This is caused by the difference in wall surface wettability between the Type A and Type B surfaces. In addition, the pattern of bubbles attached to the wall is virtually unchanged after t=90 s. For the Type C surface, only a few microbubbles attached to the wall are seen at each time (Fig. 15), which is attributed to its surface having quite good wettability.
5.2. Bubble diameter
Figure 16 shows the mean diameter of bubbles measured at the vertical section II of the test plate. The mean bubble diameter is defined as the Sauter mean bubble diameter, which is given by the following equation:
(2)
where di and ni are the diameter and number of bubbles in group i. We classify two types of bubble diameter, i.e., d<0.5 mm and d>0.5 mm, considering the difference in the total numbers of smaller bubbles and larger bubbles.
For reference, the data obtained near the cathode are added to this figure as PW. In the case of the Type A surface, in the range d<0.5 mm, the mean bubble diameter is 0.12 mm, while in the range d>0.5 mm, it reaches approximately 4.4 mm. This result means that both microbubbles and millimeter bubbles are present in the flow field when microbubbles are injected near the surface with poor wettability. The significant increase in bubble size is closely linked to the bubble-bubble coalescence, as will be discussed in Section 5.3. For the Type B surface, in
the range d<0.5 mm, the mean bubble diameter is 0.11 mm, while in the range d>0.5 mm, it is approximately 2.4 mm. Thus, millimeter bubbles also exist in this case, similarly to the case of the Type A surface. However, the total number of millimeter bubbles is substantially less for Type B than for Type A, as previously seen in Figs. 13 and 14. For this reason, the process of the increase in the bubble size on the Type B surface is expected to be radically different from that of the Type A surface. For the Type C surface, in the range d<0.5 mm, the mean bubble diameter is approximately 20 % higher than that near the cathode (PW), and no bubbles larger than 0.5 mm are observed. To conclude, the use of a wall surface with very good wettability is effective both for suppressing microbubble-wall attachment and for preventing the formation of large bubbles.
5.3. Bubble coalescence
To illustrate the mechanism of the observed increase in bubble size for the Type A and B surfaces, visualizations of a typical scenario of bubble coalescence are shown in Figs. 17 and 18. For reference, equivalent bubble diameters are added to the images. For the Type A surface, the large bubble, marked by a red circle, coalesces at first with neighboring medium-sized bubbles while maintaining almost the same position (Fig. 17a, b). Then, while sliding slowly along the wall, it collides and coalesces with neighboring bubbles of various sizes (Fig. 17c, d). In the case of the Type A surface, even large-sized bubbles with large buoyancy cannot easily detach from the wall because of its poor wettability. This enhances coalescence among the attached bubbles. In contrast, for the Type B surface, as a result of its coalescence with neighboring bubbles (Fig. 18a, b), the large bubble detaches from the wall (Fig. 18b, c). This large bubble then bounces from the inclined wall, coalescing with other attached bubbles on the way (Fig. 18c, d). In the case of the Type B surface, the detachment of bubbles from the wall occurs relatively easily and the total number of bubbles attached to the wall is low. This serves to mitigate any significant increase in bubble size. Here we note that taking the statistical data of bubble coalescence rate is very difficult from a technical point of view. This is because the coalescence occurs frequently throughout the duration of recording, and the moment of the coalescence cannot be resolved in the camera.
5.4. Behavior of bubble layer
In Sections 5.4 and 5.5, we use visualizations and the PTV technique to examine the relationship between the wall wettability and the motion of microbubbles in the vicinity of the nearly vertical wall.
Figures 19−22 show time-series images of bubbles near the wall. In each image, the pink dots are microbubbles and the black circle highlights a millimeter bubble. Figure 23 shows spatio-temporal images of the microbubble layer at a fixed height. Each image was created by combining a single 1×480 pixels rectangle extracted from the center of each image of 500 images of microbubbles. In this figure, y is the distance from the wall, and δav is the
enhances mixing in the microbubble layer (Fig. 21). However, bouncing motion has less ability to yield mixing than wobbling motion, depending on the size of the millimeter bubbles. As a result, the extent of the diffusion of the microbubble layer is reduced (Fig. 23b). Note that in the case of the Type B surface, the effect of the detachment of millimeter bubbles from the wall on the microbubble layer is weak compared with that observed for the Type A surface because detachment occurs before the bubbles can grow significantly. For the Type C surface, there is no attachment of microbubbles to the wall and hence no millimeter bubbles are generated, as shown in Figs. 15 and 16. As a consequence, the microbubble layer near the wall remains stable, and the microbubble layer is thin compared with those of the other two cases (Figs. 22 and 23).
Usually, the concentration of microbubbles diffuses with their velocity fluctuations, as explained by Reynolds-averaged scalar transport equation. The migration of individual microbubbles in the direction perpendicular to the wall, y, is governed by the wall-normal fluctuation velocity, v′. In the present experiments, there is a negative gradient of the mean microbubble concentration in the y direction, so presence of positive v′ makes many microbubbles migrate away from the wall. Its evidence was shown in Fig. 23a, b. For the Type A and B surfaces, average diffusion of microbubble layer from the wall also occurs, according to our analysis with the wall-normal mean velocity of microbubbles.
5.5. Bubble velocity
Figures 24 shows the mean rise velocity of microbubbles u, and the RMS value of the wall-normal fluctuation velocity of microbubbles <v′v′>0.5. Each u and v is estimated as the velocity averaged over all bubbles in the microbubble layer. The vertical axes are normalized by uGT based on the mean bubble diameter near the cathode
(Fig. 5). It is clear from Fig. 24 that in all cases, u/uGT is higher than 20. That is, the mean rise velocity of
microbubbles is much higher than the microbubble-liquid relative velocity. Thus, in the present experiments, individual microbubbles mostly follow the motion of the surrounding liquid. It is also clear from Fig. 24 that the Type C surface, the super-hydrophilic surface, exhibits the highest mean rise velocity u/uGT and the lowest RMS
value <v′v′>0.5/uGT. This result is closely linked to the behavior of the microbubble layer in the vicinity of the wall.
As shown in Section 5.4, for the Type A and B surfaces, the microbubble layer is affected by the motion of millimeter-sized bubbles, and as a result, the number density of microbubbles near the wall is decreased by their transverse diffusion. This leads to a decrease in the mean rise velocity because of reduced buoyancy source and an enhancement in the motion of microbubbles perpendicular to the wall. In contrast, in the case of the Type C surface, no similar trend occurs because there is no generation of millimeter-sized bubbles. Consequently, the bubble rise velocity becomes higher and the motion of microbubbles perpendicular to the wall becomes less active.
6. Summary and conclusions
We have experimentally investigated the influence of wall surface wettability on the collective behavior of hydrogen microbubbles rising along a nearly vertical wall. The wall wettability affects stationary microbubble-wall attachment, which in turn influences the dynamics of two-phase flow within the near-wall layer. We have discussed in detail how changes in the wall surface wettability affect bubble-wall attachment, bubble size distribution, bubble coalescence, and formation of the microbubble layer. Flow visualization and bubble size and velocity measurements have led to the following conclusions: When microbubbles rise along a wall with poor wettability, they attach to the wall and grow in size significantly owing to coalescence between the bubbles located at the wall. The grown bubbles detach and begin to rise along the wall again because of their increased buoyancy/surface tension ratio, and then grow to millimeters in size by colliding and coalescing with other bubbles. The rising millimeter-sized bubbles generate fluid motion including remarkable transverse diffusion of the microbubbles. That is to say, poor wettability significantly affects microbubble diffusion in the direction perpendicular to the wall surface. In the case of very good wettability, in contrast, almost no microbubbles attach to the wall. As a result, generation of the large bubbles does not take place, and the microbubbles are stably kept within a laminar-like smooth microbubble layer.
In summary, the present study has shown that an increase in wall surface wettability leads to (i) a decrease in the number of bubbles attached to the wall, (ii) a decrease in the diameter of millimeter-sized bubbles generated by bubble-bubble coalescence, and (iii) suppression of the transverse diffusion of microbubbles near the wall caused by the motion of millimeter-sized bubbles. The findings described above can be utilized to influence the near-wall transport in systems containing microbubbles.
Nomenclature
d bubble diameter, mm
d32 Sauter mean bubble diameter, mm
g gravitational acceleration, m/s2
n number of bubbles
Q bubble flow rate, mm3/s
TS soaking time in salt water, min
u mean rise velocity of microbubbles, mm/s
v' wall-normal fluctuation velocity of microbubbles, mm/s
y distance from wall, mm
Greek symbols
δav time-averaged microbubble layer thickness, mm
ε salt concentration, mol/L
θ contact angle, deg
µL liquid kinematic viscosity, Pa s
ρL liquid density, kg/m3
σ surface tension, N/m
The authors gratefully acknowledge the support of a Grant-in-Aid for Scientific Research (A) (grant no. 24246033). In addition, the authors wish to thank Dr. T. Shiono of Kyoto Institute of Technology for useful comments and Mr. T. Tabuchi of Kyoto Institute of Technology for his assistance with data collection.
References
[1] B.D. Johnson, R.C. Cooke, Generation of stabilized microbubbles in seawater, Science 213 (1981) 209–211. [2] E. Dressaire, R. Bee, D.C. Bell, A. Lips, H.A. Stone, Interfacial polygonal nanopatterning of stable
microbubbles, Science 320 (2008) 1198–1201.
[3] N.K. Madavan, S. Deutsch, C.L. Merkle, Reduction of turbulent skin friction by microbubbles, Phys. Fluids 27 (1984) 356−363.
[4] A. Ferrante, S. Elghobashi, On the physical mechanisms of drag reduction in a spatially developing turbulent boundary layer laden with microbubbles, J. Fluid Mech. 503 (2004) 345−355.
[5] L. Zhen, Y.A. Hassan, Wavelet autocorrelation identification of the turbulent flow multi-scales for drag reduction process in microbubbly flows, Chem. Eng. Sci. 61 (2006) 7107–7114.
[6] T. Watamura, Y. Tasaka, Y. Murai, Intensified and attenuated waves in a microbubble Taylor-Couette flow, Phys. Fluids 25 (2013) 054107.
[7] Y. Murai, Frictional drag reduction by bubble injection (review), Exp. Fluids 55 (2014) 1773−1800.
[8] V. Mathai, E. Calzavarini, J. Brons, C. Sun, D. Lohse, Microbubbles and microparticles are not faithful tracers of turbulent acceleration, Phys. Rev. Letters 117 (2016) 024501.
[9] S.J. Lee, S. Kim, Simultaneous measurement of size and velocity of microbubbles moving in an opaque tube using an X-ray particle tracking velocimetry technique, Exp. Fluids 39 (2005) 490–495.
[10] T. Makuta, F. Takemura, E. Hihara, Y. Matsumoto, M. Shoji, Generation of micro gas bubbles of uniform diameter in an ultrasonic field, J. Fluid Mech. 548 (2006) 113−131.
[11] K. Hara, T. Suzuki, F. Yamamoto, Image analysis applied to study on frictional drag reduction by electrolytic microbubbles in a turbulent channel flow, Exp. Fluids 50 (2011) 715–727.
[12] W.B. Zimmerman, K.H. Al-Mashhadani, H.C.H. Bandulasena, Evaporation dynamics of microbubbles, Chem. Eng. Sci. 101 (2013) 865−877.
[13] A. Kitagawa, Y. Murai, Pulsatory rise of microbubble swarm along a vertical wall, Chem. Eng. Sci. 116 (2014) 694−703.
[14] Y. Murai, T. Shiratori, I. Kumagai, P.A. Ruehs, P. Fischer, Effective viscosity measurement of interfacial bubble and particle layers at high volume fraction, Flow Meas. Instr. 41 (2015) 121–128.
[15] M. Holmberg, A. Kuhle, J. Garnaes, K.A. Mørch, A. Boisen, Nanobubble trouble on gold surfaces, Langmuir 19 (2003) 10510−10513.
[16] F.M. Chang, Y.J. Sheng, H. Chen, H.K. Tsao, Tiny bubble removal by gas flow through porous superhydrophobic surfaces: Ostwald ripening, Appl. Phys. Lett. 92 (2008) 264102.
[17] N. Nagai, M. Takeuchi, T. Kimura, T. Oka, Existence of optimum space between electrodes on hydrogen production by water electrolysis, Int. J. Hydrogen Energy 28 (2003) 35−41.
[18] M. Kukizaki, T. Wada, Effect of the membrane wettability on the size and size distribution of microbubbles formed from Shirasu-porous-glass (SPG) membranes, Colloids Surf. A: Physicochem. Eng. Asp. 317 (2008) 146−154.
[20] M.K. Chaudhury, G.M. Whitesides, How to make water run uphill, Science 256 (1992) 1539–1541.
[21] J. Fukai, Y. Shiiba, T. Yamamoto, O. Miyatake, D. Poulikakos, C.M. Megaridis, Z. Zhao, Wetting effects on the spreading of a liquid droplet colliding with a flat surface: experiment and modeling, Phys. Fluid 7 (1995) 236, 10.1063/1.868622.
[22] S. Daniel, M.K. Chaudhury, J.C. Chen, Fast drop movements resulting from the phase change on a gradient surface, Science 291 (2001) 633–636.
[23] Y. Tatekura, T. Fujikawa, Y. Jinbo, T. Sanada, K. Kobayashi, M. Watanabe, Observation of water-droplet impacts with velocities of O (10 m/s) and subsequent flow field, ECS J. Solid State Sci. Tech. 4 (2015) N117– 123.
[24] K. Tadanaga, N. Katata, T. Minami, Formation process of super-water-repellent Al2O3 coating films with high
transparency by the sol–gel method, J. Am. Ceram. Soc. 80 (1997) 3213−3216.
[25] T.R. Auton, The lift force on a spherical body in a rotational flow, Journal of fluid Mechanics 183, (1987) 199−218.
[26] L.A. Del Castillo, S. Ohnishi, R.G. Horn, Inhibition of bubble coalescence: Effects of salt concentration and speed of approach, J. Colloid Interface Sci. 356 (2011) 316−324.
[27] K. Takehara, T. Etoh, A study on particle identification in PTV, J. Visualization 1 (1999) 313−323.
[28] A. Kitagawa, K. Sugiyama, Y. Murai, Experimental detection of bubble-bubble interactions in a wall-sliding bubble swarm, Int. J. Multiph. Flow 30 (2004) 1213−1234.
[29] M. Takahashi, ζ Potential of Microbubbles in Aqueous Solutions: Electrical Properties of the Gas-Water Interface, J. Phys. Chem. B 109 (2005) 21858−21864.
[30] C. Yang, T. Dabros, D. Li, J. Czarnecki, J.H. Masliyah, A visualizing method for study of micron bubble attachment onto a solid surface under varying physicochemical conditions, Ind. Eng. Chem. Res. 39 (2000) 4949−4955.
[31] C. Yang, T. Dabros, D. Li, J. Czarnecki, J.H. Masliyah, Kinetics of microbubble–solid surface interaction and attachment, AIChE J. 49 (2003) 1024−1037.
[32] G. Sateesh, S.K. Das, A.R. Balakrishnan, Analysis of pool boiling heat transfer: effect of bubbles sliding on the heating surface, International Journal of Heat and Mass Transfer 48, (2005) 1543−1553.
Fig. 1. Images of aluminum plate surface obtained by scanning electron microscope (a) without and (b) with hot water treatment.
500 nm 500 nm
Fig. 2. Contact angle between droplet and metal surface measured by image processing.
0
20
40
60
80
100
120
140
Type A
Type B
Type C
θ
(d
e
g
)
Type A Type B Type C
Droplet image Type A
Type B
[image:15.595.108.484.188.523.2]
Fig. 3. Schematic of the experimental apparatus. (a) Front view and (b) Side view.
Metal plate V e rt ic a l se ct io n I I In cl in e d se ct io n V e rt ic a l se ct io n I 150 mm
a b
Fig. 4. Schematic of the microbubble generator.
Charcoal absorber Hydrogen bubbles
Test plate
Platinum pipe (anode)
Fig. 5. Histogram of bubble diameter d.
0.0
0.1
0.2
0.3
0.4
0.5
0.01
0.1
F
re
q
u
e
n
c
y
Fig. 6. Schematic of the system for visualizing bubble-wall attachment.
Monochrome CCD camera Tank
Line light guide
PC
Fig. 7. Schematic of the system for measuring bubble diameter.
Monochrome CCD camera
PC
Line light guide
Tank
Fig. 8. Schematic of the system for measuring bubble velocity.
PC
DPSS laser
Tank Monochrome CCD camera
ND filter
Fig. 9. Typical image for bubble centroid detection using particle mask correlation method.
FLOW
2 mm
wall
Fig. 10. Relationship between soaking time TS and contact angle θ (Type A: Hydrophobic surface, Type B:
Hydrophilic surface, Type C: Super-hydrophilic surface).
0
20
40
60
80
100
120
140
0
60
120
180
θ
(d
e
g
)
T
s(min)
[image:22.595.127.458.276.500.2]
Fig. 11. Relationship between salt concentration ε and zeta potential. From Takahashi (2005).
0
10
20
30
40
50
0.000001 0.00001 0.0001 0.001 0.01 0.1
z
e
ta
p
o
te
n
ti
a
l
(m
V
)
ε
(mol/L)
-40
Distilled
10
-410
-310
-2water
-50
-30
-20
-10
Fig. 12. Image of bubbles at t=900 s for Q=16 mm3/s. (a) 2.0×10⁻⁴ mol/l for Type A (Hydrophobic surface), (b) 1.0×10⁻³ mol/l for Type A, (c) 2.0×10⁻⁴ mol/l for Type C (Super-hydrophilic surface) and (d) 1.0×10⁻³ mol/l for
Type C.
10 mm 10 mm
a b c d
[image:25.595.122.473.321.473.2]
Fig. 13. Time-series images of bubbles for Type A (Hydrophobic surface). (a) t=30 s, (b) t=90 s and (c) t=450 s.
Fig. 14. Time-series images of bubbles for Type B (Hydrophilic surface). (a) t=30 s, (b) t=90 s and (c) t=450 s.
Fig. 15. Time-series images of bubbles for Type C (Super-hydrophilic surface). (a) t=30 s, (b) t=90 s and (c) t=450 s.
10 mm 10 mm 10 mm
a b c
a b c
a b c
sliding bubble path-line
High-contrast image
High-contrast image
[image:25.595.123.470.514.678.2]
Fig. 16. Sauter mean bubble diameter (PW: Near-cathode, Type A: Hydrophobic surface, Type B: Hydrophilic surface, Type C: Super-hydrophilic surface). (a) d<0.5 mm and (b) d>0.5 mm.
0
1
2
3
4
5
PW
Type A
Type B
Type C
d
32
(m
m
)
PW Type A
Type B Type C
0.00
0.05
0.10
0.15
0.20
PW
Type A
Type B
Type C
d
32
(m
m
)
PW Type A Type B Type C a
Fig. 17. Time-series images of bubbles for Type A (Hydrophobic surface). (a) ∆t=0.00 s, (b) ∆t=0.04 s, (c) ∆t=0.16
s and (d) ∆t=0.32 s.
Fig. 18. Time-series images of bubbles for Type B (Hydrophilic surface). (a) ∆t=0.0 s, (b) ∆t=0.1 s, (c) ∆t=0.2 s
and (d) ∆t=0.3 s.
10 mm
10 mm
a b c d
a b c d
5.8 mm
1.8 mm
1.9 mm
5.3 mm
5.5 mm
4.6 mm
[image:27.595.69.531.441.612.2]
Fig. 19. Time-series images of bubbles for Type A (Hydrophobic surface). (a) ∆t=0.00 s, (b) ∆t=0.03 s and (c) ∆t=0.05 s.
Fig. 20. Time-series images of bubbles for Type A (Hydrophobic surface). (a) ∆t=0.00 s, (b) ∆t=0.24 s and (c) ∆t=0.39 s.
wall
10 mm
a b c
a b c
Millimeter bubbles attached to wall
Millimeter bubble
Microbubbles
wall
[image:28.595.121.459.428.587.2]
Fig. 21. Time-series images of bubbles for Type B (Hydrophilic surface). (a) ∆t=0.00 s, (b) ∆t=0.03 s and (c) ∆t=0.05 s.
Fig. 22. Time-series images of bubbles for Type C (Super-hydrophilic surface). (a) ∆t=0.00 s, (b) ∆t=0.03 s and
(c) ∆t=0.05 s. wall
wall
10 mm
a b c
a b c
[image:29.595.124.457.435.602.2]
Fig. 23. Spatio-temporal images of microbubble layer. (a) Type A (Hydrophobic surface), (b) Type B (Hydrophilic surface) and (c) Type C (Super-hydrophilic surface).
b
Fig. 24. Microbubble velocity near wall (Type A: Hydrophobic surface, Type B: Hydrophilic surface, Type C: Super-hydrophilic surface). (a) Mean bubble rise velocity u and (b) RMS value of wall-normal bubble fluctuation velocity <v′v′>0.5.
0.0
0.2
0.4
0.6
0.8
1.0
1.2
1.4
1.6
Type A
Type B
Type C
<
v
'v
'>
0 .5/u
G T Type A Type B Type C10
15
20
25
30
35
Type A
Type B
Type C
Fig. 25. Summary of effect of wall surface wettability on microbubble-wall attachment and near-wall microbubble motion (MB: Microbubble, MLB: Millimeter bubble).
Type A (Hydrophobic surface)
Type B (Hydrophilic surface)
Type C
(Super-hydrophilic surface)
Detachment of MLBs from wall
Wobbling motion of MLBs Bouncing motion of MLBs
Bubble-wall attachment No bubble-wall attachment
MBs + MLBs Only MBs
Significant diffusion of MBs
Unstable MB layer in flow field
No significant diffusion of MBs
Stable MB layer in flow field
near wall near wall
(Figs.19-22)
(Fig.23)
(Fig.24) (Fig.16)
(Figs.13-15)
MB injection MB injection
d32=4.4 mm (d>0.5mm)
d32=2.4 mm (d>0.5mm)
u : Type A <Type B <Type C , <v’v’>0.5: Type A >Type B >Type C δ: Type A >Type B
Decrease in u