Manuscript version: Author’s Accepted Manuscript
The version presented in WRAP is the author’s accepted manuscript and may differ from the
published version or Version of Record.
Persistent WRAP URL:
http://wrap.warwick.ac.uk
/
108762
How to cite:
Please refer to published version for the most recent bibliographic citation information.
If a published version is known of, the repository item page linked to above, will contain
details on accessing it.
Copyright and reuse:
The Warwick Research Archive Portal (WRAP) makes this work by researchers of the
University of Warwick available open access under the following conditions.
© 2018 Elsevier. Licensed under the Creative Commons
Attribution-NonCommercial-NoDerivatives 4.0 International
http://creativecommons.org/licenses/by-nc-nd/4.0/.
Publisher’s statement:
Please refer to the repository item page, publisher’s statement section, for further
information.
Towards Optimal Source Location Privacy-Aware
TDMA Schedules in Wireless Sensor Networks
Jack Kirtona,∗, Matthew Bradburya, Arshad Jhumkaa
aDepartment of Computer Science, Univeristy of Warwick, Coventry, United Kingdom, CV4 7AL
Abstract
Source Location Privacy (SLP) is becoming important for wireless sensor
net-works where the source of messages is kept hidden from an attacker. In this paper,
we conjecture that similar traffic perturbation to altering the routing protocol
can be achieved at the link layer through assignment of time slots to nodes.
This paper presents a multi-objective optimisation problem where SLP, schedule
latency and final attacker distance are criteria. We employ genetic algorithms
to generate Pareto-optimal schedules using two fitness criteria, examining the
Pareto efficiency of selecting either and confirming the efficiency by performing
simulations which show a near optimal capture ratio.
Keywords: Genetic algorithm, Wireless Sensor Networks, TDMA, Data
aggregation schedule, Source Location Privacy
1. Introduction
Wireless sensor networks (WSNs) have enabled novel classes of applications
such as monitoring and tracking. Asset monitoring is a task performed by some
WSNs, where some node(s) detects the presence of an asset and transmits data
about the asset back through the network to a base station node known as the
∗Corresponding author
Email addresses: [email protected](Jack Kirton),[email protected]
sink. Even though sensitive data may be encrypted, the process of sending the
message back to the sink, calledconvergecast, implicitly reveals the location of
such an asset, as a potential attacker can trace back over the network traffic to
the source of traffic, to ultimately capture the asset. Source location privacy
(SLP) is the property of keeping the source’s location within the network secret
so as to prevent the capture of the asset.
The idea motivating this area of research was originally developed in [1, 2]
as the panda hunter game. The panda hunter game is based upon the premise
of using WSNs to monitor the population of endangered animals (in this case
pandas) over a large area of their natural habitat, such as in [3, 4]. One of the
typical problems facing endangered animals are poachers. While the data being
transmitted through the network is encrypted (providingcontent-based privacy),
the context in which the data is broadcast must also be protected. Context
can be defined as a collection of attributes derived from the environmental and
temporal situation in which the data was broadcast. This means that typical
content-based privacy solutions (such as encryption) are not sufficient to solve
context-based privacy issues. Hence, there is a need for context-specific privacy
solutions.
The majority of existing work on SLP is focused on providing a solution at
therouting layer of the network stack. In these works, the primary objective is
to perturb the original (convergecast) routing protocol such that the resulting
protocol (i) still routes data to the sink and (ii) the attacker cannot capture
the source while backtracking on the network traffic. Based on the notion that
traffic can be engineered to provide for SLP, we focus on achieving a similar
objective while focusing at the link layer. Using the link layer as opposed to the
routing layer has the advantage of typically sending less control messages [5] and
TDMA-based MAC protocols are often used in cases where timeliness is required. A
TDMA-based MAC protocol works by splitting the timeline into slots and then
allocating slots to nodes in such a way that message transmissions do not result
in collision. Thus, it becomes possible to impose a given traffic pattern on the
network based on slot allocation, providing a basis for traffic engineering at
the link layer level. Specifically, each valid slot assignment for the network will
provide a different pattern of traffic during operation. The principle then is that
the slot assignment can be performed in such a way as to provide SLP within
a class of convergecast protocol known asdata aggregation scheduling (DAS).
DAS works by constructing an aggregation tree rooted at the sink and the slot
allocated to a parent is strictly greater than the slot of any of its children. Thus,
a parent node will propagate aggregated information after collecting messages
from all of its children.
Developing an optimal and valid TDMA schedule is known to be
NP-complete [6]. However, we propose to add SLP as another optimization criterion
in the design of optimal TDMA schedules. Our aim is thus to generate SLP-aware
slot assignments utilising an evolutionary method in order to produce schedules
that are valid for the network and also provide SLP.
We thus make the following contributions:
1. We map the SLP problem onto a GA problem.
2. We present suitablecrossover,mutationandselection operators to expedite
the generation of optimised schedules.
3. We use the notion of Pareto optimality to compare the various generated
schedules and we use two differentfitness functions for analysis.
4. We perform simulations in both ideal and realistic environments, showing
metrics about the generated solutions such as near optimal capture ratio
5. We examine those solutions that lie on the Pareto frontier and determine
the optimal solution of those generated for a specific network configuration.
The remainder of the paper is organised into eight sections. Section 2 explores
other works performed in this area. Section 3 provides models used during this
work. Section 4 outlines the specification for DAS. The genetic algorithm
and operators are detailed in Section 5. Section 6 defines Pareto efficiency
and explains its utility. Section 7 explains the experiments that shall be run
and the results are analysed in Section 8. Finally, Section 9 summarises our
contributions.
2. Related Work
2.1. Source Location Privacy
Phantom routing was first introduced in [1, 2], alongside the the panda hunter
game. Phantom routing is a two stage protocol, firstly transmitting the message
from the source along a directed random walk to a phantom node and secondly
using the routing protocol to continue the transmission to the sink. Two variants
were proposed for altering the routing protocol in stage two; PRS [2] used
flooding and PSRS [1] used single-path routing. There has been much work on
providing SLP since [7].
Since the introduction of the phantom routing concept, more work has been
created to improve the first stage of the protocol (i.e. the directed random
walk). Two solutions that attempt to prevent the random walk from turning
back on itself are GROW [8], which stores previously visited nodes in a bloom
filter, and [9], which uses location angles. While some phantom routing work
has focused on improving the selection of nodes that take part in the random
walk [10], others have used delay to prevent the attacker making positive moves
Several issues with Phantom Routing have been investigated. One such issue
is the performance degradation associated with the use of multiple sources [12].
Another issue is that traffic-analysis of phantom routes that collide with the
network boundary can allow prediction of the source’s location [13].
An alternative technique utilises fake sources to misdirect the attacker. A
fake source sends encrypted and padded messages that appear identical to those
produced by a real source. The idea is to attract the attacker to one of the fake
sources rather than the real one. A fake source technique was proposed in [1]
but was deemed to have a poor performance and said that it was not worth
investigating this class of solutions further. This was contested by [14], which
implemented an alternative technique that provides high levels of SLP. This
class of solution was further expanded in [15, 16] to make it applicable to a wider
variety of areas and to determine parameters online. A drawback to utilising
fake sources is that they often demand considerably higher energy usage than
routing-based techniques.
Solutions exist that combine the use of both phantom routing and fake
sources. [17] generates a routing tree where leaf nodes would be fake sources
that send messages up the tree. A further example is fog routing [18] where
the network is split intofogs, which creates routing loops that trap the attacker
indefinitely. Within the fogs, fake sources are also used. PEM [19] generates
fake sources that perform a walk about during execution.
The solutions presented thus far focused on the local (distributed)
eavesdrop-per [20] where, at any point in time, the attacker only gathers information about
its current neighbourhood and then moves to gain further information. A global
attacker is a stronger attacker with a view of the entire sensor network. The
attacker could either operate their own sensor network deployed over the target
that provide perfect privacy against global attackers are Periodic Collection [22],
where every node broadcasts periodically, and ProbRate/FitProbRate [23], where
nodes broadcast periodically but the rate at which they do so is based on an
exponential distribution.
Cross-layer techniques are those that employ more than one layer of the
network stack to provide SLP. Typically, only the routing layer is used, as is
the case for phantom routing, where a cross-layer solution would additionally
employ another layer, typically the MAC/link layer. Cross-layer techniques are
far less common than the others. In [24] beacon frames at the MAC layer are
modified to carry data to aid in moving messages away from the source, in a
similar fashion to phantom routing. After the message has been propagated far
enough, a standard routing method is used to deliver the message to the sink. A
second method was proposed whereby the message would first be routed to a
pivot node on the first round of beaconing, sending the message further away
on the second round before finally flooding to the sink. Another technique [5]
employs SLP for TDMA DAS networks, where slot allocations are altered at the
MAC protocol level in order to attract the attacker along a diversionary route.
Our solution can be considered a hybrid between the techniques that provide
privacy against a global attacker and local attacker. The solution will have all
nodes periodically broadcasting, but the pattern of broadcasts is done in such a
way that a route is created for a local attacker to follow.
2.2. Genetic Algorithms
Genetic algorithms have been used for a wide variety of purposes in the sensor
networks field. They have been used to find optimal parameters for routing
protocols, such as LEACH [25], where it was used to determine weightings for
combining multiple heuristics to determine which node became the next cluster
between nodes more effectively. In [26], they went so far as to produce a new
routing protocol created by a GA that is comparable to LEACH in order to
use the least energy possible for those networks that harvest energy from the
environment rather than batteries.
Genetic algorithms have also been used in the deployment of WSNs. The
maximum coverage sensor deployment problem (MCSDP) is the problem of
finding the minimum number of nodes required to cover a certain area [27].
Additionally, further work has been performed such that the deployment is
augmented to find a solution that maximises the network lifetime by reducing
energy requirements [28].
The allocation of TDMA time slots using genetic algorithm-related methods
has previously been investigated [6, 29, 30] and finding an optimal TDMA
schedule has been shown to be NP-complete [6]. So generating a TDMA schedule
is a suitable problem for obtaining a near optimal result with GAs [31]. As the
problem exists in NP, a benefit is that there exists a polynomial-time method of
checking a solution’s validity which is necessary as an efficient method is required
for use as a fitness function.
A downside of GAs is that they typically run offline making it unsuitable
for WSNs that determine a route online in response to changing conditions.
Techniques such as network reprogramming can be used to update the TDMA
schedule, but tend to be expensive in terms of energy. While some online GA
implementations exist, due to a sensor node’s limited resources, it is not feasible
3. Models
3.1. Network Model
A wireless sensor node (or node) is a device with a unique identifier that has
limited computational capabilities. It has a wireless network interface that
enables it to communicate directly with other nodes within its communication
range. The set of nodes with which a given nodencan directly communicate
with is called the neighbours of n. We assume that all nodes in the network
have the same communication range. There exists a distinguished node in the
network called asink, which is responsible for collecting data and which acts as
a link between the WSN and the external world. Other nodes sense the presence
of an asset and then route the data via normal messages along a computed route
to the sink. We assume that any node can be a data source and only a single
node is a data source at any time. We assume that the network is time-triggered,
i.e., all node will periodically send a message to the sink, irrespective of whether
it has sensed an asset.
We assume that nodes sendhNormalimessages which are encrypted. The
source node includes its ID in the encrypted message so that the sink can infer
an asset’s location; as we assume the network administrators will record where
they put nodes. We do not assume that WSN nodes have access to GPS due to
the resulting increase in energy cost.
3.2. Attacker Model
The authors of [20] presented a taxonomy attacker strength for WSNs and show
that it could be factored along two dimensions, namelypresence andactions.
Presence captures the network coverage of the attacker, while actions capture the
attacks the attacker can launch. For example, presence could be local, distributed
In this taxonomy, the attacker we assume is a(mobile) distributed eavesdropper
based on the patient adversary, introduced in [1]. Such an attacker is reactive in
nature and executes the following steps:
1. Start: The attacker initially starts at the sink.
2. Update: When the attacker is co-located at a nodenand receives (i.e.,
overhears) a message that it has not been received before1, from a neighbour
nodem, the attacker will move tom. Thus, in a normal setting, the attacker
is geared to moving closer to the source as he only follows unique messages.
3. End: Once the source has been found, the attacker will no longer move.
Most often, the attacker will execute theUpdate step. Repeating this action for
a number of times may enable the attacker to capture the asset as the attacker
performs a traceback on the traffic flow to the asset. We assume that the attacker
has the capability to perfectly detect which direction a message arrived from,
that it has the same radio range as the nodes in the network, and also has a
large amount of memory to keep track of information such as messages that have
been heard. This is commensurate with the attacker model used in [5].
3.3. Safety Period Model
The overall objective of any WSN-based SLP solution is to ensure that the asset
(at a specific location) isnever captured through the WSN and the attacker is
instead required to perform an exhaustive search. However, two issues arise: (i)
if the asset is not mobile, then the attacker can take as long as it requires to
perform an exhaustive search of the network, which makes providing SLP in this
case irrelevant. (ii) On the other hand, if the asset is mobile, then performing
an exhaustive search of the network is unsuitable as the attacker may approach
1Previous work [1] has assumed that the attacker has the ability to identify whether a
a given location after some considerable time only to find out that the asset has
moved. If the asset is mobile, which we assume, but spends a long time in a
single location, then we do not consider the asset to be mobile. Thus, the SLP
problem can only be considered when it istime-bounded, i.e, when the asset has
to be captured within a given time window.
This notion of time bound has been termed assafety period in the literature.
The aim of SLP techniques is to either to maximise the safety period, i.e., the
higher the time to capture, the higher the SLP level provided [1]. Or to reduce
capture within this time window.
3.4. Routing Protocol
In WSNs, a routing protocol is required to transfer data from a source node to
the sink node. The routing protocol is considered to be a set of paths that end
at the sink. A message will travel along at least one of the paths to the sink. A
message may follow the same path as previous messages to the sink or it may
follow a different path. The routing protocol we assume in this paper is flooding
where every message will follow all the possible paths to the sink.
4. DAS Problem Specification
Data aggregation scheduling (DAS) is a type of convergecast protocol where each
parent node receives information fromall of its children before broadcasting an
aggregated message. DAS is defined as a series of conditions [5], as follows:
1. A node can only be allocated one time slot in which to broadcast.
2. All nodes, excluding the sink, will be allocated at least one time slot. With
condition 1, this means that each node will receive exactly one time slot
3. Whenever a node broadcasts a message, at least one of its neighbours
closer to the sink will transmit in a later slot. One of the neighbour nodes
that broadcast later will be this node’s parent.
4. The schedule will be collision-free. This requires that nodes within the
same collision group (i.e. two-hop neighbourhood) must have unique time
slots.
5. Genetic Algorithm
5.1. Algorithm
The algorithm selected for this work is the generic and standard genetic algorithm
using non-standard and optimised genetic operators for the problem domain.
One reason for this selection is so that we can build a genetic algorithm to our
own required specification and optimise for the SLP problem. Another reason
is that [32] finds that using a scalar combination of fitness scores speeds up
computation over using a multi-objective algorithm, at the disadvantage of being
unable to discover concave Pareto fronts. We do not expect the Pareto front to
be concave in this instance and as such do not suffer from this disadvantage.
However, we also examine the usage of a more advanced, true multi-objective
GA, NSGA-II [33], as a comparison.
5.2. Genome Representation
For this problem, the representation must contain a graphG= (V, E), where
E is the set of edges between nodes inV who are within communication range.
Each node inV is also labelled with a slot value, the number of hops from the
sink, a parent node and a set of child nodes.
The reason that this representation differs from that used by [6] is that it
is incapable of portraying the additional constraints required by DAS, so a full
5.3. Genetic Operators
As described in [6], providing operators with a context of the problem domain
and forcing the creation of valid solutions after each operator’s function can aid
in providing better solutions using less generations at a performance cost at each
step. The operators described below each produce genomes that are valid DAS
solutions.
5.3.1. Initialisation
The initialisation function is required to create an individual to be included in
the initial population.
Algorithm 1 performs the network initialisation. Within the algorithm, the
first stage is to initialise all attributes of each node with sensible defaults. The
parametermaxSlotsis used to provide a number ofpseudo slots for the genetic
algorithm to assign during operation. Providing a number too large will result
in more slot values being different (thus more slots used in the final solution)
where providing too few will result in the genetic algorithm struggling to find
a solution. In the final solutions, all pseudo slot values are normalised to their
minimum range. The next stage creates a DAS parent-child tree from the nodes,
changing slot values to ensure the genome conforms to the DAS specification.
The function,SetParent, sets a node’s parent and also adds the node to the
parent’schildrenset.
5.3.2. Crossover
The crossover operator is used to combine two parent individuals together to
create two children which incorporate features from both parents.
The crossover operation is contained within three functions in Algorithm 2:
Crossover,OneCrossoverandCheckCrossover. Crossoveris a wrapper
Algorithm 1Algorithm for initialising a genome
. g: genome,sink: sink node,maxSlots: number of pseudo slots
1: functionInitialise(g, sink, maxSlots)
.First initialise all nodes with some values
2: for allnode∈gdo
3: ifnode=sinkthennode.slot:=maxSlots
4: elsenode.slot:=RandomInteger(1, maxSlots−1) 5: node.hop:=ShortestPathLength(g, node, sink) 6: node.parent:=⊥
7: node.children:=∅
8: repeat:= 1
9: whilerepeatdo
10: repeat:= 0
.Assign a parent to each node without one
11: for allnode∈ {n|n∈g\ {sink} ∧n.parent=⊥}do
12: slotChanged:= 0
13: parentChoice:=GetPotentialParents(g, node)
14: SetParent(g, node,Choose(parentChoice)) 15: ifnode.slot≥node.parent.slotthen 16: node.slot:=node.parent.slot−1 17: slotChanged:= 1
.Resolve collisions
18: nhs:=GetTwoHopNeighbourhoodSlots(g, node)
19: whilenode.slot∈nhsdo
20: node.slot:=node.slot−1 21: slotChanged:= 1 22: ifslotChangedthen
23: for allc∈node.childrendo
24: SetParent(g, node,⊥)
25: repeat:= 1
26: returng
and returns the product of performing crossover for each child. OneCrossover
gets the subnetwork that is being introduced to the child and overwrites those
elements in the new child genome. CheckCrossover is where any issues
pertaining to the validity of DAS get resolved, by starting at the crossover node
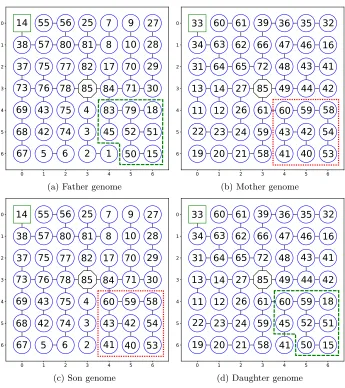
[image:14.612.145.478.133.438.2]and recursing through all descendents.
Figure 1 shows an example execution of this method. Starting with a father
and mother genome, the algorithm begins by selecting the crossover node, which
in this case is at the coordinates (4,4). Then, the DAS parent-child tree structure
from the father is transplanted into a clone of the mother solution (the daughter)
and the same occurs for the mother to the father (creating the son). The slot
Algorithm 2Crossover two genomes
. f ather: father genome,mother: mother genome,sink: sink node
1: functionCrossover(f ather, mother, sink)
2: son,daughter:=f ather,mother
3: crossoverN ode:=Choose(f ather\ {sink})
4: son:=OneCrossover(son, mother, crossoverN ode)
5: daughter:=OneCrossover(daughter, f ather, crossoverN ode)
6: returnson, daughter
7: functionOneCrossover(g1, g2, crossoverN ode)
8: subnetwork:=GetDescendents(g2, crossoverN ode)
9: for allnode∈subnetworkdo
10: g1[node].slot:=g2[node].slot
11: ifg2[node].parent∈subnetworkthen 12: SetParent(g1, node, g2[node].parent)
13: else .This occurs with the crossoverNode
14: SetParent(g1, node,⊥)
15: CheckCrossover(g1, crossoverN ode)
16: returng1
17: functionCheckCrossover(g, node)
18: ifg[node].parent=⊥then
19: parentChoice:=GetPotentialParents(genome, node) 20: SetParent(g, node,Choose(parentChoice))
21: ifg[node].slot > g[node].parent.slotthen 22: g[node].slot:=g[node].parent.slot
23: nhs:=GetTwoHopNeighbourhoodSlots(g, node)
24: whileg[node].slot∈nhsdo
25: g[node].slot:=g[node].slot−1
26: for allchild∈g[node].childrendo
27: CheckCrossover(g, child)
in the child genomes.
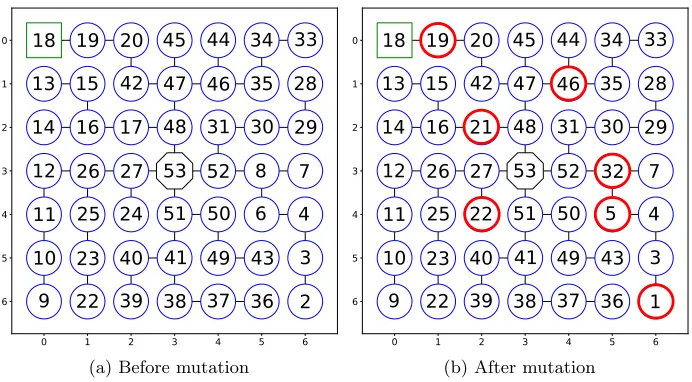
5.3.3. Mutation
The mutation operator is an attempt to further introduce diversity into the
population to prevent stagnation.
Algorithm 3 begins by defining a range in which the new slot value should
be chosen. ThemaxDif f parameter denotes the maximum range in which a
slot value can be altered. Should the node have no children, the slot value is
reduced by one, which repeats should there be a slot collision in the two-hop
neighbourhood. The reason for this is to prevent a large variety of different slot
14 55 56 25 7 9 27
38 57 80 81 8 10 28
37 75 77 82 17 70 29
73 76 78 85 84 71 30
69 43 75 4 83 79 18
68 42 74 3 45 52 51
67 5 6 2 1 50 15
(a) Father genome
33 60 61 39 36 35 32
34 63 62 66 47 46 16
31 64 65 72 48 43 41
13 14 27 85 49 44 42
11 12 26 61 60 59 58
22 23 24 59 43 42 54
19 20 21 58 41 40 53
(b) Mother genome
14 55 56 25 7 9 27
38 57 80 81 8 10 28
37 75 77 82 17 70 29
73 76 78 85 84 71 30
69 43 75 4 60 59 58
68 42 74 3 43 42 54
67 5 6 2 41 40 53
(c) Son genome
33 60 61 39 36 35 32
34 63 62 66 47 46 16
31 64 65 72 48 43 41
13 14 27 85 49 44 42
11 12 26 61 60 59 18
22 23 24 59 45 52 51
19 20 21 58 41 50 15
[image:16.612.133.478.118.506.2](d) Daughter genome
Figure 1: An example of performing crossover at node (4,4)
refined to be within the acceptable range that the children of the node set (i.e.
a parent node cannot have a lower slot value than its children). A new slot is
then attempted to be randomly selected (avoiding slot collisions) subject to the
parameterattemptswhich limits the number of times this is tried before exiting
with failure.
Figure 2 shows an example of the algorithm in operation. For the example,
Algorithm 3Randomly alter slot values within DAS constraints
. g: genome,node: node to mutate
. maxDif f: the maximum range of values to select new slot from
. attempts: the number of attempts to make at mutating the slot
1: functionMutate(g, node, maxDif f, attempts)
2: highest,lowest:=node.parent.slot,highest−maxDif f
3: nhs:=GetTwoHopNeighbourhoodSlots(g, node) 4: ifnode.children=∅then
5: node.slot:=highest−1
6: whilenode.slot∈nhsdo
7: node.slot:=node.slot−1
8: else
9: for allchild∈node.childrendo
10: ifchild.slot > lowestthen 11: lowest:=child.slot
12: whileattempts >0do .If attempts reaches zero, mutation failed
13: newSlot:=RandomInteger(lowest+ 1, highest−1) 14: ifnewSlot /∈neighbourhoodSlotsthen
15: node.slot:=newSlot
16: break
17: else
18: attempts:=attempts−1
useful to see the effect of the operator. All cases of the algorithm can be seen,
such as nodes with no children being reduced minimally, nodes with children
that have a range of slots to select from and finally nodes that have children but
failed to change slot.
5.3.4. Selection
The selection operator is used to select solutions from the new population to be
entered into the next generation.
In this work we shall use standard tournament selection where the number of
solutions in each tournament is 2. Algorithm 4 shows the tournament selection
method for a variable value of the number of solutions per tournament,t.
5.4. Fitness Functions
The fitness function is used to assign a numericalworth to each individual in
the population based upon its perceived quality. This score is then used by
the selection operator in order to choose the best individuals for crossover and
18 19 20 45 44 34 33
13 15 42 47 46 35 28
14 16 17 48 31 30 29
12 26 27 53 52 8 7
11 25 24 51 50 6 4
10 23 40 41 49 43 3
9 22 39 38 37 36 2
(a) Before mutation
18 19 20 45 44 34 33
13 15 42 47 46 35 28
14 16 21 48 31 30 29
12 26 27 53 52 32 7
11 25 22 51 50 5 4
10 23 40 41 49 43 3
9 22 39 38 37 36 1
[image:18.612.133.479.121.312.2](b) After mutation
Figure 2: An example mutation using Algorithm 3
Algorithm 4Select an individual from the population using tournament selec-tion
. pop: population,t: number of genomes to compete in each tournament
1: functionSelect(pop, t)
2: best:=pop[RandomInteger(0, pop.size)]
3: ift= 1then returnbest
4: fori:= 2→tdo
5: next:=pop[RandomInteger(0, pop.size)]
6: ifFitness(next)>Fitness(best)thenbest:=next
7: returnbest
In this work we shall examine results from two different fitness functions.
Algorithm 5 shows the first fitness function, which simply provides a value in the
range [0,1] depending on the total number of slots used to generate the solution,
where 0 would be given if each node had its own time slot (the worst case) and 1
if each node had the same slot, which is not possible due to the DAS constraints.
Therefore, the best achievable score for this function is unknown. Additionally,
the function returns 0 if the attacker path intersects the source, as the solution
does not provide SLP.
The second function (Algorithm 6) performs the same as the first with the
Algorithm 5Slot usage fitness
. g: genome,src: source node
1: functionSlotUsageFitness(g, src)
2: ifsrc∈AttackerPath(g)then return0 3: uniqueSlots:={node.slot|node∈g}
4: return(|g| − |uniqueSlots|)/|g|
Algorithm 6Distance from source and slot usage fitness
. g: genome,source: source node
. w: the weighting for attacker paths end points distance to the source
1: functionDistAndSlotUsageFitness(g, src, w)
2: ifsrc∈AttackerPath(g)then return0 3: endN ode:=AttackerPathEnd(g)
4: dist:=ShortestPathLength(g, src, endN ode)
5: diameter:=NetworkDiameter(g) 6: distScore:=w×(dist / diameter)
7: slotScore:= (1−w)×SlotUsageFitness(g, src)
8: returndistScore+slotScore
as possible. With the first function, the attacker path can be liable to take the
attacker closer to the source. This is undesirable, as in the case of link failures
and node crashes along the path that we wish the attacker to take, the attacker
could leave the predicted path and travel to the source, thus capturing the asset.
In this work we shall only be examining the occurrence of link failures due to
noise on the wireless channel. This function also provides a value in the range
[0,1], with 1 being scored if the path leads the attacker as far away as allowed
by the network. By using the parameterwwe provide a weighting to the further
distance aspect over the regular total slot reduction. In this work, w= 0.25,
meaning that slot usage is weighted at 75% and the distance is weighted 25% of
the total fitness score returned.
The reason for comparing two fitness functions is that the second provides a
better solution in an unreliable network, but it is unknown how this will affect
6. Pareto Efficiency
After running the genetic algorithm, multiple competing solutions will be
gener-ated. Since we are concerned with maximising the level of source location privacy
while minimising the number of slots and maximising the path distance between
a source and the end point of an attacker, this search process is a multi-objective
optimisation process. As such, no universal definition of an optimum can be
given. One solution for an appropriate definition of optimality in multi-objective
optimization was given by Vilfredo Pareto in 1896. This definition expresses
that a solution isPareto-optimal if there exists no other feasible solution which
would decrease some objective without causing a simultaneous increase in at
least one other objective [34].
More formally, consider a set of n solutions si. . . sn, with a solution si
being a vector of m attributes, i.e., si = ha1i. . . ami i, a j
i ∈ R. A solution si
is Pareto-optimal if there is no other feasible solution sj where j 6= i such
that, for a given set ofm utility functionsU1. . . Um, hU1(a1j), . . . , Um(amj )i ≥
hU1(a1i), . . . , Um(ami )iwith at least one attributea
k
j such that Uk(akj)> Uk(aki).
On the other hand, if such a solutionsj exists, then we say thatsj is a Pareto
improvement onsi.
Given a set of feasible solutions (and a way of valuing them), the Pareto
frontier is the set of choices that are Pareto efficient. Formally, given a solution
spaceS, the Pareto frontier ofS, denoted by P(S) is P(S) = {s ∈ S|∀s0 ∈
S s.ts0 is not a Pareto improvement ons}.
Using Pareto dominance allows a comparison of many solutions, where one
can easily analyse the tradeoffs between selecting any one solution compared
7. Experimental Setup
In this section we describe the environment and methods used to generate the
results in Section 8. This genetic algorithm2 was implemented using Python,
the Pyevolve genetic algorithm framework [35], and the graphing library
Net-workX [36]. We also attempted to utilise an implementation of the multi-objective
genetic algorithm NSGA-II [33].
7.1. Network Configuration
To test the genetic algorithm and subsequently use these solutions in simulations,
the simplest configuration for the network is an 11×11 square grid of nodes
(121 nodes). The separation distance between each node is such that nodes can
communicate vertically and horizontally but not diagonally. The source will be
placed in the top-left corner while the sink will be placed in the centre.
A total of 100 solutions per fitness function (for a total of 200) will be created
by the genetic algorithm. Each of these will have a unique slot assignment
compared with the others, providing a different operating scenario between each
solution. To gather results about the efficacy and efficiency of the solutions,
approximately 600 runs of each solution will be performed in the simulator each
for two different communication models, providing a total of 240,000 simulation
runs.
7.2. Genetic Algorithm Parameters
The main parameters for a genetic algorithm areelitism,crossover rate,mutation
rate,population size andtotal generations.
Elitism is the number of copies of the best solution from the previous
genera-tion that should be entered into the next generagenera-tion unaltered (i.e. no crossover
2The source code for the genetic algorithm can be found at
or mutation). A value of 1 was chosen for this parameter as taking a single
copy of the best solution from the previous generation to the next allows for
the genetic algorithm terminating, ensuring that at least one solution that is
supposedly good is available to present at the end of the algorithm.
The values of crossover rate, mutation rate and population size are set
to the Pyevolve defaults of 90%, 2% and 80 respectively. The values chosen
for parameters are sensible defaults. Finding the most optimal parameter
configuration is left as an exercise for future work. Total generations for this
work is capped at 200, which was shown through testing to be a reasonable
compromise between time taken and quality of result. For results that optimise
each fitness score further, more generations can be used at the cost of time.
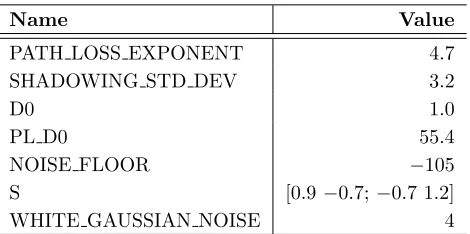
7.3. Simulation & Algorithm Parameters
The WSN simulation environment that is used in this work is TOSSIM, TinyOS’s
(version 2.1.2) own discrete event network simulator3. Two communication
mod-els are compared, the first being anideal model which sets a fixed signal receive
strength when in range, making it almost 100% reliable. The second, named
low-asymmetry, is generated using the LinkLayerModel provided with TinyOS
and the parameters shown in Table 1. Low-asymmetry gives the simulation a
small probability of packet losses and links becoming unidirectional, more akin
to a real-world application. The noise model used is the first 2500 lines of the
casino-lab noise file provided with TinyOS.
Most parameters for the algorithm are provided by the generated genetic
algorithm solution (i.e. number of slots). Two that are not provided are the
dissemination and slot period lengths. These values were set to 0.5 seconds and
0.1 seconds respectively. During the simulation, no data will be transmitted
3The source code for the implementation using TinyOS is available athttps://bitbucket.
Table 1: Low-Asymmetry LinkLayerModel Parameters
Name Value
PATH LOSS EXPONENT 4.7
SHADOWING STD DEV 3.2
D0 1.0
PL D0 55.4
NOISE FLOOR −105
S [0.9−0.7;−0.7 1.2]
WHITE GAUSSIAN NOISE 4
in the dissemination period as all nodes are aware of the data they require
at compile time. Time synchronisation would normally be used in this period
but this is not modelled by the simulator. Given the number of slots and the
dissemination/slot periods we can calculate the rate at which the source sends
messages (the source period) as we wish for the source to send a single message
per TDMA period.
A safety period (the length of time we believe we can protect the source from
capture) is also provided. We state that the time taken to reach the source in a
protectionless TDMA DAS environment isperiodLength×(∆ (Sink−Source) + 1),
where ∆ (Sink−Source) is the number of hops between the sink and source,
as this is the time it would take for the attacker to travel one of the shortest
paths to the source. Therefore, we selected an upper bound ofperiodLength×
(∆ (Sink−Source) + 1)×2. The reasoning behind this value is that if the
attacker has not reached the source within a factor of 2x that of the shortest
path then it is trapped somewhere in the network, unable to reach the source.
7.4. Experiments
We will examine four metrics from the TOSSIM simulations: messages sent,
capture ratio, message receive ratio and latency. A comparison will be made
between combinations of fitness function and communication model for each
We expect the number messages sent to be similar across all solutions. There
will likely exist variation between solutions depending on the total number of
slots utilised, as this implicitly defines the length of a TDMA period. Better slot
utilisation will result in a quicker TDMA period, resulting in a higher message
send rate.
Capture ratio should be 0% for both fitness functions with the ideal
commu-nication model. This is because there should be no radio interference causing
the attacker to leave the predicted path. However, with the low-asymmetry
communication model, because of the noise and varying link qualities, both
fitness functions should show varying capture ratios. Between the two fitness
functions, it is expected that the slot usage fitness function will have more
solutions of a higher capture ratio than that of slot usage and path distance.
Message received ratio is the percentage of normal messages sent by the
source that were received by the sink. The message received ratio should be
close to 100% for the ideal communication model due to perfect link quality,
whereas low-asymmetry will provide slightly less.
Latency is the amount of time taken for normal messages sent by the source
to reach the sink. We expect that the messages will travel from source to sink in a
maximum time of the TDMA period (excluding the dissemination period). This
is due to the design of DAS, where messages should be able to travel from any
point in the network to the sink in a single period due to the path of increasing
slot assignments.
Those solutions selected from the Pareto frontier will be examined in further
8. Results
8.1. Genetic Algorithm
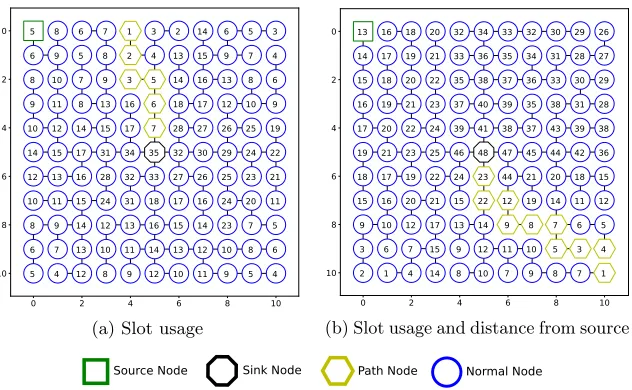
Figure 3 shows two example solutions produced by the GA, each using a different
fitness function. Figure 3a shows a solution using the standard slot usage fitness
function and Figure 3b shows a solution using slot usage and optimising the
attacker path end’s distance from the source.
In both examples contained in Figure 3, blue circles are normal nodes with
the source node being labelled as a green square in the top left and the sink node
being placed in the centre as a black octagon. The yellow hexagons are the nodes
that the GA has predicted the attacker will follow through the network, known
as path nodes. The reason that the attacker will follow this path is that each
next node in the path has the lowest slot assignment in the surrounding one-hop
neighbourhood, which means the attacker will hear from that node before any
others. The connecting lines between the nodes show the DAS parent-child
hierarchy, which is a tree structure rooted at the sink node. As previously stated,
to ensure DAS-compliance, each node (bar the sink node) must have a parent
that has a higher slot than itself and the connecting lines show that DAS has
been preserved.
What isn’t shown clearly by the examples is that the GA produces attacker
paths that cause the attacker to oscillate between the end two nodes of the path
indefinitely. This is because each of the two nodes at the end of the path has
the lowest slot in the one-hop neighbourhood surrounding the attacker.
Examining the attacker paths visually, the difference between the two fitness
functions can clearly be seen. As expected, including an optimisation to have
the attacker travel as far away from the source as possible has caused the genetic
algorithm to produce solutions that do just that, forcing the attacker into the
0 2 4 6 8 10 0 2 4 6 8 10
5 8 6 7 1 3 2 14 6 5 3
6 9 5 8 2 4 13 15 9 7 4 8 10 7 9 3 5 14 16 13 8 6 9 11 8 13 16 6 18 17 12 10 9 10 12 14 15 17 7 28 27 26 25 19 14 15 17 31 34 35 32 30 29 24 22 12 13 16 28 32 33 27 26 25 23 21 10 11 15 24 31 18 17 16 24 20 11 8 9 14 12 13 16 15 14 23 7 5 6 7 13 10 11 14 13 12 10 8 6 5 4 12 8 9 12 10 11 9 5 4
(a) Slot usage
0 2 4 6 8 10
0 2 4 6 8 10
13 16 18 20 32 34 33 32 30 29 26 14 17 19 21 33 36 35 34 31 28 27 15 18 20 22 35 38 37 36 33 30 29 16 19 21 23 37 40 39 35 38 31 28 17 20 22 24 39 41 38 37 43 39 38 19 21 23 25 46 48 47 45 44 42 36 18 17 19 22 24 23 44 21 20 18 15 15 16 20 21 15 22 12 19 14 11 12 9 10 12 17 13 14 9 8 7 6 5 3 6 7 15 9 12 11 10 5 3 4 2 1 4 14 8 10 7 9 8 7 1
(b) Slot usage and distance from source
[image:26.612.149.465.121.316.2]Source Node Sink Node Path Node Normal Node
Figure 3: Example solutions produced by the GA using different fitness functions
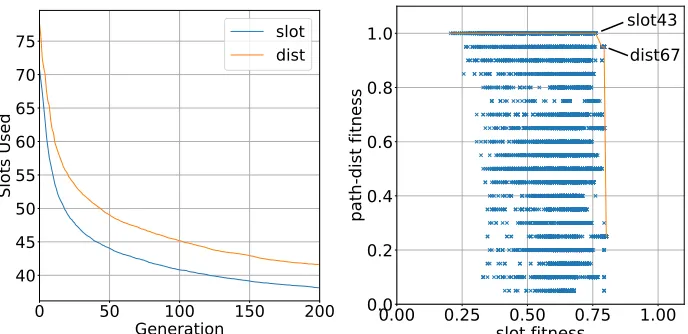
Figure 4a shows the cost of the additional fitness constraint, whereslot is the
original fitness function anddistis the function with the distance constraint. The
plot shows generations against the number of slots used by the best candidate of
that generation. The plot was produced using averages from 100 runs of each
fitness function. This plot shows that there is an increase in the number of
slots required to support the additional distance optimisation. However, the
difference in total slots used is still a small value, although this would rise on
more connected networks with larger numbers of nodes.
8.2. Pareto Efficiency
Figure 4b shows a plot of solutions comparing the slot usage and path distance
fitness functions. Each point on the plot shows solutions at various generations.
The Pareto frontier can be seen as the maximal boundary over all of the solutions.
The plot shows that solutions can easily maximise the path distance fitness
function, which is intentional as the path distance can only be as large as
the network allows, thus gaining the maximum score. The slot usage fitness
0
50
100
150
200
Generation
40
45
50
55
60
65
70
75
Slots Used
slot
dist
(a) A comparison of the slots used for the two fitness functions
slot43
dist67
[image:27.612.135.479.122.289.2](b) Slot usage fitness versus path distance fitness
Figure 4: Comparison of fitness functions
maximum of approximately 0.8, on which the Pareto frontier lies. Along the top
of the plot, the solutions have maximised the path distance score but slot fitness
increases as the solution is further to the right. This means every solution on
the path-dist = 1.0 line that has a solution to its right is completely dominated
by this solution. This means that along this line, the only solution that should
be selected is the farthest to the right. With this solution and the others on the
plotted line make up the pareto frontier. The two most promising solutions are
slot43anddist67.
8.3. Simulations
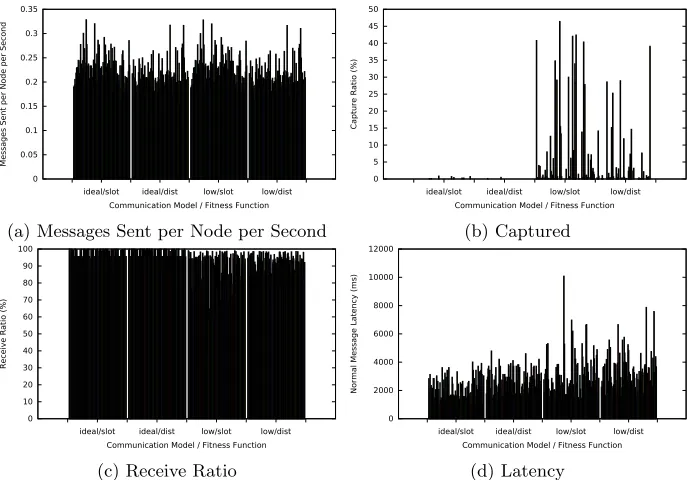
The graphs in Figure 5 plots metrics from the output of the TOSSIM simulations,
with each column being an output from the GA.
Firstly, Figure 5a shows a plot of messages sent per node per second. Using
the rate of message sending rather than total messages sent is a better metric
as simulations may not last the full safety period if the attacker happens to
functions and identical when changing communication model. This indicates
that the differences are caused by slot utilisation, as predicted.
Figure 5b plots the capture ratio of solutions. The plot shows that using
the ideal communication model, capture ratio is very low. With low-asymmetry,
the capture ratio dramatically increases for both fitness functions, however the
additional path distance constraint provides an improvement in both the number
of high capture ratio solutions and the level of capture ratio on these solutions.
Low-asymmetry causes these issues as the attacker leaves the path that the GA
predicts it will follow, due to failing links as well as additional links that the GA
did not expect (diagonal communication). This follows the predicted outcome.
Figure 5c plots the message receive ratio of messages sent from the source
that are received by the sink. The ideal communication model performs with
almost 100% receive ratio while low-asymmetry has a slightly lower rate due to
the probability of link failures.
Finally, Figure 5d plots the latency of normal messages sent by the source
to be received at the sink. The predicted outcome for all solutions is that the
latency is bounded by a single TDMA period, excluding dissemination period.
However, a handful of solutions of the low-asymmetry communication model do
not abide by this prediction, appearing to approximately double the length of
time taken for the message to travel from the source to the sink. A potential
reason for this is that the normal messages are generated by the application
layer, starting the latency timing, at a point after the transmission slot has
ended before the start of the next period. This could lead to a near doubled
latency for the message.
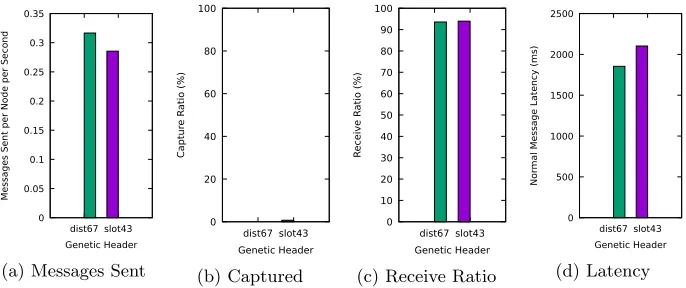
The two solutions making up the Pareto frontier are compared in Figure 6,
using the low-asymmetry communication model. Messages sent and normal
0 0.05 0.1 0.15 0.2 0.25 0.3 0.35
ideal/slot ideal/dist low/slot low/dist
Messages Sent per Node per Second
Communication Model / Fitness Function
(a) Messages Sent per Node per Second
0 5 10 15 20 25 30 35 40 45 50
ideal/slot ideal/dist low/slot low/dist
Capture Ratio (%)
Communication Model / Fitness Function
(b) Captured 0 10 20 30 40 50 60 70 80 90 100
ideal/slot ideal/dist low/slot low/dist
Receive R
atio (%)
Communication Model / Fitness Function
(c) Receive Ratio
0 2000 4000 6000 8000 10000 12000
ideal/slot ideal/dist low/slot low/dist
Normal Message Latency (ms)
Communication Model / Fitness Function
[image:29.612.134.479.122.362.2](d) Latency
Figure 5: Simulation results for 100 outputs from the GA for different GA fitness functions and communication models
used in the network. dist67 is better in this regard, using less slots results in messages traversing from the source to the sink faster than theslot43solution. The receive ratio is very consistent between the two solutions meaning either is a
good choice. Finally, capture ratio, while still very small values for both solutions,
shows a slight improvement ofdist67over slot43. With these metrics, we can say that the optimal solution for this configuration of all generated solutions is
dist67as solutions not creating the Pareto frontier where eliminated followed by a metric analysis of those that remained.
8.4. Comparison with NSGA-II
In addition to utilising the Pyevolve framework, early tests were performed
using an implementation of NSGA-II [33]. NSGA-II is a multi-objective genetic
0 0.05 0.1 0.15 0.2 0.25 0.3 0.35 dist67 slot43
Messages Sent per Node per Second
Genetic Header
(a) Messages Sent
0 20 40 60 80 100 dist67 slot43 Captur e R atio (%) Genetic Header (b) Captured 0 10 20 30 40 50 60 70 80 90 100 dist67 slot43 R eceive R atio (%) Genetic Header
(c) Receive Ratio
0 500 1000 1500 2000 2500 dist67 slot43 Nor
mal Message Latency (ms)
Genetic Header
[image:30.612.136.479.123.267.2](d) Latency
Figure 6: Simulation results for the two solutions that lie on the Pareto frontier
domination over one another. The group of solutions that dominate all others
but not each other is the Pareto frontier.
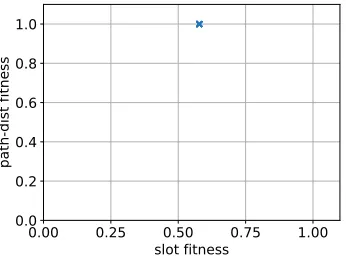
Unfortunately, as Figure 7 shows, the Pareto frontier is comprised of a large
number of copies of exactly the same solution. It is unclear as to exactly what
causes this lack of diversity in the population, however the selection method is
the likely culprit, as the other genetic operators function well with the other
GA. NSGA-II uses random tournament selection and compares rank followed
by crowding distance to determine the better solution. The use of a crowding
distance is supposed to aid in the selection of more diverse solutions but this
does not appear to be the case for this specific usage.
Due to this selection issue, it also causes early stagnation of the
popula-tion. Inevitably, this causes NSGA-II to underperform compared with the
implementation of the other GA.
8.5. Comparison with other SLP solutions
To the best of our knowledge, this is the first GA-based TDMA scheduling
for SLP in WSNs, making comparisons against other such schedules difficult.
However, for the sake of completeness, we compare the best solution from our
0.00
0.25
0.50
0.75
1.00
slot fitness
0.0
0.2
0.4
0.6
0.8
1.0
[image:31.612.221.394.123.251.2]path-dist fitness
Figure 7: The Pareto frontier output by a single run of NSGA-II
Table 2: The source and safety period combinations for DynamicSPR and ILPRouting in seconds
Source Period Safety Period
0.125 2.54
0.25 4.57
0.5 8.64
1.0 16.85
2.0 33.76
at the routing level, namely DynamicSPR [37] and ILPRouting [11]. Those
two protocols are instances of two classes of SLP protocols: (i) spatially-aware
protocol and (ii) temporal-aware protocol [? ] respectively. Due to the nature
of these different protocols, different metrics will be applicable for comparison.
Specifically, for spatially-aware protocols, the overhead metric that is most
important will bemessage overhead, whereaslatency is the most important for
temporally-aware protocols.
The same network size (11×11) and configuration (source in the top left
and sink in the centre) was used for both algorithms to compare with the results
gathered in this paper. Further, the same communication and noise models
where used for all experiments. The additional parameters for each algorithm
were provided to give the best performance for that algorithm. The parameters
[image:31.612.233.380.311.398.2]Since DynamicSPR and ILPRouting target the routing level and the
GA-based solution targets the MAC level, we address the attacker models used
during the comparison: The attacker model for the GA solutions has knowledge
of the length of the TDMA period and moves upon hearing the first message
during a given period, whereas the other routing protocols use sequence numbers
to ensure that attackers are moving in a way as to not follow stale data, again
following the first message heard. These different implementations result in very
similar behaviour from the attacker models.
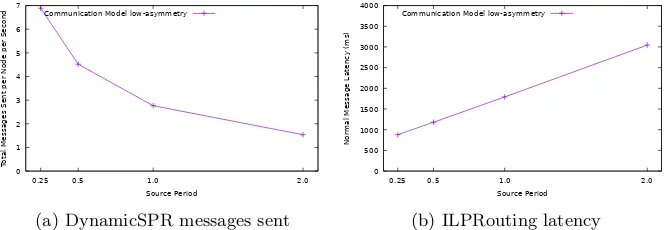
Capture ratio: The main metric that will be used for comparison is the capture
ratio. Figure 8 shows the capture ratios for the different source periods. The
plots show that DynamicSPR has a capture ratio consistently below 1% while
that of ILPRouting is slightly higher. Examining Figure 5 again, we can see that
under an ideal communication model, the GA solutions perform better than the
routing algorithms. This is so due to one main reason: message collisions do not
occur when using TDMA, which is not the case when using routing protocols.
However, an issue arises when a low-asymmetry communication model is used:
The problem that the GA faces is that it assumes vertical and horizontal links are
the only links between nodes. When using low-asymmetry, this is not the case as
diagonal links can form and links can be broken, which means the attacker can
leave, i.e., will not follow, the GA predicted path, potentially capturing the source.
This is one issue of a static slot assignment, which can cause more dynamic
algorithms to perform better under variable network conditions. Developing an
adaptive TDMA algorithm is part of our future work.
However, neither routing algorithm is better than the best produced by the
GA,dist67, which has a 0% capture ratio (shown in Figure 5b). Combined with the fact that this capture is indefinitely prevented, unlike for the others
0 1 2 3 4 5
0.25 0.5 1.0 2.0
Captur
e R
atio (%)
Source Period Communication Model low-asymmetry
(a) DynamicSPR 0 1 2 3 4 5
0.25 0.5 1.0 2.0
Captur
e R
atio (%)
Source Period Communication Model low-asymmetry
[image:33.612.138.479.124.243.2](b) ILPRouting
Figure 8: Capture ratios of different algorithms
0 1 2 3 4 5 6 7
0.25 0.5 1.0 2.0
Total Messages Sent per Node per Second
Source Period Communication Model low-asymmetry
(a) DynamicSPR messages sent
0 500 1000 1500 2000 2500 3000 3500 4000
0.25 0.5 1.0 2.0
Nor
mal Message Latency (ms)
Source Period Communication Model low-asymmetry
(b) ILPRouting latency
Figure 9: Various metrics from DynamicSPR and ILPRouting
than the routing protocols.
Num of messages sent: From Figure 9a, it can be observed that the number
of messages sent by the GA-based technique is much less than DynamicSPR.
Since DynamicSPR requires fake messages to be sent to be efficient, the number
of messages will increase. On the other hand, the only messages that are sent in
our GA-based schedule are application messaeges.
Latency: From Figure 9b, it can be observed that the latency induced by
the GA-based technique is less than that induced by ILPRouting. The only
delay induced for the GA-based technique is the slot assignment, which may be
sub-optimal. On the other hand, ILPRouting requires messages to be buffered
and aggregated together before being sent. This makes the delay in delivering a
[image:33.612.138.474.276.391.2]8.6. Overview of Results
Firstly, we showed some output from the GA that showed the differences
between the two fitness functions. This clearly displayed the effectiveness of the
optimisation process as the distance fitness function created a path that lead the
attacker into the opposite area of the network. We performed simulations on 100
solutions for each fitness function using ideal and more realistic (low-asymmetry)
communication models. This showed that for an ideal scenario, the solutions
performed with an almost 0% capture ratio for every solution. Using the more
realistic model, we can see the effect of additional links and link failures in the
network as both fitness functions have increased capture ratio. However, the
distance fitness function outperformed the other on average.
We then examined the two solutions that lie on the Pareto frontier in further
detail. This allowed us to select the best solution from the 200 solutions (named
dist67).
We compared the GA generation process to that of a high-performance true
multi-objective GA known as NSGA-II but found that it caused early stagnation
in the population of solutions, providing inferior results.
Finally, we compared our method with two state-of-the-art algorithms,
Dy-namicSPR [37] and ILPRouting [11]. We show comparable capture ratios under
the ideal communication model, with the low-asymmetry communication model
being higher. However, the best solution selected outperformed both algorithms
in terms of capture ratio.
9. Conclusion
In this paper, the objective was to produce a genetic algorithm solution to
generate SLP-aware TDMA schedules. We made a number of contributions: We
attacker (i.e., distributed eavesdropper), producing suitable crossover, mutation
and selection operators in the process. We use the concept of Pareto optimality
to compare resulting SLP-aware schedules. The optimization criteria were SLP,
schedule latency and attacker path. We thus provided two fitness functions,
one that reduces total slot usage and one that couples reduced slot usage with
directing the predicted attacker path away from the source. We then performed
simulations in TOSSIM under ideal and unreliable communication models to
show the viability of the optimal schedules, providing a very low capture ratio
and a high delivery ratio to the sink. The main advantage of our proposed
method is the near optimal capture ratio coupled with path creation that occurs
at no additional message overhead.
On the other hand, given that the slot assignment is static, it means that it
cannot adapt to the dynamism of the network such as asymmetric links or link
failures. This in turn causes attackers to move away from the main predicted
path the attacker should have followed, increasing the capture ratio. As such,
our current and future work is focused on developing fault-tolerant SLP-aware
TDMA schedules.
Acknowledgement
This work was supported by the UK Engineering and Physical Sciences Research
Council (EPSRC) [grant number EP/L016400/1].
[1] P. Kamat, Y. Zhang, W. Trappe, C. Ozturk, Enhancing source-location
privacy in sensor network routing, in: 25th IEEE International Conference
on Distributed Computing Systems (ICDCS’05), 2005, pp. 599–608. doi: 10.1109/ICDCS.2005.31.
[2] C. Ozturk, Y. Zhang, W. Trappe, Source-location privacy in
workshop on Security of ad hoc and sensor networks, SASN ’04, ACM,
New York, NY, USA, 2004, pp. 88–93. doi:10.1145/1029102.1029117.
[3] A. Mainwaring, D. Culler, J. Polastre, R. Szewczyk, J. Anderson, Wireless
sensor networks for habitat monitoring, in: Proceedings of the 1st ACM
International Workshop on Wireless Sensor Networks and Applications,
WSNA ’02, ACM, New York, NY, USA, 2002, pp. 88–97. doi:10.1145/ 570738.570751.
[4] A.-M. Badescu, L. Cotofana, A wireless sensor network to monitor and
protect tigers in the wild, Ecological Indicators 57 (2015) 447–451. doi: 10.1016/j.ecolind.2015.05.022.
[5] J. Kirton, M. Bradbury, A. Jhumka, Source location privacy-aware data
aggregation scheduling for wireless sensor networks, in: 2017 IEEE 37th
International Conference on Distributed Computing Systems (ICDCS), 2017,
pp. 2200–2205. doi:10.1109/ICDCS.2017.171.
[6] R. Srivathsan, S. Siddharth, R. Muthuregunathan, R. Gunasekaran, V. R.
Uthariaraj, Enhanced genetic algorithm for solving broadcast scheduling
problem in tdma based wireless networks, in: 2010 Second International
Conference on COMmunication Systems and NETworks (COMSNETS
2010), 2010, pp. 1–10. doi:10.1109/COMSNETS.2010.5431986.
[7] M. Conti, J. Willemsen, B. Crispo, Providing source location privacy in
wireless sensor networks: A survey, IEEE Communications Surveys and
Tu-torials 15 (3) (2013) 1238–1280. doi:10.1109/SURV.2013.011413.00118.
[8] Y. Xi, L. Schwiebert, W. Shi, Preserving source location privacy in
monitoring-based wireless sensor networks, in: 20th International
[9] W. Wei-Ping, C. Liang, W. Jian-xin, A source-location privacy protocol
in WSN based on locational angle, in: IEEE International Conference on
Communications (ICC), 2008, pp. 1630–1634. doi:10.1109/ICC.2008.315.
[10] C. Gu, M. Bradbury, A. Jhumka, Phantom walkabouts in wireless sensor
networks, in: Proceedings of the Symposium on Applied Computing, SAC’17,
ACM, New York, NY, USA, 2017, pp. 609–616. doi:10.1145/3019612. 3019732.
[11] M. Bradbury, A. Jhumka, A near-optimal source location privacy scheme for
wireless sensor networks, in: 16th IEEE International Conference on Trust,
Security and Privacy in Computing and Communications (TrustCom), 2017,
pp. 409–416. doi:10.1109/Trustcom/BigDataSE/ICESS.2017.265.
[12] C. Gu, M. Bradbury, A. Jhumka, M. Leeke, Assessing the performance of
phantom routing on source location privacy in wireless sensor networks,
in: 2015 IEEE 21st Pacific Rim International Symposium on Dependable
Computing (PRDC), 2015, pp. 99–108. doi:10.1109/PRDC.2015.9.
[13] R. Shi, M. Goswami, J. Gao, X. Gu, Is random walk truly memoryless
— traffic analysis and source location privacy under random walks, in:
INFOCOM, 2013 Proceedings IEEE, 2013, pp. 3021–3029. doi:10.1109/ INFCOM.2013.6567114.
[14] A. Jhumka, M. Leeke, S. Shrestha, On the use of fake sources for source
location privacy: Trade-offs between energy and privacy, The Computer
Journal 54 (6) (2011) 860–874. doi:10.1093/comjnl/bxr010.
[15] A. Jhumka, M. Bradbury, M. Leeke, Fake source-based source location
privacy in wireless sensor networks, Concurrency and Computation: Practice
[16] M. Bradbury, M. Leeke, A. Jhumka, A dynamic fake source algorithm
for source location privacy in wireless sensor networks, in: 14th IEEE
International Conference on Trust, Security and Privacy in Computing and
Communications (TrustCom), 2015, pp. 531–538. doi:10.1109/Trustcom. 2015.416.
[17] J. Long, M. Dong, K. Ota, A. Liu, Achieving source location privacy and
network lifetime maximization through tree-based diversionary routing in
wireless sensor networks, IEEE Access 2 (2014) 633–651. doi:10.1109/ ACCESS.2014.2332817.
[18] M. Dong, K. Ota, A. Liu, Preserving source-location privacy through
redundant fog loop for wireless sensor networks, in: 13th IEEE International
Conference on Dependable, Autonomic and Secure Computing (DASC),
Liverpool, UK, 2015, pp. 1835–1842. doi:10.1109/CIT/IUCC/DASC/PICOM. 2015.274.
[19] W. Tan, K. Xu, D. Wang, An anti-tracking source-location privacy
protec-tion protocol in WSNs based on path extension, Internet of Things Journal,
IEEE 1 (5) (2014) 461–471. doi:10.1109/JIOT.2014.2346813.
[20] Z. Benenson, P. M. Cholewinski, F. C. Freiling, Wireless Sensors Networks
Security, IOS Press, 2008, Ch. Vulnerabilities and Attacks in Wireless Sensor
Networks, pp. 22–43.
[21] X. Niu, Y. Yao, C. Wei, Y. Liu, J. Liu, X. Chen, A novel source-location
anonymity protocol in surveillance systems, in: 2015 International
Con-ference on Identification, Information, and Knowledge in the Internet of
Things (IIKI), 2015, pp. 100–104. doi:10.1109/IIKI.2015.30.
against a global eavesdropper, IEEE Trans. on Mobile Computing 11 (2)
(2012) 320–336. doi:10.1109/TMC.2011.32.
[23] Y. Yang, M. Shao, S. Zhu, G. Cao, Towards statistically strong source
anonymity for sensor networks, ACM Trans. Sen. Netw. 9 (3) (2013) 34:1–
34:23. doi:10.1145/2480730.2480737.
[24] M. Shao, W. Hu, S. Zhu, G. Cao, S. Krishnamurth, T. La Porta,
Cross-layer enhanced source location privacy in sensor networks, in: 6th Annual
IEEE Communications Society Conference on Sensor, Mesh and Ad Hoc
Communications and Networks (SECON ’09), 2009, pp. 1–9. doi:10.1109/ SAHCN.2009.5168923.
[25] H. Miao, X. Xiao, B. Qi, K. Wang, Improvement and application of leach
protocol based on genetic algorithm for wsn, in: Computer Aided Modelling
and Design of Communication Links and Networks (CAMAD), 2015 IEEE
20th International Workshop on, 2015, pp. 242–245. doi:10.1109/CAMAD. 2015.7390517.
[26] H. Darji, H. B. Shah, Genetic algorithm for energy harvesting-wireless
sensor networks, in: 2016 IEEE International Conference on Recent Trends
in Electronics, Information Communication Technology (RTEICT), 2016,
pp. 1398–1402. doi:10.1109/RTEICT.2016.7808061.
[27] O. Zorlu, O. K. Sahingoz, Increasing the coverage of homogeneous
wire-less sensor network by genetic algorithm based deployment, in: 2016
Sixth International Conference on Digital Information and
Communi-cation Technology and its AppliCommuni-cations (DICTAP), 2016, pp. 109–114.
doi:10.1109/DICTAP.2016.7544010.
[28] P. Nagarathna, R. Manjula, Genetic algorithm with a new fitness function
Theoretical Computing and Communication Technology (iCATccT), 2015,
pp. 95–100. doi:10.1109/ICATCCT.2015.7456862.
[29] S. M. Duan, J. L. Mao, F. H. Xiang, H. P. Liu, Quantum genetic algorithm
optimization in tdma time slot allocation for wsn, in: Control Conference
(CCC), 2013 32nd Chinese, 2013, pp. 7377–7382.
[30] G. Chakraborty, Y. Hirano, Genetic algorithm for broadcast scheduling
in packet radio networks, in: 1998 IEEE International Conference on
Evolutionary Computation Proceedings. IEEE World Congress on
Com-putational Intelligence (Cat. No.98TH8360), 1998, pp. 183–188. doi: 10.1109/ICEC.1998.699498.
[31] B. H. Arabi, Solving np-complete problems using genetic algorithms, in:
2016 UKSim-AMSS 18th International Conference on Computer Modelling
and Simulation (UKSim), 2016, pp. 43–48. doi:10.1109/UKSim.2016.65.
[32] G. Chiandussi, M. Codegone, S. Ferrero, F. Varesio, Comparison of
multi-objective optimization methodologies for engineering applications,
Computers & Mathematics with Applications 63 (5) (2012) 912 – 942.
doi:https://doi.org/10.1016/j.camwa.2011.11.057.
URL http://www.sciencedirect.com/science/article/pii/
S0898122111010406
[33] K. Deb, A. Pratap, S. Agarwal, T. Meyarivan, A fast and elitist
multi-objective genetic algorithm: Nsga-ii, IEEE Transactions on Evolutionary
Computation 6 (2) (2002) 182–197. doi:10.1109/4235.996017.
[34] K. D. Lee, T. S. P. Yum, On pareto-efficiency between profit and utility in
ofdm resource allocation, IEEE Transactions on Communications 58 (11)
[35] C. S. Perone, Pyevolve: A python open-source framework for genetic
algo-rithms, SIGEVOlution 4 (1) (2009) 12–20.doi:10.1145/1656395.1656397.
[36] A. A. Hagberg, D. A. Schult, P. J. Swart, Exploring network structure,
dynamics, and function using NetworkX, in: Proceedings of the 7th Python
in Science Conference (SciPy2008), Pasadena, CA USA, 2008, pp. 11–15.
[37] M. Bradbury, A. Jhumka, M. Leeke, Hybrid online protocols
for source location privacy in wireless sensor networks,
Jour-nal of Parallel and Distributed Computing 115 (2018) 67 – 81.
doi:https://doi.org/10.1016/j.jpdc.2018.01.006.
URL http://www.sciencedirect.com/science/article/pii/
S0743731518300236
Jack Kirton is a PhD student at the University of Warwick,
UK as part of the Warwick Institute for the Science of Cities.
He received a BSc in Computer Science followed by an MSc in
Data Analytics from Warwick. His current research involves
security and fault-tolerance in Wireless Sensor Networks.
Matthew Bradbury is a PhD student at the University
of Warwick, UK. He received his MEng degree in Computer
Science from Warwick, UK. His current research focus is on
security and dependability in Wireless Sensor Networks. He has