On the Evolution of Primary Gamma Prime
Precipitates During High Temperature and High
Strain Rate Deformation and Subsequent Heat
Treatment in the Ni-Based Superalloy, RR1000
N. D’SOUZA, W. LI, C. ARGYRAKIS, G.D. WEST, and C.D. SLATER
The microstructural evolution following compression and subsequent sub-solvus and super-solvus heat treatment was studied in the Ni-based superalloy, RR1000, typically used for rotor disc applications in aero-engines. For a low strain rate of 0.1 s1at close to solvus temperature, 1413 K (1140C), the flow stress is constant. For larger strain rates of 1 and 10 s1 at sub-solvus temperature, 1373 K (1100C) dynamic re-crystallization (DRX) ofcgrains occurs during forging with accompanying stress decay. Incoherent primaryc¢precipitates form mainly viameta-dynamic re-crystallization (MDRX) at 1 s1and are as intergranular. For 10 s1, the coherently nucleated or existing precipitates present in the initial as-HIP condition become incoherent when the grain boundary sweeps past them during DRX and subsequent grain growth. The incoherent primaryc¢precipitates are mainly intragranular. During sub-solvus heat treatment at 1373 K (1100C), dissolution of the incoherent precipitates occurs through coarsening of the coherent intragranular population with only sporadic incoherent precipitates remaining. The prior induced deformation (strain and strain rate) influences the evolution of precipitate morphologies during cooling following heating to super-solvus temperature. Using numerical simulations, a quantitative calculation of the different precipitate morphologies was carried out during slow cooling from super-solvus temperature, 1443 K to 1373 K (1170C to 1100C).
https://doi.org/10.1007/s11661-019-05330-w
The Author(s) 2019
I. INTRODUCTION
NI-BASED
superalloys strengthened by the presence of a dispersion of coherent c¢ (L12) precipitates in anFCC-disordered solid solution matrix of c (A2) phase find wide applications in aero-engine and land-based power generation designed for high-temperature appli-cations. Specifically, for turbine disc applications, the powder metallurgy (PM) route is followed. Superalloy powders synthesized by gas atomization, hot isostatic pressing (HIP) followed by blind die compaction (upset), and hot extrusion are used to produce the billet. The billet is subsequently isothermally forged and then heat treated. The evolution of the microstructure, i.e., specifically the c¢ precipitate morphology during these thermomechanical processes controls the grain
size.[1–4] The grain size has a significant effect on the evolution of the flow stresses during forging.[2,5–10] The evolution of thec¢precipitate morphology is influenced by the stress, plastic strain, and most importantly the strain rate.[4,11,12]The 1st population termed as primary c¢ has the principal role of inhibiting grain growth during billet manufacture and forging by pinning the grain boundaries and are typically, 1 to 5lm in size.[13] Thermomechanical operations carried out at tempera-tures where only these pinning particles are present in the microstructure (absence of secondary/tertiary pop-ulations, as they have lower solvus temperature com-pared to forging temperature) can be therefore carried out at decreased flow stresses. The evolution of flow stress under a range of thermomechanical treatments has been studied in Ni-based alloys encompassing total strain, strain rate and stress, and constitutive equations have been fitted to describe the behavior. Depending on the temperature/strain rates, either dynamic re-crystal-lization (DRX) occurs at high strain rates approaching ~1 s1, while at intermediate/lower strain rates,~103 to 102s1 super-plastic flow preceded by limited DRX occurs in the temperature range, 1273 K to 1423 K.[5–9,14]
N. D’SOUZA, W. LI, and C. ARGYRAKIS are with the Rolls-Royce plc, PO Box 31, Derby, DE24 8BJ, UK. G.D. WEST and C.D. SLATER are with the Warwick Manufacturing Group, University of Warwick, Coventry CV4 7AL, UK. Contact e-mail: [email protected]
The motivation for this study stems from the fact that most prior studies have primarily focused on conditions of isothermal forging characterized by low strain rates, typically £ 0.1 s1. There are fewer investigations at high strain rates, typically ‡1 s1, which is akin to conditions associated with billet manufacture. At these high strain rates if DRX does not completely relax all the stress owing to the negligible deformation time (Dt~ 5 seconds and depending on the final plastic strain), reduction in the remnant dislocation density leads to meta-dynamic (post-dynamic) re-crystallization during cooling.[4,15] Furthermore, under such extreme deformation conditions, both the morphology and spatial occurrence ofc¢precipitates,i.e., inter/intragran-ular is determined by the strain rate.[12]The significance of studying the precipitate evolution under conditions of billet manufacture is key, since anomalous grain growth and existence of un-re-crystallized powder particles existing within the billet will affect both the flow stress and two-phase microstructure that evolves during forg-ing, which can adversely affect the mechanical properties of the component.[1]Therefore,
1) The first objective in this study will be to explore the range of processing conditions and their effect on the morphology and crystallographic evolution of primary c¢precipitates.
2) Second, the role of heat treatment is also studied, specifically in relation to the subsequent extrusion stage in the processing sequence prior to isother-mal forging.
3) It must be pointed out that the amount of primary
c¢precipitates will in turn determine the extent of the intragranular secondary and tertiary precipi-tate populations. The secondary and tertiary sizes range typically between 100 to 400 and 5 to 50 nm, respectively[16–19] and are stabilized during subse-quent post forging heat treatments. Optimization of their distribution confers the superior mechan-ical properties. Therefore, athirdaim of this paper will quantitatively address the influence of the primary c¢precipitate distribution on these popu-lations using numerical simupopu-lations.
The nominal composition of the Ni-based superalloy, RR1000 is given in Table I.
II. EXPERIMENTAL METHOD
The starting material condition corresponds to a sub-solvus as-HIPped billet from which Gleeble test specimens were machined. For compression testing, a Gleeble HDS-V40 was used in uniaxial mode. Samples, 10 mm diameter and 15 mm long, were machined from the as-HIP compact. Samples were loaded into the Gleeble machine with a layer of graphite and Ta on either end and Ni paste was used as a conductive adhesive. Two 0.3 mm holes were drilled into the centerline of the sample to a depth of 1 mm and a K-type thermocouple was ‘‘peened’’ to the sample thereby ensuring a good and consistent contact even under highly strained conditions where shape change during deformation would occur. Prior to commencing each test, the chamber was evacuated and back-filled with Ar three times before a final vacuum level of 19103mbar was achieved. During heating, an initial preheat temperature of 373 K (100C) was set to burn-off the conductive adhesive carrier and to volatilize any existing moisture. TableIIpresents the thermome-chanical profiles for the compression tests.
[image:2.594.15.535.557.593.2] [image:2.594.40.530.629.694.2]Electron microscopy was carried out on metallurgical specimens that were ground and polished to 0.02lm surface finish in the as-polished condition. The sample matrix was analyzed using a Versa 3D FIB/FEG-SEM (FEI) equipped with an AztecSynergy (Oxford Instru-ments) analytical system comprising of an XMaxN80 SDD Energy-Dispersive Spectrometer (EDS) and a Nordlys Max3 Electron Back-Scatter Diffraction (EBSD) camera. Images were taken at 5 kV with a conventional Everhart Thornley Secondary Electron (SE) detector. EBSD was performed at 20 kV using a nominal current of 12 nA at 70 deg tilt. EBSD maps were either exported directly from the Aztec software or in the case of Local Average Misorientation (LAM) from ICE (Oxford Instruments) analysis software. Energy-dispersive spectroscopy (EDS) maps were col-lected separately at 20 kV and also at 10 kV at zero tilt also with a nominal current of 12 nA with a real acquisition time of approximately 15 minutes and an input count rate in the range (100 to 150) kilo counts per second (kcps). This intermediate voltage was a good compromise between maintaining a sufficient spectral
Table I. Nominal Composition (Weight Percent) of the Ni-Based Superalloy, RR1000[20]
Co Cr Mo Ta Ti Al B C Zr Hf Ni
18.5 15 5 2 3.6 3 0.015 0.027 0.06 0.75 balance
Table II. Summary of Thermal and Mechanical Profiles for the Uniaxial Compression Tests
Test
Number Heating
Nominal Strain
Strain Rate
(s1) Cooling
1 Heat to 1413 K (1140C) at 10 K s1and hold for 5 min 1 0.1 Cooling at 5 K s1up to 473 K (200C) 2 Heat to 1373 K (1100C) at 10 K s1and hold for 5 min 1
range (high kV) and maximizing spatial resolution (low kV). The composition of features of interest was quantified by extracting spectra from features of interest in the EDS maps. From combined EBSD/EDS done at 20 kV, the EDS map (Cr) was overlaid on the band contrast map EBSD map. While this was satisfactory for 1 s1, owing to the large interaction volume, the resolution of small c¢ precipitates was reduced for the larger strain rate, 10 s1. To address this, the EDS data were re-collected from the same area at 10 kV at zero tilt. Small distortions in the EBSD acquisition data collected at 70 deg result in corresponding features not overlaying perfectly on the Cr EDS map acquired at zero tilt. Therefore, in case of the higher strain rate (10 s1), the Cr EDS map was overlaid on the electron image, which was taken at zero tilt. Additionally, electron microscopy was also carried out on samples which were mechanically polished to 0.25lm finish and electro-etched in 10 pct phosphoric acid in methanol for 3 seconds using a 3-V voltage. A Philips XL30 FEG-SEM in the backscattered electron (BSE) mode was used to evaluate the c¢ precipitates. Quantitative phase fraction analysis was performed using the ImageJ analysis software.
III. RESULTS
A. Evolution of True Stress and True Strain During Hot Deformation (As-Forged)
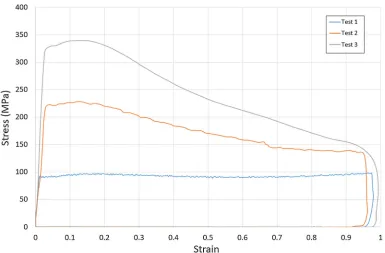
The true stress–strain curves obtained during hot deformation at 1373 K (1100 C) are presented in Figure1 for the strain rates of 1 and 10 s1 and correspond to sub-solvus conditions. Also included is
the flow curve corresponding to deformation close to solvus [1418 K (1145C)] at 1413 K (1140C) for a strain rate of 0.1 s1. In all cases, the samples were deformed to a final nominal strain of e= 1. The following observations can be made:
(i) The flow curves are characterized by the initial rapid increase in stress from work hardening up to a true strain of~0.04, when a peak in the true stress is reached.
(ii) For the low strain rate, 0.1 s1 and close to solvus temperatures, the stress remains constant over the entire range of strain. For increasing strain rates and sub-solvus temperature, the initial work hardening is followed by softening mechanisms beyond a threshold strain (~0.1 for _
e¼1 s1and~0.15 fore_¼10 s1) and resulting
in a rapid decrease in the flow stress,
Dr~75 MPa and Dr~ 200 MPa for the two cases, respectively.
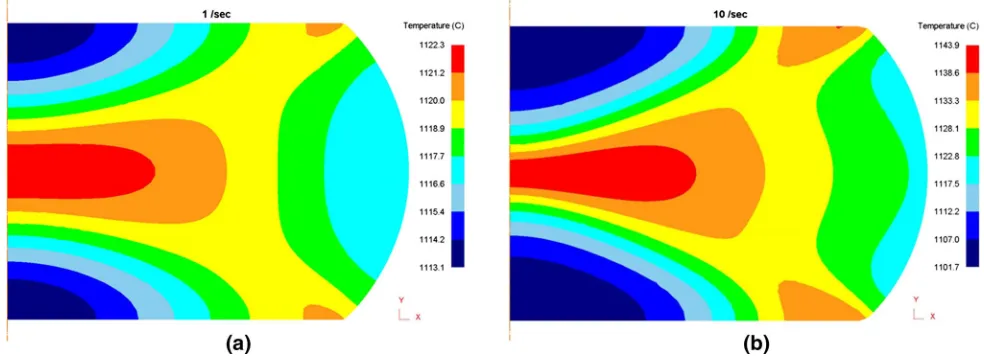
[image:3.594.125.510.427.680.2]During high-speed deformation most of the external mechanical work that is applied to the workpiece is transformed to heat. Although this adiabatic heating is not adequate to uniformly increase the temperature of the specimen and allow any significant heat exchange with the environment, the localized temperature gradi-ent can contribute to microstructural changes. The ‘‘degree of effectiveness’’ of the process, which defines the fraction of the work that will be stored as thermal energy is often taken to be independent of temperature and has values ranging between 0.9 and 0.95.[21,22] The latter value has been considered in this work and used as an input in the commercial finite element code DEFORM where the compression tests have been
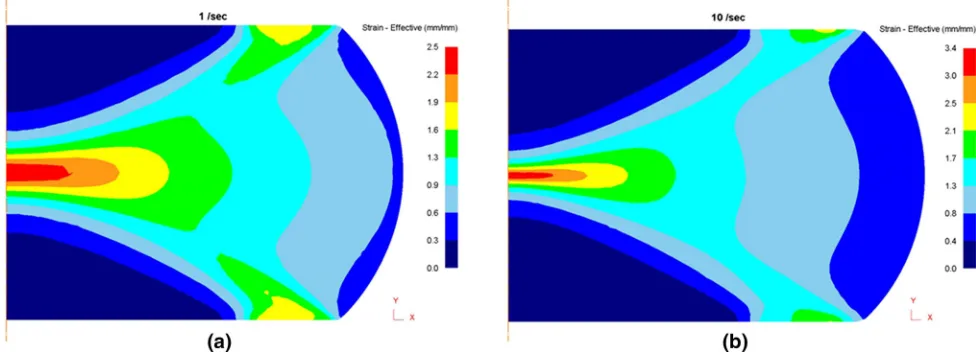
modeled.[23] The model shows that at the nominal deformation temperature of 1373 K (1100 C), a max-imum increase in temperature of approximately 22 K and 44 K is obtained for _e¼1 and 10 s1, respectively, as shown in Figures2(a) and (b). The calculation of the strain contours is dependent on the friction coefficient between the compression plates and the work piece. The barreling effect along the specimen length was measured by sectioning the Gleeble specimen. Following an iterative process for the value of the apparent shear friction coefficient (l) in the Finite Element (FE) model, with a final value set at 1.4, the measured deformed specimen dimensions corresponded closely to the calcu-lated values in the simulation. This thereby provided an accurate strain contour as presented in Figures 3(a) and (b) corresponding toe_¼1 and 10 s1, respectively. The following observations can be made from Figures2and 3:
(iii) There is a direct correlation between the strain and temperature maps.
(iv) The strains at any spatial location are greater for 10 s1. The peak strain (e~1.69 to 3.29) is in a smaller width at the center (~ 0.5 mm) compared with the lower strain rate (e~1.26 to 2.52), where the width is noticeably greater at the center (~1.2 mm).
B. Nucleation and Growth of Primary Gamma Prime Precipitates During Hot Deformation
One of the principal mechanisms of flow softening at high strain rates is through dynamic re-crystallization (DRX), which subsequently controls the evolution of the microstructure. The initial condition of the samples corresponds to as-HIP. Accordingly, Figures4(a) through (d) are low-magnification secondary electron images corresponding to as-HIP and as-forged for _
e¼0:1, 1 and 10 s1, respectively, from the center of the sample, which is in the as-polished condition.
Higher-magnification images corresponding to (a) as-HIP are presented in (e), (f), while that for (c) e_¼ 1 s1 are presented in (g), (h), and those for (d) e_¼ 10 s1 are presented in (i), (j) respectively. The key observations are:
cGrain SizeThe grain size is coarsest in the case of _e¼0:1 s1compared with all four conditions, while _
e¼1 s1 has smallest grain size. It is not
straight-forward to measure a grain size from these electron images; this will be done using EBSD-derived grain orientation maps. There is distinct evidence of some non-recrystallized grains in the as-HIP sample and these appear sporadically within the microstructure in Figure 4(a).
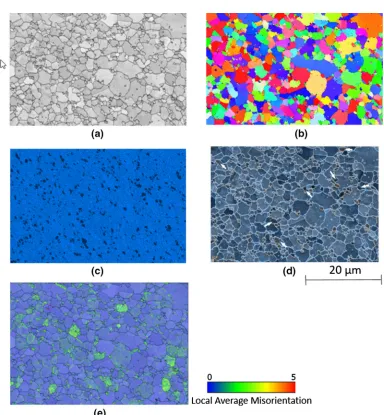
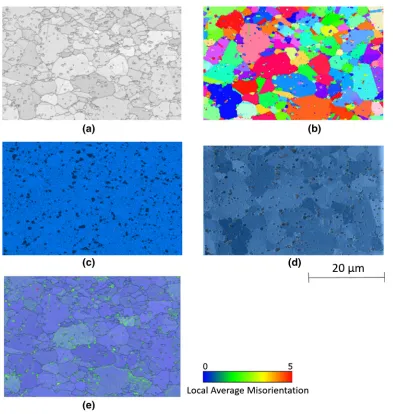
c¢PrecipitatesPrimaryc¢is conventionally defined as precipitates occurring at grain boundaries, where these precipitates are irregular in shape and typically up to 1.5 lm in size.[1,11,13] There is a marked difference in precipitate evolution observed for the higher strain rates. Fore_¼1and 10 s1, precipitates akin to primary are mainly intergranular for the lower strain rate and both inter/intragranular at the higher strain rate. Moreover, they are distinctly more globular, unlike in the as-HIP condition. Therefore, the nomenclature of ‘‘primary’’ will be modified to also include the intragranular precipi-tates in Figures4(h) and (j). In the as-HIP condition, a tri-modal distribution of precipitates is observed, with the secondary and tertiary precipitates being coarser and therefore visible, unlike in the forged condition. [image:4.594.32.524.42.223.2]deformation direction is along the vertical (Y-axis) in Figure5(b). Moreover, since Ti preferentially partitions toc¢, while Cr strongly segregates tocphase, either Ti or Cr EDS maps can be used to identifyc¢precipitates. In this case, the Cr EDS map is used, as in Figure5(c). In Figure5(d), the EDS map is overlaid on to the EBSD map, so that the spatial location of the precipitates within the microstructure can be visualized. The band contrast overlaid on the local average misorientation (LAM) map is presented in Figure 5(e). Similarly, Figures6(a) through (c) refer to the band contrast, inverse pole figures (IPF), and Cr EDS maps respec-tively for = 10 s1. Accordingly, in Figure6(d), the EDS map is overlaid on to the corresponding electron image, where the grain boundaries can be observed. Figure6(e) shows the corresponding band contrast overlaid on the local average misorientation (LAM) map. The following key observations can be made:
Incoherent/coherent c¢ Precipitates c¢ precipitates predominantly occur with high-angle boundaries with the neighboring c grain(s) and the interface with c phase is therefore incoherent. In case of _e¼1 s1, the precipitates are predominantly inco-herent and intergranular. However, some coinco-herent precipitates are also observed, as highlighted in Figure5(d). While these are intergranular, they possess the same orientation as the c grain into which they grow and not all of thecgrain has been consumed. In case of e_¼10 s1, both
inter/intra-granularc¢precipitates are observed, but unlike the lower strain rate all primary c¢ is incoherent. For _
e¼1 s1, some of the c grains show a LAM of typically 3 deg, but in case ofe_¼10 s1, a virtually
strain-free matrix is observed. However, in case of _
e¼10 s1, regions with the highest LAM values
occur within many intragranular incoherentc¢ pre-cipitates, while sporadic incoherent intergranular c¢
precipitates are associated with LAM values of typically 3 deg. No variation in the concentration of the key segregating alloying elements: Co, Cr,
Mo, Ti, and Ta was observed and is summarized in TableIII. The measurements are however con-strained by limits of spatial resolution.
Consequently, calculation of thecgrain size becomes less than straightforward, as it also includes the contri-bution of the incoherent c¢ precipitates. A possible method of delineation between c grains and c¢ precip-itates involves the elimination of grains whose number of pixels just exceeded the area of the largest c¢ precipitate in the map. However, this method will also result in the exclusion of c grains sectioned far from their centroids and has limitations.[12]Therefore, in case ofe_¼1 s1;the intergranular incoherentc¢precipitates are not delineated fromcgrains and for a collection of 479 grains, the average grain size is 1.46lm, with a maximum of 5.4lm and minimum of 0.5lm and which includes averages of c and c¢ precipitates. In case of _
e¼10 s1; this becomes less reliable given the smaller distribution of grains, i.e., 145 grains and the marked increase in intragranular incoherent c¢ precipitates. Consequently, measurement of grain size is not attempted, but it suffices to note that from comparison of Figures5(a), (b) and6(a), (b), there is a near twofold increase in grain size fore_¼10 s1when comparing the larger grains.
TableIVsummarizes the observations ofcgrains and primary incoherentc¢precipitates in as-HIP and forged conditions,i.e.,e_¼1 and 10 s1.
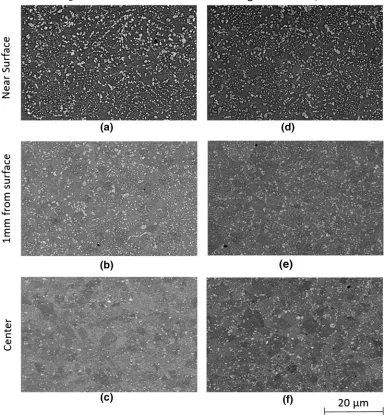
[image:5.594.71.559.44.223.2]Since there is a variation in plastic strain as well as adiabatic heating effects from the surface to the center, c.f. Figures2 and 3, a comparison of the intra/inter-granularc¢precipitate distribution across the specimen cross section was made. Figures7(a) through (c) are backscattered electron (BSE) images showing the pre-cipitate distributions on sections with increasing dis-tance from the surface, with (c) being at the center corresponding to e_¼1 s1, while Figures7(d) through (f) refer toe_¼10 s1, with (f) being at the center. These sections have been etched to preferentially attack c
Fig. 3—Calculated true stress–true strain contour plots using the commercial finite element code DEFORM across the cross section for deformation at 1373 K (1100C); (a)e_¼1 s1and (b) 10 s1
phase and thereforec¢precipitates appear bright in the BSE images. The following observations can be made:
c¢Precipitate DistributionThere is a marked decreasein the number of un-recrystallized powder particles (originating in the as-HIP condition) with increasing
distance from the surface and completely absent at the center. Aligned c¢ precipitates are clearly observed within these un-recrystallized particles. There is also a marked decrease in precipitate size at the center compared with the surface, specifically fore_¼1 s1.
It also is pertinent to compare the evolution ofcgrain size as well as the primaryc¢size and distribution with that in [12] for comparable hot-working conditions. While the primary c¢ size (~ 0.5lm) and distribution (predominantly intragranular at high strain rates) are comparable in [12] and in our study, there is a marked difference in the c grain size. The lower values in our study can be explained by the lower hot-working bFig. 4—Secondary electron images of as-HIP and as-forged (Gleeble
tested) samples in as-polished condition; (a) to (d) are low-magnification images corresponding to as-HIP, e_¼0:1, 1, and 10 s1, respectively, from the center of the sample. (e), (f) are higher-magnification images corresponding to (a); as-HIP, while (g), (h) are higher-magnification images corresponding to (c); e_¼1 s1
and (i), (j) are higher-magnification images corresponding to (d);_e¼
[image:7.594.125.509.228.643.2]10 s1;respectively.
temperature, i.e., 45 K below the solvus, unlike that in,[12]where it is 22 K below solvus.
C. Coherent Gamma Prime Precipitate Morphology After Hot Deformation—Sub-Solvus Isothermal and Super-Solvus Slow Cooling
1. Sub-solvus temperature, 1373 K (1100 C)
The evolution of c¢ precipitates after isothermal solutioning at sub-solvus, 1373 K (1100C) for
[image:8.594.85.478.30.444.2]90 minutes followed by water quench was investigated at strain rates of 1 and 10 s1. Accordingly, Figures8(a), (b) and 9(a), (b) are low- and high-mag-nification BSE images for the near-surface and center locations, respectively, fore_¼1 s1, while Figures8(c), (d) and 9(c), (d) correspond to low- and high-magnifi-cation BSE images for the near-surface and center locations, respectively, for _e¼10 s1. The effect of annealing on the precipitate orientation at the center is presented in Figures10 and11 corresponding to _e¼1 Table III. Concentration of Key Segregating Elements Within Primaryc¢Composition (Weight Percent) Corresponding to
As-Forged Conditions
Al Ti Cr Co Mo Ta
4.0±0.15 6.8±0.26 3.3±0.30 11.8±0.77 1.1±0.18 4.7±0.11
Included is the standard deviation.
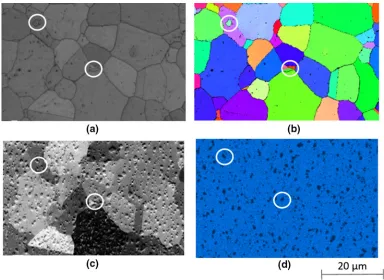
[image:8.594.29.533.525.570.2]and 10 s1, respectively, where (a) through (d) refer to the band contrast, IPF, electron image, and Cr EDS map, respectively. The following observations can be made:
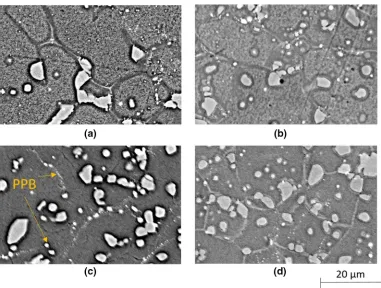
(i) c¢Precipitate MorphologyUn-recrystallized pow-der particles are observed at the surface, wherec¢
precipitates are clearly observed within these particles, Figures8(a) and (c). Coarsening of the precipitates is also observed for both strain rates, c.f., the deformed microstructure in Figures 4(g) through (j). An outline of the grain boundaries, as well as prior particle boundaries (PPB’s) can be observed, Figure9(c). There is a prominent intragranular precipitate population for _
e¼10 s1, Figure11(c). There is also an
increased precipitate fraction at the center for the higher strain rate, Figures8(b) and (d). It must be emphasized that this measured precip-itate fraction will preclude any distribution that cannot be resolved at this magnification,i.e., fine size precipitates but will include the coherent population in addition to the initial incoherent primaryc¢. Therefore, care must be exercised in any interpretation from image analysis as reported below.
e_¼1 s1: surface = [11.4±0.07] pct, center:[12.2±0.57] pct.
e_¼10 s1: surface = [11.2 ± 0.35] pct,center: [16.1±0.60] pct.
(ii) c¢ Precipitate Orientation There is marked decrease in the number of incoherent inter/ intragranularc¢precipitates fore_¼10 s1
com-pared with the as-forged condition. In the case of _
e¼1 s1;there is also a significant reduction of
intergranular incoherent precipitates, c.f. Figures10and11.
It can be observed unequivocally that following sub-solvus heat treatment most of the initial incoherent primary c¢ precipitates have transformed to a coherent population with sporadic distribution of remnant inco-herent precipitates.
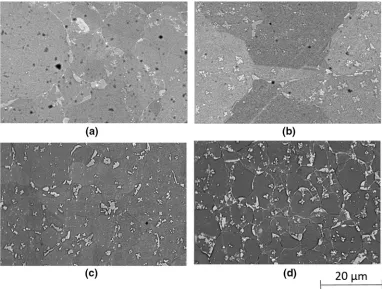
2. Super-solvus temperature, 1443 K (1170C) The evolution ofc¢precipitates after heating as-forged samples (e_¼1 and 10 s1) to the super-solvus temper-ature, 1443 K (1170C) followed by slow cooling at~ 0.017 K s1 (1 K min1) up to 1373 K (1100C) and subsequent quenching was investigated. Figures12(a) through (d) are backscattered electron images from etched sections corresponding to as-HIP,e_¼0:1, 1 and 10 s1, respectively. There are two distinct precipitate morphologies observed, blocky intergranular and den-dritic intragranular. There is an increasing precipitate fraction encompassing both morphologies from as-HIP to increasing strain rates, where at lower strain rates dendritic c¢ prevails, but there is an increasing contri-bution from the intergranular morphology with increas-ing strain rate. The measured precipitate fraction from image analysis is as follows:
As-Hip: center¼4:5 pct: _
e¼0:1 s1: surface¼5:7 pct; center:5:7 pct _
e¼1 s1:surface¼ ½7:60:85pct; center:
½7:80:07pct _
e¼10 s1:surface¼ ½9:50:95pct; center:
½11:90:70pct:
IV. DISCUSSION
The evolution of the microstructure in the as-forged, sub-solvus isothermal heat treatment, and continuous cooling from super-solvus temperature will be discussed.
A. As-Forged Condition
1. Driving and retarding forces for DRX
[image:10.594.86.471.47.462.2]The flow stress is determined by the competition between work hardening that increases the dislocation density on the one hand and strain softening from recovery through dislocation annihilation and dynamic re-crystallization (DRX), where in the latter there is the nucleation and growth of strain-freecgrains.[15]In case of _e¼0:1s1, the grain size is coarser than the starting as-HIP condition, Figures4(a) and (b). The absence of stress decay following reaching the peak stress, as in Figure1, clearly indicates the absence of DRX. There-fore, the increase in grain size occurs from grain growth at close to solvus temperature, where any Zener pinning from the precipitates is minimum. However, for _e¼1 and 10 s1, not only does the peak flow stress increase with increasing strain rate, but there is also concomitant Fig. 7—Backscattered electron images from etched sections (etched with phosphoric acid) corresponding to different strain rates in Gleeble testing at 1373 K (1100C) and with increasing distance from the surface; (a) to (c), with (c) being center fore_¼1 s1 and (d) to (f), with (f)
greater stress decay observed at the higher strain rate. This is a direct manifestation of the occurrence of DRX. As a comparison, the extent of flow softening fore_¼1
[image:11.594.126.510.34.277.2]and 10 s1 is markedly greater than that reported in References 5–7 but comparable to that reported in Reference 2 and encompassing comparable range of Fig. 8—Low-magnification backscattered electron images from etched sections (etched with phosphoric acid) after isothermal solutioning at 1373 K (1100C) for 90 min and water quench (WQ) corresponding to different strain rates in Gleeble testing and with increasing distance from the surface; (a) surface, (b) center fore_¼1 s1and (c) surface, (d) center for_e¼10 s1.
[image:11.594.126.507.332.620.2]Fig. 10—Evolution ofc¢after isothermal solutioning at 1373 K (1100C) for 90 min followed by water quench fore_¼1 s1; (a) band contrast,
(b) inverse pole figure (IPF), (c) forward scattered electron image, and (d) Cr EDS map.
Fig. 11—Evolution ofc¢after isothermal solutioning at 1373 K (1100C) for 90 min followed by water quench for_e¼10 s1; (a) band contrast,
[image:12.594.86.470.371.651.2]conditions, T = 1223 K to 1423 K, strain rates = 0.1 to 10 s1, and true strains up to 0.9. Furthermore, flow softening at typically,_e>1 s1is consistent with the flow stress behavior reported in low-stacking fault energy Ni-based alloys.[8,9]cgrains that nucleate during DRX have different growth kinetics in case ofe_¼1 and 10 s1 resulting in the variation in grain size, Figures 5(a), (b) and6(a), (b). The principal driving force in case of DRX arises from the remnant dislocation density into which the nucleated strain-free grain grows, while the retarding force is provided by the pinning of the grain boundary by the precipitates. The relative magnitude of these two forces will dictate the kinetics of grain growth.
Under condition of high strain rate/low temperature, i.e., akin to DRX, the variation of flow stress with dislocation density under high strain rate conditions is given by[24]
r¼aGbpffiffiffiq; ½1
wherer is the peak flow stress,a ~0.45;Gis the shear modulus; bis the Burgers vector; andq the dislocation density. For e_¼1 and 10 s1, r= 325 and 225 MPa, respectively, (Figure1) and for RR1000 at 1100C, G= 46.2 GPa, m= 0.436, Vm (molar volume) of c
phase = 7.449106m3 and b = 2.5491010 m. From Eq. [1], the dislocation densities areq (e_¼1 s1) ~1.8291015m2 and q (e_¼10 s1)~ 3.7991015 m2, which is 910 greater than that reported in
Reference 12 under comparable deformation condi-tions. The driving force is then given by[24]
Pd¼aGb2q: ½2 Therefore, the driving force, Pd (e_¼1 s1)
~ 2.44 91012Jlm3 and Pd (e_¼10 s1)
~ 5.0891012Jlm3. The driving force is expressed per unit volume, since it corresponds to the free energy per volume, which is released as the strain-free grains consume the strained matrix. However, it should be emphasized that the dislocation density can vary across grains, depending on whether the grain has most recently re-crystallized or not. Therefore, this estimate of the driving force is an average value.
[image:13.594.125.507.35.324.2]The retarding force arises from pinning from the precipitates at the grain boundary. The inter/intragran-ularc¢precipitates in the as-HIP condition are coherent, as in Figure4(f). Although adiabatic heating effects exist, as in Figures2(a) and (b), the time for deforma-tion, which is 1 and 0.1 seconds corresponding to strain rates ofe_¼1 and 10 s1, respectively, is insufficient for dissolution of c¢ precipitates[25] and a similar observa-tion has been reported in Reference 12. The approach for calculation of the driving force and comments on the retarding force for DRX have similarities with that reported in Reference12. The driving force in both cases has shown to be proportional to the dislocation density, which is calculated from the flow stress. The main difference arises in Eq. [1], where in the present case the Fig. 12—Backscattered electron images from etched sections (etched with phosphoric acid) corresponding to (a) as-HIP, (b)e_¼0:1 s1deformed
at 1413 K (1140C), (c)e_¼1 s1, (d) _e¼10 s1 deformed at 1373 K (1100C). Samples heated to 1443 K (1170C) and cooled to 1373 K
peak stress is considered,c.f., Figure1. In Reference12, however, a much lower flow stress of 50 MPa was considered, which accounts for the lower dislocation density. A similar approach is adopted for the retarding force, which arises from the presence of incoherent inter/ intragranular primary precipitates, although unlike in Reference 12, no explicit calculations are made in this study.
2. Mechanisms for formation of incoherentc¢ precipitates
The occurrence of incoherent inter/intragranular pri-mary precipitates following hot compression at 1100 C (sub-solvus) at strain rates,e_¼1 ande_¼10 s1requires an explanation. Coherent precipitates interact with the grain boundary in three ways[26,27]:
(a) The precipitate retains its coherency if dissolution of the precipitate occurs at the grain boundary. The solute supersaturation (Al, Ti) following dissolution results in precipitation of coherent precipitates withincmatrix behind the boundary. (b) When the boundary is pinned by the precipitate partial coherency loss occurs accompanied by a change in shape of the precipitate at the grain boundary. The increased particle radius subse-quently results in capillarity-driven coarsening of the intergranular precipitate.
(c) Complete loss in coherency occurs when the grain boundary sweeps past the precipitate. If the initial coherent c¢ precipitate lies in c-grain 1, then consumption of c-grain 1 by c-grain 2 through advancement of the grain boundary results in the
c¢precipitate being incoherent withc-grain 2. In case of (a), the rate of precipitate dissolution just ahead of the grain boundary should be sufficiently rapid and, able to keep pace with the mobility of the boundary. This has been reported in Reference4, where the c grain re-crystallization front dissolves c¢, which then precipitates discontinuously or continuously and
coherently with cmatrix phase. However, the predom-inant incoherent primary c¢ precipitates for e_¼1 and 10 s1indicate that complete dissolution of coherentc¢ precipitates ahead of the grain boundary does not occur. The existence of incoherent primary c¢ precipitates suggests two possible mechanisms.
Mechanism (i)—The remnant plastic strain within the cmatrix also provides a driving force for post-dynamic or meta-dynamic re-crystallization (MDRX) of c¢ pre-cipitates homogeneously or heterogeneously (intergran-ular) within cmatrix. The nucleation and growth rates are given by the following expressions[28,29]:
_
J¼N0Zbexp
DG
RT
exp s t
; ½3a
v¼ D@Cc
@t
Cc0Cc
; ½3b
DG ¼16pr 3
3DG2 v
; ½3c
where N0 = density of active nucleation sites/volume
(number m3); Z = Zeldovich non-equilibrium factor that corrects for the equilibrium concentration of critical nuclei for the loss of nuclei to growth (unitless);b= rate of atomic attachment to the critical nuclei (s1);DG* is the activation energy for nucleation;ris the interfacial energy;DGvis the Gibbs volumetric free energy realized
during nucleation of a precipitate phase; Cc¢and Cc is
the elemental concentration in c¢ and c at the c/c¢ interface; and D = elemental diffusivity in c phase (m2s1). Therefore,J has units of number m_ 3s1.
The number of active nucleation sites is dependent on the dislocation density and is given by[30]
N0¼q
6:0231023
Vm
1=3
[image:14.594.38.523.36.216.2]; ½4
where q is the dislocation density. Using N0 and the
remaining parameters in Eq. [3a] are from Reference31 from which the nucleation rates can be calculated and given by
_J(_e¼1 s1)~7.991024
nuclei m3s1 _J(_e¼10 s1)~ 16.191024
nuclei m3s1
The dislocation density can vary across grains, but importantly a large fraction has been consumed during DRX involving c grains. Therefore, this nucleation density is an upper bound, specifically when comparing with the simulations of slow continuous cooling in the case of the alloy UDIMET 720 Li, where J_ ~ (1014 to 1016) nuclei m3s1 for a typical cooling rate of 0.5 K min1 from 1453 K (1180C).[28] However, it must be pointed out that nucleation rate of c¢ precip-itates from Eq. [3a] does not distinguish between coherent precipitates and incoherent precipitates.
Nevertheless, the role of MDRX is expected to be more prevalent in case of _e¼10 s1, where the twofold increase in Pd following from Eq. [2] provides the
driving force for nucleation and growth of strain-freec¢ precipitates. In case of e_¼1 s1, c¢ precipitates pre-dominantly nucleate on grain boundaries and therefore will be incoherent. However, sporadic instances of intergranular c¢ precipitates are observed, but which are coherent with c matrix phase, as highlighted by white arrows in Figure5(d). This indicates that these precipitates have nucleated homogeneously within the bulk, but a situation akin to (b) is observed, where the boundary that intersects the precipitate is pinned and some loss of coherency at the boundary will occur. The intergranular incoherent precipitates also are predomi-nantly associated with a local average misorientation <0.5 deg, as shown in Figure5(e), thereby indicating strain-free c¢precipitates and occurrence of MDRX. In case of e_¼10 s1, the precipitates are predominantly intragranular, which points to another mechanism related to (c).
Mechanism (ii)—If thec¢precipitates cannot pin the grain boundary owing to large driving force, then the boundary will sweep past the precipitates. The driving force is consumed during grain growth and advance-ment of the boundaries will be retarded and the grain boundary will eventually be pinned. The Zener pinning force is given by[24]
Pz¼
3fr
2r ; ½5
where r is the grain boundary energy, f = volume fraction of precipitates, andr= precipitate radius. It is not straightforward to use Eq. [5] for calculation of the pinning force, since there is a continuous growth of the precipitates during cooling with a progressive increase in both f as well as r, which affects Eq. [5]. Further, the distribution of primaryc¢precipitates oncgrains are not random, with a distinct concentration at grain edges and corners. Nevertheless, as in the case of the driving force, the approximate pinning force in relation to the microstructure in Figure5(d) can be made, where from image analysis,f~0.07 andr~0.8lm, averagecgrain
size~ 1.46 lm andr ~ 1 J m2.[12] From Eq. [6], PZ ~
0.1391012Jlm3, which is 5 pct of the maximum driving force. In case of_e¼10 s1, owing to the twofold increase in driving force, thecgrain boundaries initially breakaway from the primary c¢ population, which explains the intragranular incoherent population. Only in the later stages, as ine_¼1 s1, the grain boundaries are pinned. Using Eq. [6] and forf~0.05 andr~0.8lm gives,PZ ~0.0991012Jlm3, which is two orders of
magnitude smaller than the driving force. The existence of a number of incoherent intragranularc¢precipitates, with local average misorientation ~ 3 deg (Figure6(e)) is consistent with the homogenous nucleation of thesec¢ precipitates within the initially strained c grains. The subsequently strain-free nucleated c grains formed via DRX (local average misorientation<0.5 deg, as in Figure6(e)) and their high mobility results in inco-herency of c¢ precipitates when the grain boundaries sweep past these precipitates.
In lieu of mechanisms (i) and (ii), some comments must be made in relation to heteroepitaxial re-crystal-lization (HERX) reported in Reference 3, where the focus is on cgrains, which nucleate as a thin rim of c phase on primaryc¢precipitates. This is distinct to this study, since the focus here is on the incoherent c¢ precipitates that form. HERX presupposes the existence of incoherent c¢ precipitates to account for the subse-quent re-crystallization of c grains during DRX. Also, HERX occurs for low strains, typically,e<0.6, which is smaller than the strains in this study,c.f., Figures3(a) and (b).
B. Evolution of Gamma Prime Precipitates following Sub-solvus and Super-solvus Heat Treatment
XabBð Þ ¼r XabBðr! 1Þ 1þ2rV
b m
rRT
; ½6
where XB ab
(r fi ¥) is the concentration in the matrix phase at the planara/binterface;ris the surface tension; Vmb is molar volume ofbphase. Classical theories have
been developed to consider shape factors as well as anisotropy in interfacial energy in the dissolution kinetics of precipitates[33–35] as well as the role of the initial particle size distribution.[36] A detailed analysis therefore will require size distribution of the initial incoherent and coherent precipitates. In case of the former, to some extent this can be obtained from image analysis of Figures 5(d) and6(d), while the distribution of the coherent precipitates can be obtained from high-magnification views of Figures5(c) and6(c). How-ever, it can be observed that the incoherent precipitates are irregular in shape and stereology plays a key role in coarsening and dissolution when anisotropy of surface energy exists. Therefore, a phenomenological approach is adopted to qualitatively address the dissolution of the incoherent precipitates. The driving force for coarsening arises fromr/rin Eq. [6] and the rate of coarsening will be governed by the characteristic length. Owing to the irregular shape it is not straightforward to measure the radius of primary incoherent c¢, but from Figures 4 through 6, an average radius of ~ 0.5lm can be reported. While for coherent precipitates r ~ 0.02 J m2[37] in case of the incoherent ones, r ~ 1 J m2[12] and therefore, r/r (incoherent) ~ 29106J m3. The size of coherent intragranular c¢ is at least 20 times smaller, ~ 0.025lm and r/r (coherent) ~ 0.89106J m3. Therefore, dissolution of the incoherent population will occur with a rate that is dependent on the initial particle size distribution. This is consistent with the observed intragranular precipitate distribution in Figures 8(b),9(b), and10(c) correspond-ing to e_¼1 s1 and Figures8(d), 9(d), and 11(c) corresponding toe_¼10 s1. The precipitate fraction at the surface and center for e_¼1 s1 and at the surface for 10 s1are comparable,~ (0.11 to 0.12), but that at the center fore_¼10 s1is greater byDVf(c¢)~0.04. A
possible explanation for the increased primary c¢ frac-tion at the center for the higher strain rate suggests that a larger isothermal hold timet>5400 seconds (90 min-utes) is required for attaining the equilibrium fraction ~ (0.11 to 0.12). However, the heat treatment experi-ments in Reference25report a typical annealing time of ~ 1200 seconds (20 minutes), when an equilibrium fraction is reached. The role of strain in the evolution of the equilibrium precipitate fraction on heating to a given sub-solvus temperature therefore requires further investigation.
On the other hand, the role of remnant plastic strain in the evolution of the precipitate morphology can be more readily investigated using super-solvus conditions. At super-solvus temperatures all precipitates are dis-solved and nucleate during subsequent cooling, where the observed inter/intragranular precipitates display two distinct morphologies, blocky intergranular and
dendritic intragranular, Figures12(a) through (d). How-ever, unlike in isothermal sub-solvus heat treatment, during continuous cooling, precipitates nucleated near the quenching temperature will not be resolved metal-lographically and consequently it is not possible to reliably measure the total precipitate fraction at 1373 K (1100C) prior to quench. Therefore, from the equilib-rium precipitate fraction at 1373 K (1100C), by subtracting the blocky intergranular and dendritic intragranular fraction in SectionIII–C–2, the fine intra-granular secondary population can be calculated. In fact, such an approach in principle can be adopted at any temperature, by coupling image analysis on a quenched section with the equilibrium fraction com-puted at that given temperature. The first step is therefore calculation as a first approximation of the precipitate fraction at 1373 K (1100C) from a ther-modynamic model. The precipitation kinetics simulation that was employed in this study is a mean-field formu-lation of the Svoboda et al.particle growth model in a super-saturated matrix,[38]which has been then adapted to use a fast-acting surrogate model for the phase Gibbs energy and the diffusivities and chemical potentials of the alloying elementsvstemperature.[39]The model also considers the effect of misfit strain between the matrix and precipitate phase on the free energy of the system as well as a temperature-dependent interfacial energy. Previous studies on common powder alloys for disc rotor applications have established the initial value of this interfacial energy,[40]and recent internal Single-Sen-sor Differential Thermal Analysis (SSDTA) data have been used to finely calibrate the model to match the onset and completion of precipitation. It should be noted that in the simulations only intragranular precip-itates are considered and associated with a typical nucleation site density, ~ 1028 m3, compared with ~ 1024m3in case of primary c¢ in SectionIV–A. The evolution of the c¢ population with temperature is presented in Figure13, where nucleation occurs at 1398 K (1125C) and the amount ofc¢is 13.5 pct at 1373 K (1100C). The subsequent secondary/tertiary popula-tions on quenching constitute 23 and 9 pct, respectively (not shown in Figure13), such that the overall c¢ amount is 45.5 pct at room temperature. For complete-ness, the evolution of c¢ is calculated up to 873 K (600C), although it must be emphasized that the c¢ fraction below 1373 K (1100C) contains both primary and secondary populations. Comparison is made with data reported in Reference 25, but importantly in the latter, thec¢fraction was measured in heating isothermal hold experiments, unlike in these simulations, which refer to cooling. Therefore, at 1373 K (1100C) as the total precipitate fraction is 0.135, the volume fraction of the secondary population at the center is (= 0.135measured volume fraction):
As-Hip0:09ð0:1350:045Þ
_
e¼0:1 s10:078ð0:1350:057Þ
_
e¼1 s10:059ð0:1350:076Þ
_
There is a fivefold difference in the amount of the intragranular morphology, which reinforces the key role played by plastic strain in the evolution of the different precipitate morphologies. A systematic quantitative calculation of the role of plastic strain in the evolution of c¢can be done using calorimetry, where the samples from different deformation pedigrees can be heated to a super-solvus temperature and then cooled[41] and the fraction calculated from enthalpy considerations or alternatively using detailed electron microscopy and atom probe tomography,[37]but both these methods lie outside the scope of this study.
The key implication of this study is that the defor-mation conditions will determine the fraction of inco-herent primary c¢ precipitates, which in turn during subsequent heat treatment will play a key role in the evolution of the secondary intragranular coherent pre-cipitates that are required for mechanical strength.
V. CONCLUSIONS
The objective of the current study was to investigate the microstructural evolution following compression and subsequent sub-solvus and super-solvus heat treat-ment in the Ni-based superalloy, RR1000. The following conclusions were made:
(1) Deformation was carried out on as-HIPped RR1000 under the following conditions: (a) 1373 K (1100C) to attain a final true strain, e ~1 for_e¼1and 10 s1and (b) 1413 K (1140C) to attain a final true strain,e ~ 1 fore_¼0:1 s1 Subsequent cooling at ~ 5 K s1 following deformation.
(i) Recovery accompanied by stress decay,Dr ~ [75 to 200] MPa occurs during forging, as well as dynamic re-crystallization (DRX) for e_¼1 and 10 s1 resulting in re-crystallized strain-free cgrains. This is more prominent for _e¼10 s1 associated with a higher driving force calculated from the dislocation density.
(ii) Primaryc¢precipitates occur as intergran-ular for e_¼1 s1 and inter/intragranular
for e_¼10 s1. In case of e_¼1 s1, meta-dynamic re-crystallization (MDRX) at grain boundaries results in the predom-inantly intergranular incoherent primary
c¢ population. In case of e_¼10 s1, the initial coherent nucleated/existing precipi-tates within c matrix become incoherent owing to their inability to dissolve just ahead of the advancing boundary or their inability to initially pin the boundary. (2) Following sub-solvus isothermal heat treatment
at 1373 K (1100C) for 90 minutes and water quenching:
(i) Precipitate coarsening occurs leading to the dissolution of the incoherent primary
precipitates. The resulting precipitate pop-ulation is predominantly coherent, though some sporadic incoherent precipitates exist.
(ii) There is a prominent intragranular c¢
(coherent/incoherent) precipitate popula-tion for e_¼10 s1 and an increased
pre-cipitate fraction, Vf (c¢)~0.04 compared
withe_¼1 s1 at the center.
(3) Following heating up to super-solvus tempera-ture, 1443 K (1170 C) and then slow cooling at 0.017 K s1 (1 K min1) to 1373 K (1100 C) and water quenching:
(i) Two distinct coherent precipitate mor-phologies are observed, i.e., primarily blocky intergranular and dendritic intra-granular, where the intergranular mor-phology becomes dominant with increasing strain.
(ii) Using numerical simulations, the role of strain in the evolution of the different precipitate morphologies was quantified. With increasing strain rate (strain), there is an increasing fraction of the blocky inter-granular morphology and concomitant lower distribution of the second intragran-ular morphology.
OPEN ACCESS
This article is distributed under the terms of the Creative Commons Attribution 4.0 International License (http://creativecommons.org/licenses/by/4.0/), which permits unrestricted use, distribution, and reproduction in any medium, provided you give appropriate credit to the original author(s) and the source, provide a link to the Creative Commons license, and indicate if changes were made.
REFERENCES
1. I.M.D. Parr, T.J. Jackson, M.C. Hardy, D. Child, C. Argyrakis, K. Severs. V. Saraf, and J.M. Stumpf: inProc. of the 13th Int. Symp. on Superalloys, Superalloys 2016, M.C. Hardy et al., eds., The Minerals Metals & Materials Soc., pp. 447–56.
2. S.S. Satheesh Kumar, T. Raghu, P.P. Bhattacharjee, G. Appa Rao, and U. Borah:J. Alloy Compd., 2016, vol. 681, pp. 28–42. 3. M.-A. Charpagne, J.-M. Franchet, and N. Bozzolo:Mater. Des,
2018, vol. 144, pp. 353–60.
4. A. Seret, C. Moussa, M. Bernacki, and N. Bozzolo:Metall. Mater. Trans. A, 2018, vol. 49A, pp. 4199–4213.
5. H. Jiang, L. Yang, J. Dong, M. Zhang, and Z. Yao:Mater. Des, 2016, vol. 104, pp. 162–73.
6. Y. Wang, S.L. Zhen, L. Yang, and X.M. Zhang:Mater. Sci. Eng. A, 2008, vol. 497A, pp. 479–86.
7. A.A. Guimares and J.J. Jonas:Metall. Trans. A, 1981, vol. 12A, pp. 1655–66.
8. J. Wang, J. Dong, M. Zhang, and X. Xie:Mater. Sci. Eng. A, 2013, vol. 566A, pp. 61–70.
10. H. Zhang, K. Zhang, H. Zhou, Z. Lu, C. Zhao, and X. Yang:
Mater. Des, 2015, vol. 80, pp. 51–62.
11. M.-A. Charpagne, T. Billot, J.-M. Franchet, and N. Bozzolo:J. Alloy Compd., 2016, vol. 688, pp. 685–94.
12. S.L. Semiatin, J.M. Shank, A.R. Shiveley, W.M. Saurber, E.F. Gaussa, and A.L. Pilchak: Metall. Mater. Trans. A, 2014, vol. 45A, pp. 6231–51.
13. D.M. Collins, B.D. Conduit, H.J. Stone, M.C. Hardy, G.J. Conduit, and R.J. Mitchell:Acta Mater., 2013, vol. 61, pp. 3378–91. 14. M.S. Lewandowski and R.A. Overfelt:Acta Mater., 1999, vol. 47,
pp. 4695–4710.
15. K. Huang and R.E. Loge:Mater. Des., 2016, vol. 111, pp. 578–74. 16. Y.Q. Chen, T.J.A. Slater, E.A. Lewis, E.M. Francis, M.G. Burke, M. Preuss, and S. Haigh:Ultramicroscopy, 2014, vol. 144, pp. 1–8. 17. A.R.P. Singh, S. Nag, S. Chattopadhyay, Y. Re, J. Tiley, G.B. Viswanathan, H.L. Fraser, and R. Banerjee:Acta Mater., 2013, vol. 61, pp. 280–93.
18. C. Papadaki, W. Li, and A.M. Korsunsky:Materials, 2018, vol. 11
(152), p. 8.
19. Y.Q. Chen, E. Francis, J. Robson, M. Preuss, and S.J. Haigh:Acta Materialia, 2015, vol. 85, pp. 199–206.
20. S.J. Hessel, W. Voice, A.W. James, S.A. Blackham, C.J. Small, and M.R. Winstone:Nickel Alloy for Turbine Engine Component, US Patent 6132527, 2000.
21. R.L. Goetz and S.L. Semiatin: J. Mater. Eng. Perform., 2001, vol. 10, pp. 710–17.
22. W. Pantleon, D. Francke, and P. Klimanek:Comput. Mater. Sci., 1996, vol. 7, pp. 75–81.
23. DEFORM is a registered trademark of Scientific Forming Technologies Corporation, 2545 Farmers Drive, Suite 200, Columbus, OH.
24. F.J. Humphreys and M. Hatherley:Recrystallization and Related Phenomena. Elsevier Science Ltd., Oxford, 1996, Chapters 3 and 9. 25. D.M. Collins: PhD Thesis, University of Cambridge, UK, 2011. 26. A. Porter and B. Ralph:J. Mater. Sci., 1981, vol. 16, pp. 707–13. 27. V. Randle and B. Ralph:Acta Metall., 1986, vol. 34, pp. 891–98.
28. R. Radis, M. Schaffer, M. Albu, G. Kothleitner, P. Polt, and E. Kozechnik:Acta Mater., 2009, vol. 57, pp. 5739–47.
29. T.P. Gabb, D.G. Blackman, D.Y. Wei, D.P. Mourer, D. Furrer, A. Garg, and D.L. Ellis: in Proc. of the 9th Int. Symp. On Superalloys, Superalloys 2000, T.M. Pollock et al., eds., The Minerals Metals and Materials Soc., 2000, pp. 405–14.
30. J.W. Cahn:Acta Metall., 1956, vol. 4, pp. 572–75.
31. Thermo-Calc 2016a, TCNI8/MOBNI4, Thermo-Calc Software AB, Ra˚sundava¨gen 18, 169 67 Solna, Sweden.
32. D. Porter and K. Easterling:Phase Transformations in Metals and Alloys, 2nd eds, CRC Press, Boca Raton, 1992.
33. K. Kim and P.W. Voorhees: Acta Mater., 2018, vol. 152, pp. 327–37.
34. E. Kozeschnik and J. Svoboda:Mater. Sci. Eng. A, 2006, vol. 441, pp. 68–72.
35. J. Svoboda, F.D. Fischer, P. Fraftzl, and E. Kozeschnik:Mater. Sci. Eng. A, 2004, vol. 385, pp. 166–74.
36. M. Perez, M. Dumont, and D. Acevedo-Reyes:Acta Materialia, 2008, vol. 56, pp. 2119–32.
37. S.S. Babu, M.K. Miller, J.M. Vitek, and S.A. David:Acta Mater., 2013, vol. 61, pp. 280–93.
38. J. Svoboda, F.D. Fischer, P. Fratzl, and E. Kozeschnik:Mater. Sci. Eng. A, 2004, vol. 385(1–2), pp. 166–74.
39. M.J. Anderson, C. Panwisawas, Y. Sovani, R.P. Turner, J.W. Brooks, and H.C. Basoalto: Acta Mater., 2018, vol. 156, pp. 432–45.
40. G.B. Olson, H.-J. Jou, J. Jung, J.T. Sebastian, A. Misra, I. Locci and D. Hull: in Proc. of the 11th Int. Symp. on Superalloys, Superalloys 2008, The Minerals Metals and Materials Society, 2008, pp. 923–32.
41. F. Masoumi, D. Shahriari, M. Jahazi, J. Cormier, and A. Devaux:
Sci. Rep., 2016, vol. 6, p. 28650.
![Table I.Nominal Composition (Weight Percent) of the Ni-Based Superalloy, RR1000[20]](https://thumb-us.123doks.com/thumbv2/123dok_us/9422773.445557/2.594.40.530.629.694/table-nominal-composition-weight-percent-ni-based-superalloy.webp)