Using Artificial Intelligence Techniques for
Evaluating Practical Art Products for the
Students in Art Education
A. E. E. Elalfi
Computer Science Department
Faculty of Specific Education
Mansoura University
M. F. Elatawy
Computer Science Department
Faculty of Specific Education
Mansoura University
Nadia M. Mahmoud
Computer Science Department
Faculty of Specific Education
Mansoura University
ABSTRACT
This paper develops a new technique to evaluate students’ performance in both designing and drawing subjects automatically without human intervention. This new technique leads to an accurate and quick evaluation. It is based on image processing. It differs from hand assessment in saving big time and effort for the faculty members and achieving credibility between students. Besides improving student grade with identifying points of strengthens and weaknesses, results evince that image processing method is excellently dependable in assessing art images.
Keywords
Image Processing, Artificial Intelligence, Art Education, GLCM, Machine Learning.
1.
INTRODUCTION
Art education as an important part in educational process aims to educate the student and change his behavior by using art to improve his skills, traditions and provide him with concepts which make him a desirable element in the society and this can be achieved by producing artworks not as a goal itself but as a way to reach a level of integration of student’s character [1].
Evaluation of art education includes referring to the level of results achieved by the students. Evaluation must be seen from all sides regarding its relation to nature and how it will achieve student’s distinctive art methods, so evaluations of a student in art education reflect talents and skills owned depending on his special talents from one hand and on instructions on the other hand [2].
Evaluators have not been exempt to the generally argumentative and multiplicity in the research community. This is because assessments are often carried out on programs that were designed to help troubled and oppressed people. The straight connection between the evaluation of educational programs and access to resources sets the stage for tautness that can sometimes result in conflicts. [3]
an enhanced image and to extract advantageous information from it [5].
2.
PREVIOUS KNOWLEDGE
Mileta Zarkovic and Zlatan Stojkovic [6] had presented a methodology that based on artificial intelligence for power transformers classification and blemish detection. The probability of the presented method of monitoring is to support theengineers to make decisions around the insistence of intervention and the kind of power transformer maintenance . The results show acceptable efficacy in detecting various faults.
A. Khandual et al. [7] had demonstrated a technique using image processing. It might be applied by taking fibre images from USB camera to assess fibre angle precisely. This assessment method could probably be employed in many fields of photogrammetric applications, biomedical imaging and material engineering.
A. Shams Nateri et al. [8] had presented an image processing technique to evaluate the yarn defects. At first, images were taken using digital scanner, second the acquired images were processed using various filters. Finally, the defects of the yarn were specified according to their surface area and geometric shape. The results indicate that image processing methods are highly reliable for evaluating number and kind of yarn defects.
International Journal of Computer Applications (0975 – 8887) Volume 182 – No. 15, September 2018
Section5: The proposed system description.
Section6: Application and results.
Section7: Conclusion and future work.
3.
PROPOSED METHOD
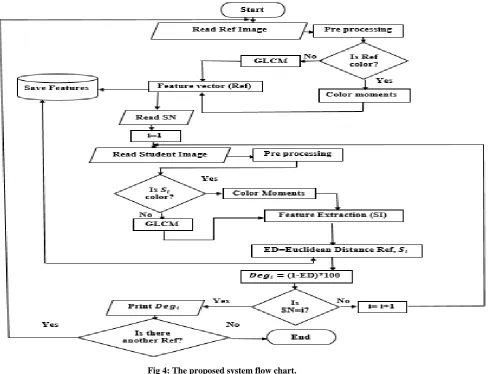
Image processing is used in this study to assess student performance in designing and drawing subjects. The proposed system flow chart is depicted in figure 4. The first stage is to acquire the student
’
s answer sheet image.3.1 Student
’
s Image Acquisition
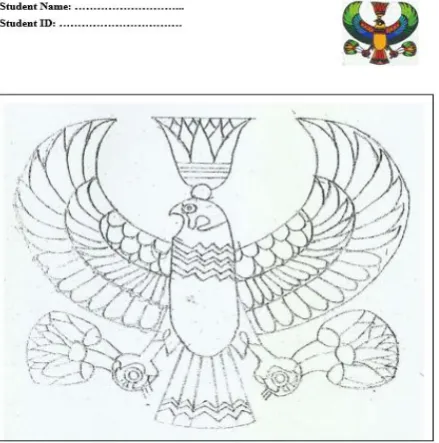
[image:2.595.318.540.74.276.2]Two answer sheets are designed to facilitate the student evaluation in both drawing and designing subjects. The answer sheet of the drawing subject includes three parts: the first one is located in the upper right corner. It is the image to be used as a reference. The second is the student name and student ID. They are located at the upper left. The rest contains the image that will be colored by the student. The answer sheet of designing subject is designed as the same as the drawing one but the rest includes the drawing center c and the 8 vertices to assist the student to design the shape in the defined center. The answer sheets of the two subjects are shown in figures 1, 2.
[image:2.595.59.279.337.559.2]Fig 1: Answer sheet for drawing subject.
Fig 2: Answer sheet for designing subject.
These images are the required images for the image acquisition. The student
’
s answer sheet image for both subjects is shown in figure 5.Fig 3: student final answer sheet.
3.2. Feature Extraction
The second stage is to extract answer sheet image features. Since subjects in art education (Designing& Drawing) are selected for this study. Then two methods for feature extraction were used for color and gray images. The color moments and Grey-Level Co-occurrence Matrix feature for colored images and gray scale image respectively.
3.2.1 Color Moments (CM)
[image:2.595.322.567.342.460.2]Fig 4: The proposed system flow chart.
Mean
It is known as the average color value in an image and defined as [12]:
𝐸
𝑖
=
1
𝑁
𝑝
𝑖𝑗
𝑁
𝑗 =1
(1)Where:
N is the number of pixels in the image.
𝑝
𝑖,𝑗 is the𝑖
𝑡ℎ color channel at the𝑗
𝑡ℎ image pixel.Standard deviation
It is defined as the square root of the variance of the distribution which computed as [13]:
𝜎
𝑖=
1𝑁𝑗 =1
𝑝
𝑖𝑗 − 𝐸𝑖 2(2)
Kurtosis
The kurtosis of a distribution is defined as:
𝐾
𝑖=
1𝑁
𝑝
𝑖 𝑗 − 𝐸𝑖 4 𝑁𝑖=1
4
(4)
Finally, the feature vector FV1 of RGB image will include 12 features. It can defined as follows:
FV1=
𝐸
𝑅𝑖 , 𝜎𝑅𝑖, 𝑆
𝑅𝑖, 𝐾
𝑅𝑖, 𝐸
𝐺𝑖 , 𝜎𝐺𝑖, 𝑆
𝐺𝑖,
𝐾
𝐺𝑖 ,𝐸𝐵𝑖 , 𝜎 𝐵𝑖 ,𝑆𝐵𝑖 ,𝐾𝐵𝑖 (5)3.2.2 Gray Level Co-occurrence Matrix
International Journal of Computer Applications (0975 – 8887) Volume 182 – No. 15, September 2018
𝑃(𝑖, 𝑗)
represents the(𝑖, 𝑗)
value of theGLCM.
Contrast.
It is the indolence moment near the main diametrical of the GLCM, which reflects the image clarity and the groove depth of texture.
Contrast
= 𝑖 − 𝑗
𝑖,𝑗
2
𝑝 𝑖, 𝑗
(7)
Correlation.
It is a measurement of element similarity degree of the GLCM in the row or the column direction. Therefore, the correlation value can reflect the local gray-level correlation of the image.
Correlation
=
𝑖−𝜇
𝑖𝑗 −𝜇
𝑗𝑝 𝑖,𝑗
𝜎
𝑖𝜎
𝑗𝑖,𝑗
(8)
Where:
𝜇
𝑖,𝜇
𝑗 represent the horizontal and the vertical means in the matrix.𝜎
𝑖,𝜎
𝑗 represent standard deviation.Homogeneity.
It measures the regularity of the non-zero entries in the GLCM and weights values by the inverse of contrast weight. It is defined as:
Homogeneity = 𝑖,𝑗1+ 𝑖−𝑗 𝑝 𝑖,𝑗 (9)
Entropy.
It is used for measuring the randomness image texture.
Entropy = 𝐼𝑛 𝑝 𝑖, 𝑗 𝑖,𝑗 𝑝 𝑖, 𝑗 (10)
Finally, the feature vector FV2 of gray image can be defined as:
FV2=
𝐸𝑛𝑒𝑟, 𝐶𝑜𝑛𝑡, 𝐶𝑜𝑟𝑟, 𝐻𝑜𝑚𝑜, 𝐸𝑛𝑡𝑟𝑜
(11)4.
SIMILARITY MEASUREMENT
The third stage in student’s answer sheet evaluation is to find the similarity between reference image and student’s answer
sheet image. The Euclidean distance can be given by the following formula [17]:
𝐷𝑖𝑠𝑡 𝑥, 𝑦 = 𝑛𝑖=1 𝑥𝑖− 𝑦𝑖 2 (12)
Where:
𝒏
represent the number of features for point x , y.𝑥
𝑖,𝑦
𝑖 are the𝑖
𝑡ℎ feature of point ( x, y).5.
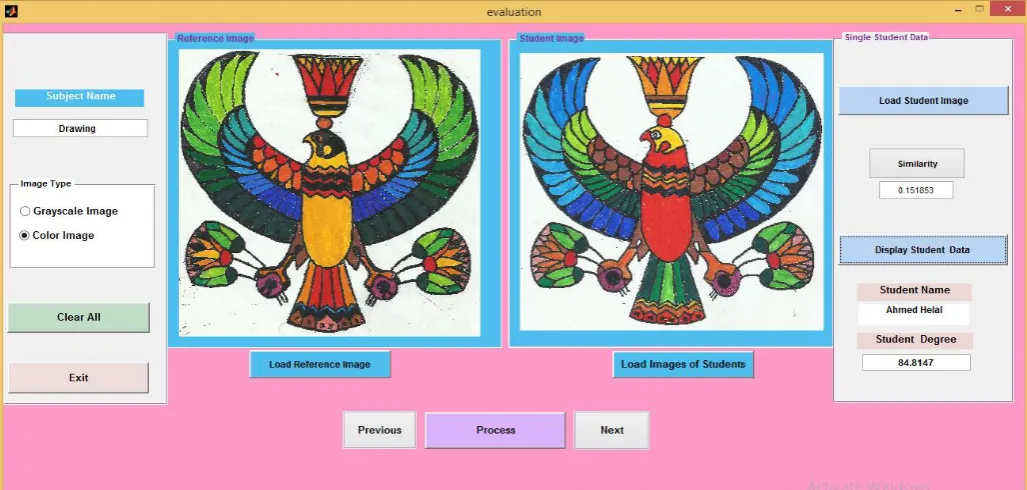
THE PROPOSED SYSTEM GUI
The GUI of the proposed system is shown in figure 5 and includes:
“Subject name” is used to determine which subject will be assessed.
Panel “image type” is used to identify grayscale image if designing subject is selected and color image if drawing subject is selected.
Button “load reference image” is used to choose the template image from its place.
Button “load images of students” is used to determine all images of 30 student to be evaluated.
Button “process” is used to find the similarity between reference image and all students images.
Button “Next” to preview the next student data.
Button “Previous” to preview the previous student data.
Button “clear all” is used to clear GUI.
Button “Exit” is used to close GUI.
Panel “single student data” consists of :
– Button “load student image” is used to identify only one student image.
– Button “Similarity” is used to find the euclidean distance between two images.
Fig 5: The graphical user interface of the proposed system.
Table 1. A random sample of students in the drawing subject.
Student
Name
Student
Image
Proposed
System
Result
Expert1
Result
Expert2
Result
Expert3
Result
1
Ahmed Helal84.8147
85
80
85
2
Adel Lotfy93.5266
95
90
85
3
MohamedFathy
60.3711
65
60
55
4
Saad Sadeek69.839
70
70
60
5
WalaaInternational Journal of Computer Applications (0975 – 8887) Volume 182 – No. 15, September 2018
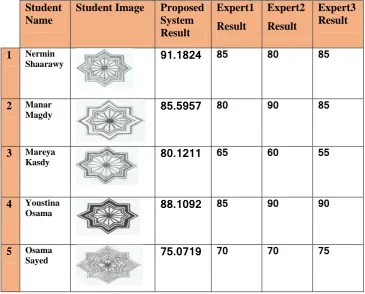
Table 2. A random sample of students in the designing subject.
Student
Name
Student Image
Proposed
System
Result
Expert1
Result
Expert2
Result
Expert3
Result
1
NerminShaarawy
91.1824
85
80
85
2
ManarMagdy
85.5957
80
90
85
3
MareyaKasdy
80.1211
65
60
55
4
YoustinaOsama
88.1092
85
90
90
5
Osama [image:6.595.114.484.406.689.2]Sayed
75.0719
70
70
75
Table 3. The run time and CPU time of the student grade evaluation.
Features
Extracted
Run Time
(Sec)
CPU Time
(Sec)
Color
Moments
for
Red Image
4
1.070519
2232.867207
Color
Moments
for
Green Image
4
1.022159
2233.933302
Color
Moments
for
Blue Image
4
1.020001
2234.956177
GLCM
[image:6.595.118.482.406.692.2]5.1 Confusion Matrix
A confusion matrix is used for representing the information related to the predicted and the actual classifications done by the classification system [18].
Accuracy.
It is the rate of the number of correctly classified expert results to the proposed system results, and is calculated as [19]:
Accuracy
=
𝑇𝑃+𝑇𝑁
𝑇𝑃+𝑇𝑁+𝐹𝑃+𝐹𝑁
for each class. (11)Recall (Sensitivity).
It is the ratio of the TP to the total number of instances classified under positive class as follows:
Recall
=
𝑇𝑃
[image:7.595.55.495.221.516.2](𝑇𝑃+𝐹𝑁)
(12)
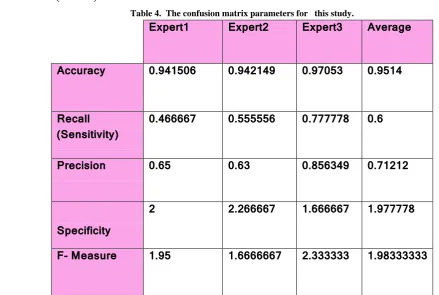
Table 4. The confusion matrix parameters for this study.
Expert1
Expert2
Expert3
Average
Accuracy
0.941506
0.942149
0.97053
0.9514
Recall
(Sensitivity)
0.466667
0.555556
0.777778 0.6
Precision
0.65
0.63
0.856349 0.71212
Specificity
2
2.266667
1.666667 1.977778
F- Measure
1.95
1.6666667
2.333333 1.98333333
Precision
It is defined as the rate of correctly classified data in the positive class to the total number of data classified as to be in positive class and computed as:
Precision
=
𝑇𝑃
𝑇𝑃+𝐹𝑃
(13)
F-Measure
International Journal of Computer Applications (0975 – 8887) Volume 182 – No. 15, September 2018
6.
CONCLUSION AND FUTURE WORK
This paper presented a useful application in the area of art education. Image processing technique in MATLAB could be employed here by taking art images from optical scanner to evaluate student image precisely. Color moments were used for true color images and GLCM for grayscale images. The proposed method proved its effectiveness and accuracy in evaluation. As a future potential for this work, the current protocol may be applied in archaeological museums to identify real and fake monuments. More over, based on the current research, it can be developed to assess 3D images and the geometric designs.
7.
REFERENCES
[1] A.Q.Omar,”Evaluation of practical side in the lesson of art education of the preparatory stage from the point of view of its teachers”, 2012, PP.520.
[2] Serag Farag, “Tests and Examinations-Measuring abilities and performance”, 2007, PP.214.
[3] Donna M. Mertens,”Research and evaluation in education and psychology: integrating diversity with quantitative, qualitative, and mixed methods “, 2014, ISBN 978-1-4129-7190-4.
[4] Trisha Chakraborty et al., “Review of Various Image Processing Techniques for Currency Note Authentication”, International Journal of Computer Engineering In Research Trends, Vol. 3, Issue 3, 2016, PP. 119-122.
[5] Michael J. Timms,” Letting Artificial Intelligence in Education Out of the Box: Educational Cobots and Smart Classrooms”, International Journal of Artificial Intelligence in Education, 2016, Vol. 26, Issue 2, PP. 701–712.
[6] Mileta Zarkovic and Zlatan Stojkovic,” Analysis of artificial intelligence expert systems for power transformer condition monitoring and diagnostics”, Electric Power Systems Research, Vol. 149, 2017, PP. 125-136.
[7] A. Khandual et al.,” Evaluation of Fibre Migration Angle by Image Processing Using Economic USB Camera and Matlab: Demonstrated Example”, Vol. 2, Issues 4–5, 2015, PP. 2463-2471.
[8] A. Shams Nateri et al.,” Evaluation of yarn defects by image processing technique”, Optik - International
Journal for Light and Electron Optics, Vol. 125, Issue 20, 2014, PP. 5998-6002.
[9] Malay Kishore Dutta et al.,” Image processing based method to assess fish quality and freshness”, Journal of Food Engineering, Vol. 177, 2016, PP. 50-58.
[10] J.Valença et al.,” Assessment of cracks on concrete bridges using image processing supported by laser scanning survey”, Construction and Building Materials, Vol. 146, 2017, PP. 668-678.
[11] Shiv Raj Singh and Shruti Kohli,” Enhanced CBIR using Color Moments, HSV Histogram, Color Auto Correlogram, and Gabor Texture”, International Journal of Computer Systems (ISSN: 2394-1065), Vol. 02, Issue 05, 2015.
[12] WWW.MathWorks.com, Monday, 2017.
[13] ZHI-CHUN HUANG et al.,” CONTENT-BASED IMAGE RETRIEVAL USING COLOR MOMENT AND GABOR TEXTURE FEATURE”, International Conference on Machine Learning and Cybernetics, 2010.
[14] Cristina Malegori et al.,” GLCM, an image analysis technique for early detection of biofilm”, Journal of Food Engineering, Vol. 185, 2016, PP. 48-55.
[15] H.M.R.B Herath, Y.P.R.D Yapa,” An Effective Combined Feature For Web Based Image Retrieval”, INTERNATIONAL JOURNAL OF SCIENTIFIC & TECHNOLOGY RESEARCH VOL. 4, Issue 10, 2015.
[16] K. Sai Prasad et al., “Artificial Intelligence approach for Classifying Molecular Dataset using Density based technique with appropriate Euclidean Distance measure”,Vol.4, Issue 8, 2017, PP. 8827-8836.
[17] Shadi Aljawarneh, Monther Aldwairi and Muneer Bani Yasin “Anomaly-based intrusion detection system through feature selection analysis and building hybrid efficient model”, 2017.
[18] Abir Ghosh et al.” Grid Color Moment Features in Glaucoma Classification”, International Journal of Advanced Computer Science and Applications, Vol. 6, No. 9, 2015.