14
Knowledge Discovery in Medical Database using
Machine Learning Techniques
Adebola K. Ojo
Department of Computer Science, University of Ibadan
Nigeria
Ahmed B. Olanrewaju
Department of Computer Science, University of Ibadan,
Nigeria
ABSTRACT
In this study, an attempt was made using machine learning techniques to discover knowledge that will assist policy makers in taking decisions that will ensure that the sustainable development goals on Health is met. Agglomerative Hierarchical clustering was used to cluster the states by personnel information (number of doctors, community health workers, nurses and midwives), this was visualized using a dendrogram. The Exploratory analysis revealed that it is only community health workers that are well distributed in all the states, the North West states have the least number of hospitals offering ante-natal services. Random Forest model was used to generate a feature importance to determine the important attributes that determined the availability of maternal health delivery services in a hospital, an important discovery was the fact that the availability of doctors does not in any way determine the availability of maternal health delivery services but rather community health workers, nurses and midwives are the major determinants. Random Forest algorithm was also used to classify hospitals offering maternal health delivery services and the result compared with Logistic Regression, Bagging and Boosting. The evaluation metrics used were accuracy, precision and recall. For accuracy and precision, Random Forest performed best while for recall it performed poorly compared to all the other algorithms.
Keywords
Random Forest, Hospitals, Agglomerative Hierarchical Clustering, Dendrogram
1.
INTRODUCTION
There is a dire need to discover knowledge in the database of health care centres distributed all over the country to ensure that adequate planning is made to improve the living standard in the country. There is no better time than now where the data is available and also publicly accessible to the research community. The goal of this database is to make the data collected available to planners, government officials, and the public, to be used to make strategic decisions for planning relevant interventions.
The Nigeria MDG (Millennium Development Goals) Information System – NMIS health facility data was collected by the Office of the Senior Special Assistant to the President on the Millennium Development Goals (OSSAP-MDGs) in partner with the Sustainable Engineering Lab at Columbia University. The goal of this database is to make the data collected available to planners, government officials, and the public, to be used to make strategic decisions for planning relevant interventions. A rigorous, geo-referenced baseline facility inventory across Nigeria is created spanning from 2009 to 2011 with an additional effort to increase coverage in 2014, to build Nigeria’s first nation-wide inventory of health
facility. The database includes 34,139 health facilities information in Nigeria. [1]. The need to draw useful insights and hidden pattern in the health care centres available in Nigeria.
Effective medical prevention and good access to healthcare resources are important factors that affect citizens’ welfare and quality of life. As such, these are important factors in strategic planning at the national level, as well as in planning at the regional and local community levels. Large quantities of data collected by medical institutions and governmental public health institutions can serve as a valuable source of evidence that needs to be taken into account when making decisions about priorities to be included in regional strategic health-care plans [2]
This study describes application of machine learning techniques to discover knowledge, by the use of supervised and unsupervised learning approaches to improve health care management. The goal of the Nigeria MDG Information System is to provide data to help the Nigerian government track and assess their progress toward achieving the Sustainable Development Goals (SDGs).
2.
LITERATURE REVIEW
Data mining is “the analysis of observational datasets to find unsuspected relationships and to summarize the data in novel ways that are both understandable and useful to the data owners” [3]. Considering data mining, the knowledge discovered must be previously unknown, non-trivial, and useful to the data owners [4]. Data mining techniques rely on either supervised or unsupervised learning and are grouped into four categories [5]. Clustering methods minimize the distance between data points falling within a cluster, and maximize the distance between these clustered data points and other clusters [6]. Finding Association Rules highlights hidden patterns in large datasets. Classification techniques, including Decision Trees, Rule-Based Algorithms, Artificial Neural Networks (ANN), k-Nearest Neighbours (k-NN or lazy learning), Support Vector Machine (SVM), and many others, build a model using a training dataset to define data classes, evaluate the model, and then use the developed model to classify each new data point into the appropriate class [5]. Outliers’ detection techniques focus on data points that are significantly different from the rest [7].
15 describe this information in an arbitrary language, e.g. in SQL
for describing a subset of the input data, which is of special interest for the domain, as model applicable to the data, in form of association rules, or by other means appropriate for the different purposes of the knowledge discovery. The goal of the whole KDD process is the extraction and application of knowledge derived from these patterns. KDD is an iterative and interactive process, which involves several steps and decisions being made by a user according to the underlying data and the purpose of knowledge discovery [8]. An overview of the different purposes and appropriate data mining techniques is given in the next section.. The different steps of the KDD process is presented in Figure 1.
This research is an unsupervised learning since we are looking for patterns that are non-trivial and clustering is being used. Clustering is a method of grouping together similar records in a data set. Automatic cluster detection is an undirected data mining technique. As a result of this it can be applied without
prior knowledge of the structure to be discovered. This is also its weakness in that if you do not know what you are looking for, it is difficult to recognize it when you find it., automatic cluster detection is most useful in this circumstances: it is suspected that the data set contains natural groupings that may represent states or regions that have a lot in common with each other. It may turn out that these are naturally occurring states segments that can be singled out for customized approaches. When there are many competing patterns in the data set making it hard to identify a single pattern. In this case automatic cluster detection can be used to create cluster of similar records thereby reducing the complexity of the data set so that other data mining techniques are more likely to succeed [9]
[image:2.595.79.517.273.457.2]Sufficient knowledge was discovered using the knowledge discovery process that could assist the policy makers in giving them directions in meeting the sustainable development goals in the health sector.
Figure 1: Basic flow of the KDD process [4]
3.
3. MATERIALS AND METHODS
The dataset used contained 33,149 hospitals, unfortunately they contain very many missing values and after removing records with missing features meeting the criteria, we were left with 26,238 hospitals. The following features were also
dropped: facility name, community, ward, formhub_photo_id ,gps, survey_id, unique_lga, sector, and facility_id since they were not used. A new feature was created which is the geographical region by grouping states in a geopolitical zone together.
[image:2.595.57.539.530.730.2]16 An exploratory data analysis was performed on the dataset,
the attributes of the database were grouped into personnel records and services available in the hospital.
In preparing the exploratory data analysis for the dataset, Pandas was used extensively to generate a cross tab of various features across the geographic region and states, after which various visualizations were presented using histogram, bar plot and strip plot.
[image:3.595.58.278.198.397.2]The procedure for the Agglomerative Hierarchical Clustering involves Importing the necessary Libraries for the Hierarchical Clustering as listed in Figure 3.
Figure 3:The list of libraries for Agglomerative Hierarchical Clustering
Here dendrogram, linkage, cluster and cophenet were imported from the scipy.cluster.hierarchy packages.
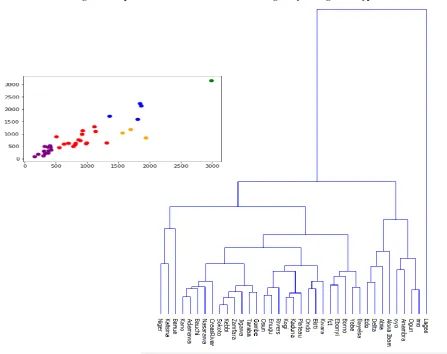
The cluster of interest is the states which serve as the target and the data is the personnel information which include number of doctors, nurses, midwives and community health workers. The dendrogram gives us a visual representation of the clusters and in estimating the centroid, the Average linkage criteria is used in order to estimate the number of centroids. we verify the number of clusters visually. using the dendrogram.
In classifying the hospitals offering maternal health delivery services, we need to do some cleaning by converting or encoding of the categorical features which include the facility type and the type of management using the following methods: Find and Replace, Label encoding and one hot encoding, but eventually the Find and Replace method was used. The scikit learn train-test split were used at the ratio 70:30, 70% for training and 30% for testing with random seed of 101. The feature importance was also carried out using the Random Forest model. The Logistic Regression uses only default parameter and nothing was changed. The Random Forest Classifier uses number of estimators to be 35, maximum depth is 20. The Boosting uses number of estimators to be 50 and a learning rate of 0.1. For Bagging, we used the logistic regression as the base estimator. The means of evaluation were the percentage accuracy, recall and precision on each model.
4.
RESULTS AND FINDINGS
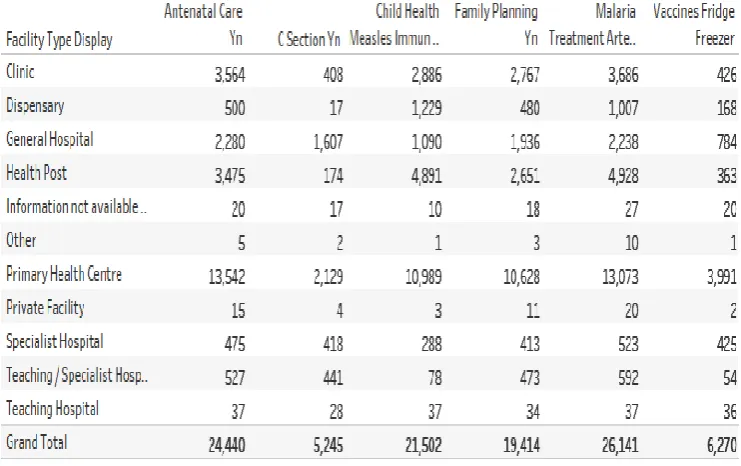
In this section, the resuts from the study were discussed. Table 1 presents the services available across categories of hospitals in Nigeria while Table 2 shows the personnels available across categories of hospitals in Nigeria. Figures 4 to 7 show the exploratory dta analysis.
[image:3.595.111.482.507.740.2]17
[image:4.595.61.540.124.626.2]Table 2: Personnels available across categories of Hospitals
18
Figure 5:Distribution of malaria treatment services across Regions and States
[image:5.595.68.529.290.546.2]19
Figure 7:Strip Plot Midwives and Doctors across Region by Management Type
[image:6.595.72.520.377.731.2]20 The exploratory data analyses reveal non-trivial information
especially the fact that it is only community health workers that are well distributed in all states. The northwest and northcentral region have about 30% of the hospitals not offering malaria treatment services while Kaduna, Niger and Benue states form the states having the least malaria treatment services. The number of hospitals with refrigerator to keep vaccines is so low and this cuts across all regions, confirming that the issue of power is a major challenge for the hospitals. In the area of ante-natal services, the northwest states are far behind amongst all the geographical region in terms of availability of the service and Katsina is the state having hospitals with the least number of ante-natal services. The distribution of doctors is more in the public hospitals compared to faith-based and private.
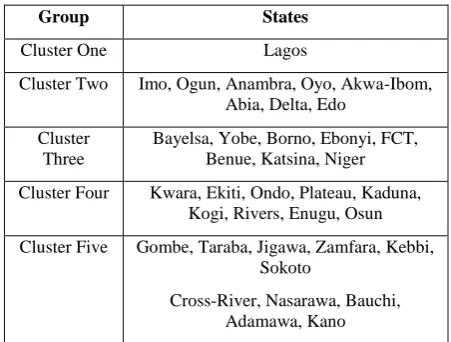
[image:7.595.315.541.86.257.2]The interpretation of the Agglomerative Hierarchical clustering visualized by a dendrogram reveals very interesting grouping and it also confirms the status of Lagos State, as the centre of excellence, it is the only state in its cluster. Table 3 shows the grouping of the states based on human capacity. Table 3 presents the distribution of clusters of states by personnel.
Table 3: A cluster distribution of states by personnel
Group States
Cluster One Lagos
Cluster Two Imo, Ogun, Anambra, Oyo, Akwa-Ibom, Abia, Delta, Edo
Cluster Three
Bayelsa, Yobe, Borno, Ebonyi, FCT, Benue, Katsina, Niger Cluster Four Kwara, Ekiti, Ondo, Plateau, Kaduna,
Kogi, Rivers, Enugu, Osun Cluster Five Gombe, Taraba, Jigawa, Zamfara, Kebbi,
Sokoto
Cross-River, Nasarawa, Bauchi, Adamawa, Kano
[image:7.595.92.509.371.564.2]The feature importance reveals some discoveries which are quite interesting and also confirming the obvious. Looking at the output shows that antenatal availability is the most important feature determining if a hospital will offer maternal health delivery services or not. It is also noteworthy that the availability of a full-time doctor is not in any way too important for having maternal health delivery services in a hospital. This is depicted in Figure 9.
21
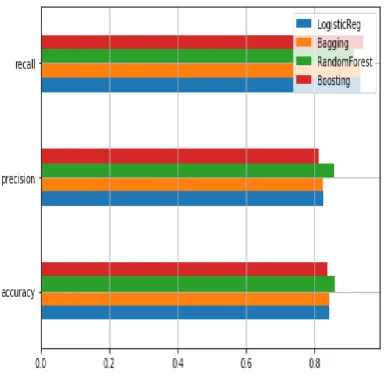
Figure 10: Evaluation metrics for The Models compared
In classifying hospitals offering maternal health delivery services using Random Forest and bench marking with Logistic Regression, Bagging and Boosting, it can be seen that each of the models has closely related results, across each of the various evaluation metrics for each of them.
From the result submitted so far, it can be concluded that Logistic Regression, Random Forest and Boosting are great classifiers, despite the fact that bagging which is an ensemble algorithm that was used, did not show any outstanding performance based on the evaluation metrics. This is depicted in Figure 10.
5.
REFERENCES
[1] F. Osinupebi 2018, "Energy access; Energy demand". http://csd.columbia.edu/2014/03/10/the-nigeria-mdg-information-system-nmis-takes-open-data-further/
[2] Nada Lavrac, Aleksander Pur, Marko Bohanec and Bojan Cestnik 2007. "Data mining and visualization for decision support and modeling of public health-care resources" Journal of Biomedical Informatics, 40 (4): 438–447.
[3] Jiawei Han 2006, Data Mining: Concepts and Techniques, San Francisco, Calif.: Morgan Kaufmann; Oxford: Elsevier Science [distributor], 2nd ed.
[4] Usama Fayyad, Gregory Piatetsky-Shapiro, and Padhraic Smyth, 1996, From Data Mining to Knowledge Discovery in Databases, American Association for Artificial Intelligence, AI Magazine.
[5] K. J. Cios, W. Pedrycz, R. W. Swiniarski, and L. A. Kurgan 2007, “Data mining: A knowledge discovery approach,” Springer, New York.
[6] Osmar R. Zaiane, Andrew Foss, Chi-Hoon Lee and Weinan Wang 2002, "On Data Clustering Analysis: Scalability, Constraints, and Validation". University of Alberta, Edmonton, Alberta, Canada. Chapter from book Advances in Knowledge Discovery and Data Mining, 6th Pacific-Asia Conference, PAKDD 2002, Taipei, Taiwan, May 6-8, 2002, Proceedings (pp.28-39)
[7] Ahmed Hammad and Simaan AbouRizk, 2014, "Knowledge Discovery in Data: A Case Study," Journal of Computer and Communications. 2(5): 1-27.
[8] Jiawei Han, Micheline Kamber and Jian Pei 2011, Data Mining: Concepts and Techniques, 3rd ed., The Morgan Kaufmann Series in Data Management Systems. Morgan Kaufmann Publishers, 2011. Elsevier ISBN 978-0123814791.
[9] Gordon S. Linoff, Michael J. A. Berry 2011, Data mining techniques: for marketing, sales, and customer relationship management, 3rd Edition John Wiley & Sons,ISBN: 978-1-118-08745-9.
![Figure 1: Basic flow of the KDD process [4]](https://thumb-us.123doks.com/thumbv2/123dok_us/9301090.428933/2.595.57.539.530.730/figure-basic-flow-kdd-process.webp)